
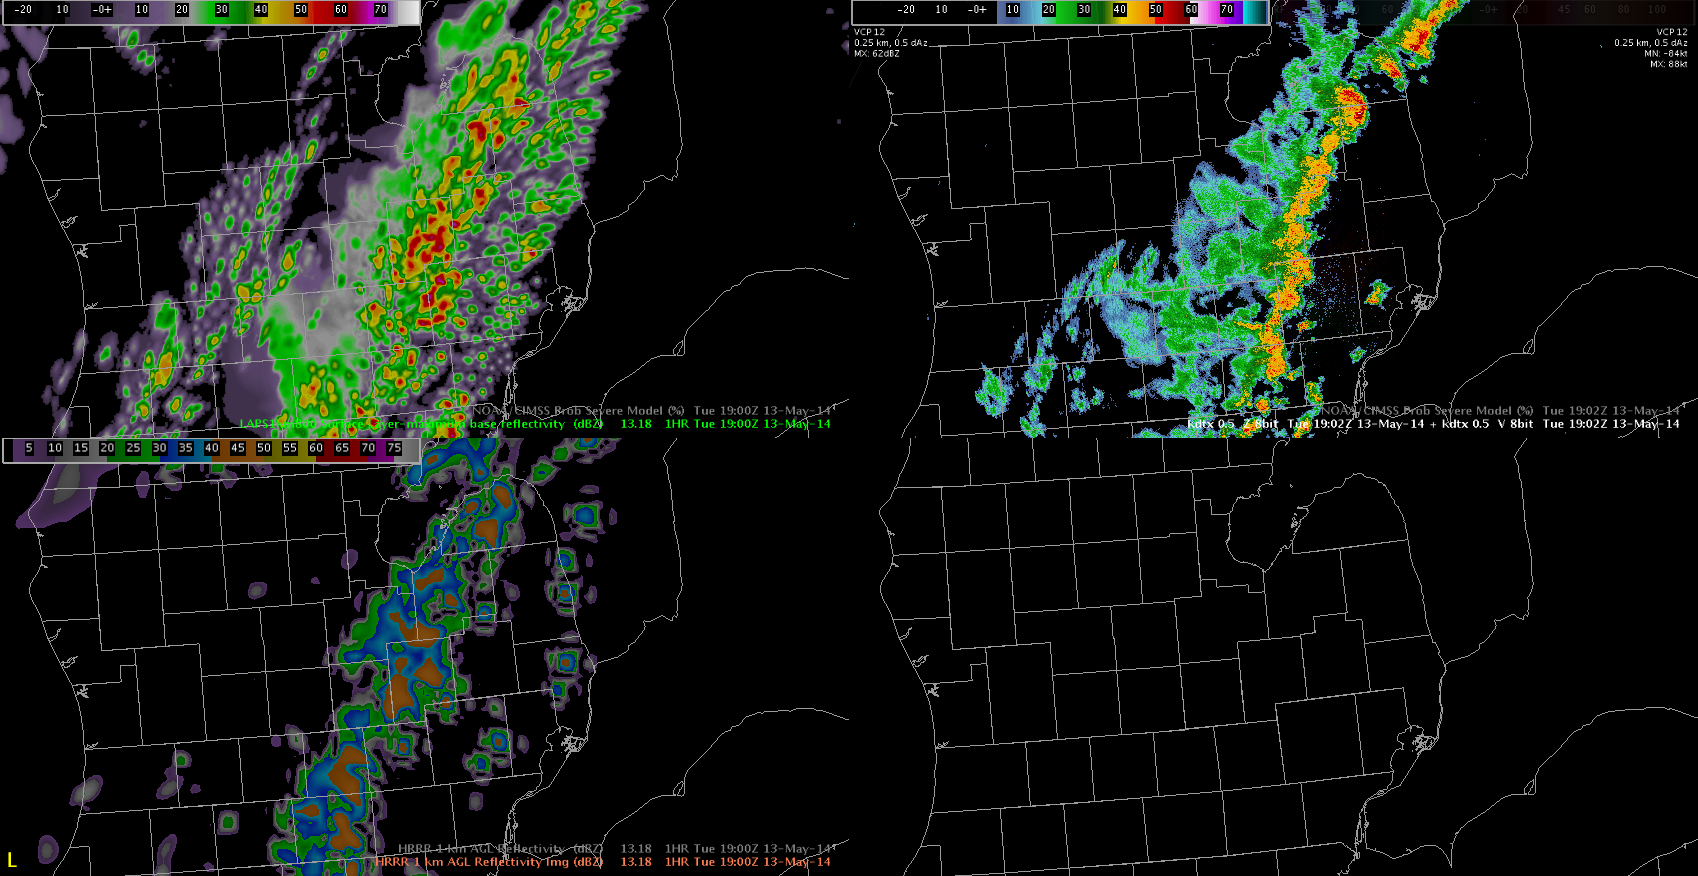
 Here is a screen shot from 19z focused on the DTX CWA. In this four-panel the upper left image is the 1 hour forecast from the 18z run of the vLAPS 1km Surface Layer Max Base Reflectivity, lower left is the 1 hour forecast for the 18z HRRR 1km AGL reflectivity and the upper right is 19z observed reflectivity from DTX. Overall the vLAPS is comparable with the HRRR in the placement of the stronger convection along a line extending south across eastern lower Michigan but the vLAPS is quite noisy with developing convection ahead of the main line that was not been observed by DTX Radar.
Shawn Smith