Moved from ABQ to SJT

With scattered thunderstorms and limited severe threat in the ABQ area, we have been moved to SJT to hopefully capture convection moving northeast into the area from the dry line and leftover outflow from last nights convection.

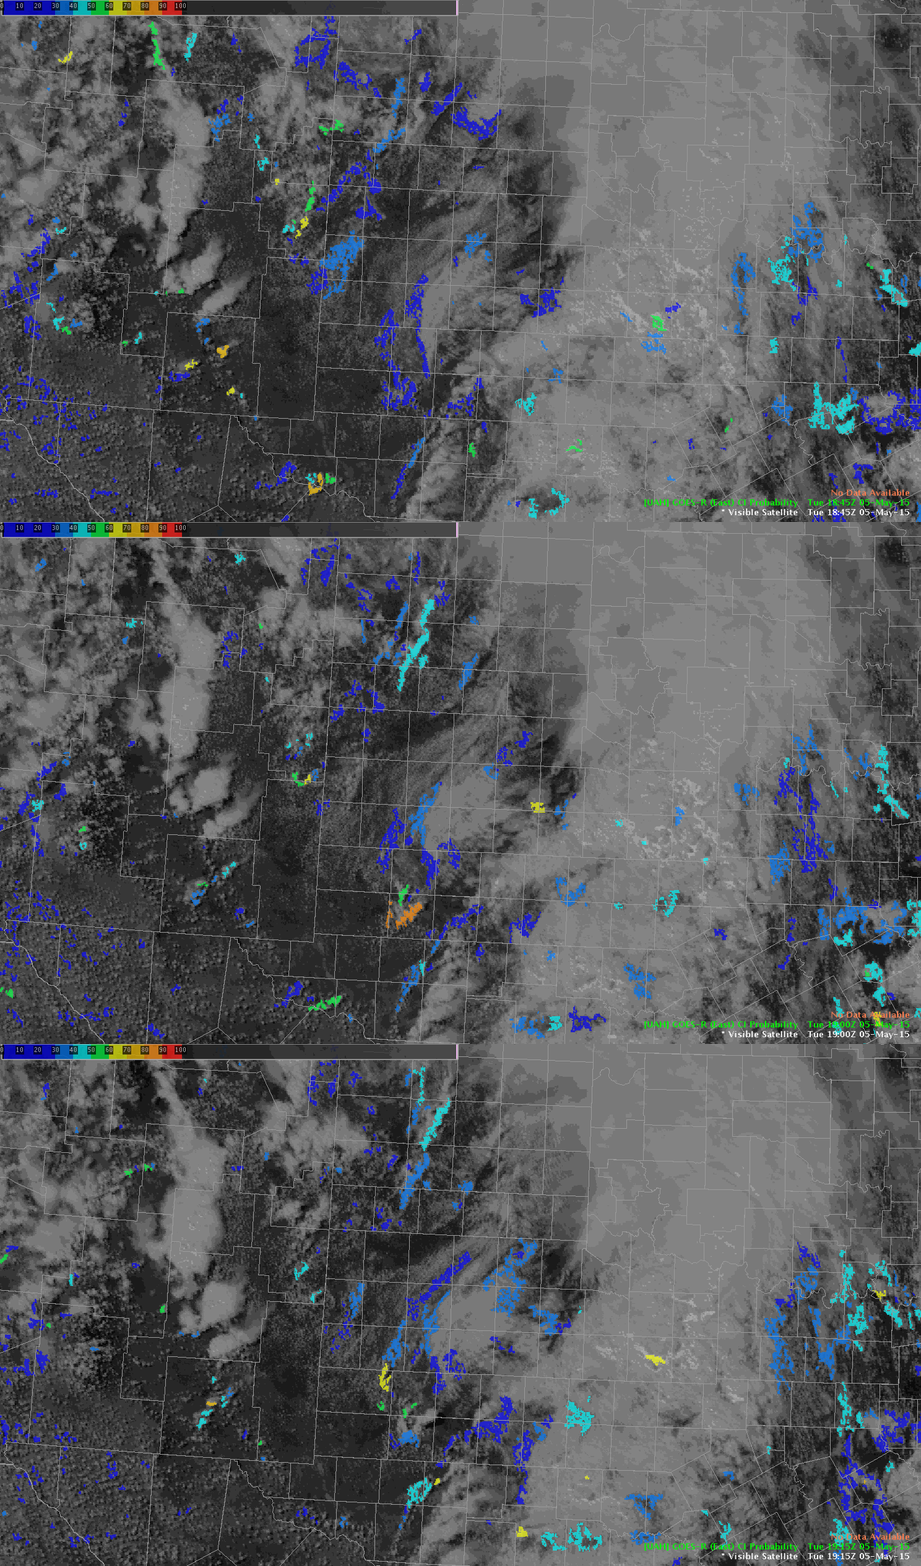
Taking a look back at the visible satellite and convective initiation product, it highlighted the development of convection to the southwest of KBPG very well at 2000Z, with an area of 91% prob of development (and 67% to the south-southwest of that area).

20150505_2000Z_VisSatellite_CI

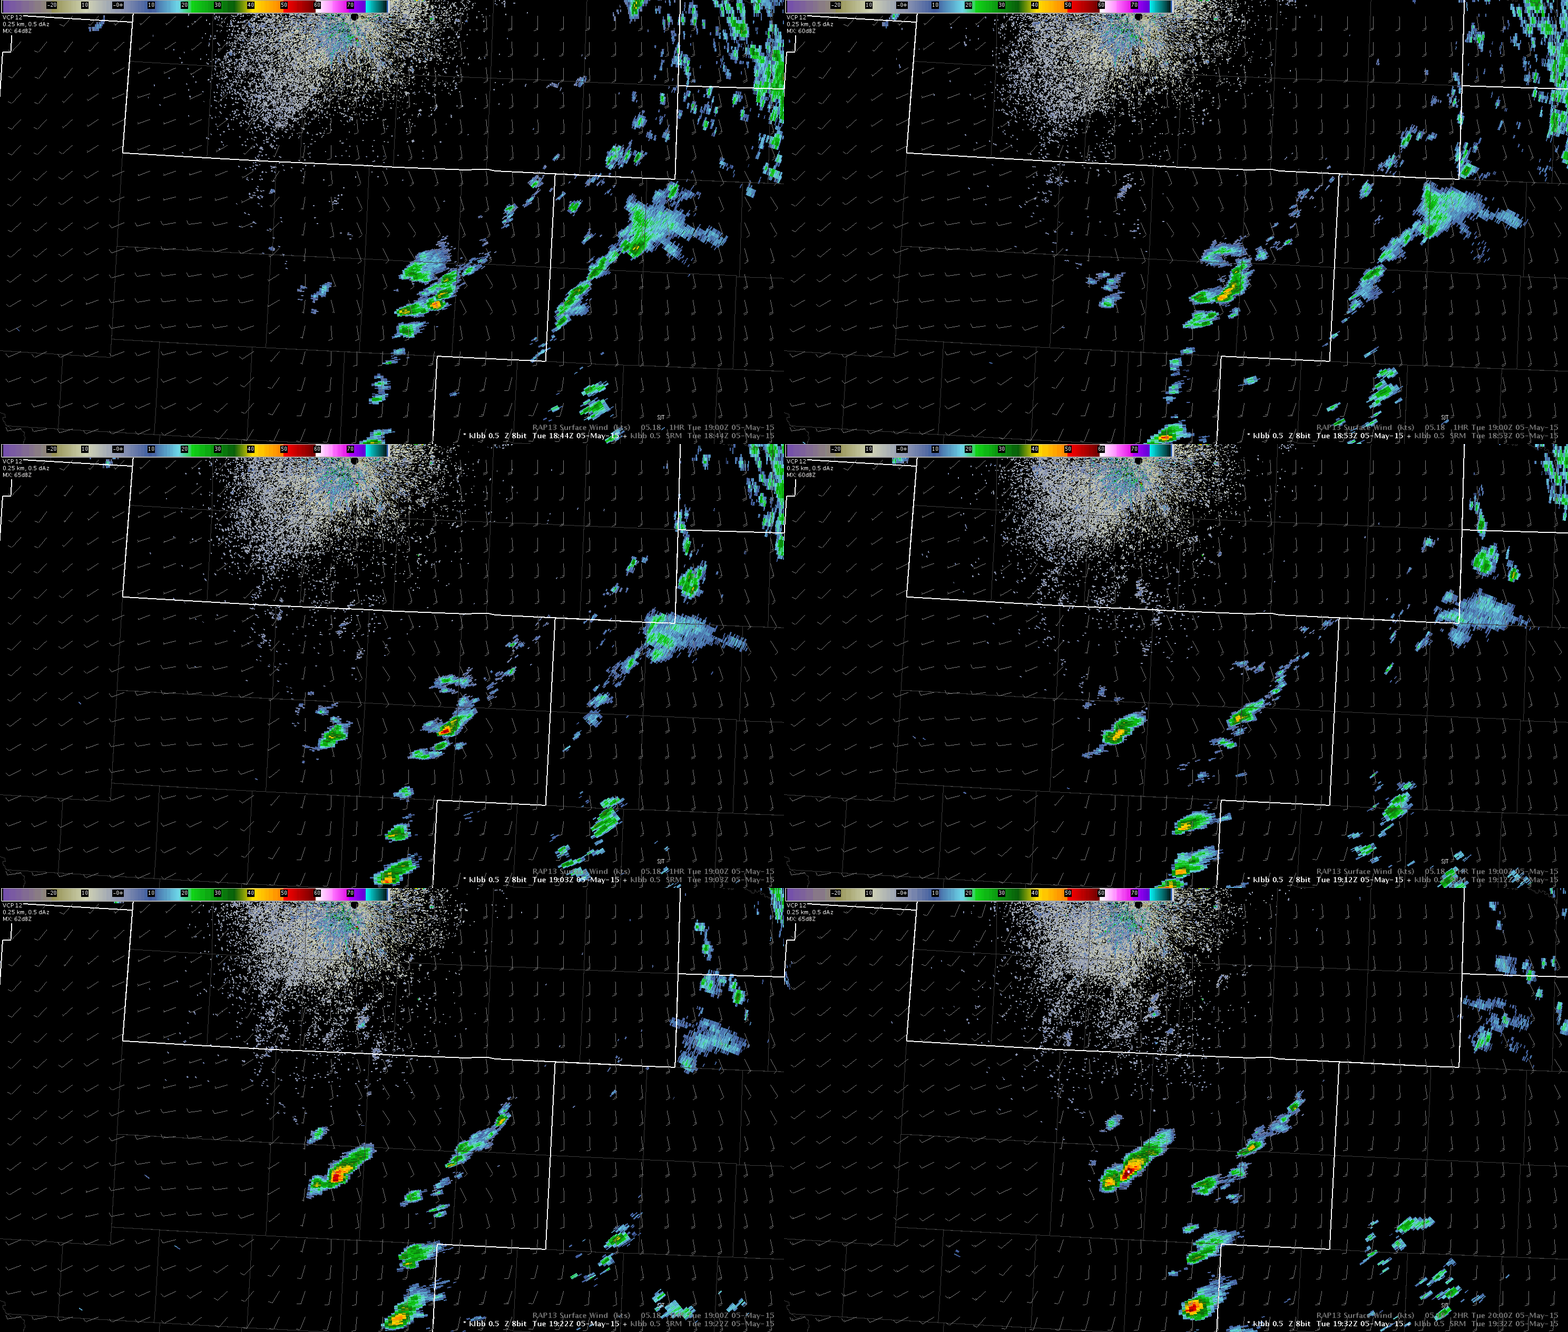
Moving forward 30 minutes, you can see that area developed experienced development in several locations along that line.

20150505_2030Z_VisSatellite_Radar

-SRF

Tags: None

NUCAPS sounding near strong storm south of LBB

I didn’t get a chance to look at the NUCAPS soundings on Day 1 but as soon as the pass occurred today we looked at a sounding that was about 60 miles east of the storm of interest that we have been following in the northern portion of the MAF CWA.  The NUCAPS availability point was located in a brief area of clearing within the cumulus field but we were a little uncertain whether or not clouds interfered or not.

NUCAPS_location
NUCAPS availability plot. The point we used is in the center of the image.

However, the data did look reasonable as the temp was close to surrounding obs, though the dewpoint appeared to be low compared to surrounding observations.  The SBCAPE in the NUCAPS sounding was about 245 J/kg which was significantly lower than the GOES-R LAP CAPE observation which was around 1000 J/kg.

NUCAPS_sndg
Unedited NUCAPS sounding

We modified the sounding to increase the dewpoint to 59 degrees to be better in line and this resulted in SBCAPE of just under 1000 J/kg and lined up well with the GOES-R CAPE.

NUCAPS_edit
Edited NUCAPS sounding to increase the dewpoint.
GOESR_CAPE
GOES-R CAPE image

Jack Bauer

Tags: None

Prob Severe and Lightning…developing storm in Midland CWA

An area of convection (70% probability in GOES CI) continued to develop around 1900 UTC.  Between 1922 and 1928 UTC, the Prob Severe increased from 18% to 63%, and by 1935 was up to 86%.  The lightning jump increased to 2 sigma during this time.  The 1 minutes lightning density increased over a 2 minute time span from 1 to about 4 flashes/gridbox.   By 1945, the lightning density was up to 9 flashes/gridbox.  All of this evidence points to convection which is increasing in intensity.LightningMLD

Evidence from the NUCAPS sounding as well as the GOES LAP CAPE suggest the storm is in an environment with around 1000 J/kg of CAPE.  By 20:06, the storm is a well-organized supercell with a hook echo and well defined rotational velocity.

MLDreflecMLDvelocityThe combination of lightning data, Severe Prob, NUCAPS and GOES LAPE CAPE were good indicators of strengthening storm worth watching.  The storm produces a tornado.

Tags: None

Trying out Lightning Cell Tracking and Time Series

Since I didn’t have time to test out the Lightning Cell Tracking and Time Series data yesterday, it was nice to have an opportunity to use it today. Overall, I think the lightning time series data can be really useful, especially the multiple color version.

050515_2008Z_LightningTS

One thing that was pointed out to me by one of the trainers was to keep an eye on the cell area (blue dashed line above), as significant drops/rises can indicate cell splits/mergers.  That was definitely the case with the image in the upper left of the four panel above, as the cell tracking was splitting/merging the lightning areas. That can be seen in the two images below, where the the first image shows the combined lightning cell with 39 flashes (2005Z lightning cell). Then the next minute (2006Z lightning cell), the detection split it into several different cells and lowered the total flash rates.

050515_2003Z_LightningTS-Radar

050515_2006Z_LightningTS-Radar

Knowing that information can help eliminate false interpretations of lightning jumps on the time series. -SRF

Tags: None

NUCAPS compared to 18z AMA sounding

Pass came across with NUCAPS available at 20z. Looked at 19z data from a point close to AMA which launched an 18z sounding. First image is NUCAPS, Second image is the 18z AMA soundings. Differences notices were cooler temperatures above 300mb on the NUCAPS sounding. There was a small but more distinct cap near 800 mb on the AMA sounding. The freezing level and -20 level had dropped on both soundings compared to the 12z AMA sounding.

NUCAPS18zMay5AMA18zMay5Lynford

Tags: None

Conflicting Information

The Probability Severe and ENI Thunderstorm Alerts seem to have differing opinions on a couple cells in the ABQ CWA.

ABQ DTA prob svr

At 1932Z, the cell to the north has a Dangerous Thunderstorm box, yet a prob severe of only 17%. Meanwhile, the southernmost cell has a prob severe of 78% but is only considered a “significant” thunderstorm.

At 1940Z, the prob severe of the south cell went up to 82% with no DTA, and the cell the the north went up to 43%. It’s interesting to note these cells are approaching the east/west boundary of the ENI Thunderstorm Alerts. No alerts showed up for the “east” algorithm either.

ABQ DTA prob svr2

The storms are still pulsing down just as quickly as they develop. They really only look impressive for 1-2 volume scans. No hail or wind reports yet, just the funnel cloud near Roswell earlier.

-V. Darkbloom

Tags: None

Convective Initiation temporal resolution concern

Looking just beyond our LBB CWA to the south I noted a CI change from at 1845 UTC which showed 10% probability of convective initiation to a 70% probability at 1900 UTC.

CI_Loop
Animated loop

However, when looking back at the radar loop starting at 1845 UTC which matches the first satellite image and continuing past 1900 UTC, we can see the development of an isolated convective cell.

Radar_loop
Animated radar loop

At 1900 UTC a 39 dbz core was noted, so in this case the temporal resolution of the CI product (15 minutes) effectively resulted in a miss as the 35+ dbz was already present at the time the 70% probability was given.  This does not diminish the situational awareness value of the product.

Jack Bauer

Tags: None

Scattered Storms in ABQ CWA

Still monitoring storms across the ABQ area, but thus far they have been pulsing up and down with little maintenance. Here is a broad look at the area with ProbSevere overlayed on the radar.

20150505_1926Z_Radar_ProbSevere

The strongest storm is over the far southeastern part of the CWA, with a ProbSevere value around 77%. But looking at radar data, within the hail growth zone, seeing limited indications of severe hail. That is matched by the MRMS MESH output of right around 1″. Have not issued a warning for that storm at this point. -SRF

Tags: None

Initial Setup for LBB

Today we are set up as WFO LBB in north central TX.  Water vapor imagery (upper left in image below) shows large upper low centered over the four corners region with broad cyclonic flow across NM/TX with plenty of dry air moving into the forecast area.  Visible imagery shows some general clearing across the area as thicker clouds moved out of the area from this morning.  Expect convection to develop later this afternoon as atmosphere destabilizes across the region with hail and damaging winds as the main threat. An initial look at the CI product (lower left in image below) is showing mainly low probabilities of initiation across the LBB CWA but there have been some higher probabilities to the west over NM closer to the core of the upper low where lapse rates are steeper and associated with the colder air aloft.

4pnl_WV_VIS_CI_PWLooking at the GOES-R LAP precipitable water data the significant dry air is located in the 700-300mb level (lower left in the below image) which matches up well with RAP analysis soundings.    Not much on the radar this point to look at but will be monitor for developing convection.

4pnl_GOES-R_PWJack Bauer

Tags: None

Setting Up in ABQ

Currently in the process of setting up in ABQ CWA for the afternoon and will provide a little bit of an overview.  Water Vapor imagery is showing a disutrbance shifting east across eastern New Mexico, as seen in the image below.

050515_1745Z_WV

Already seeing convection over the area, both coming off the mountains and associated with the upper disturbance and also over the far eastern part of the cwa along the surface trough stretching south-southeast from the low in southeast Colorado.  While the convection coming off the higher terrain was already mature, the convective initiation product did pick up on the development of newer convection farther to the south and east of KROW.

050515_1745_VisSat_CI

As the storms continue to the east and into the higher instability shown on the GOES Sounder LAP CAPE, would expect the intensity of the storms to increase.

050515_1700_VisSat

Finally, here is a look at the radar from 1842Z showing both of the areas of convection. Before developing this post, was planning on issuing a warning on a cell to the southwest of Mesa, NM, but technical issues with the Text Workstation inhibited the issuance. In the decision process, used the ProbSevere data to add confidence (increasing from 5% to 77% in about 15min) to the higher cores seen on the radar data.

050515_1842Z_Radar_Lightning

SRF


Tags: None