Initial thoughts on convection for AMA

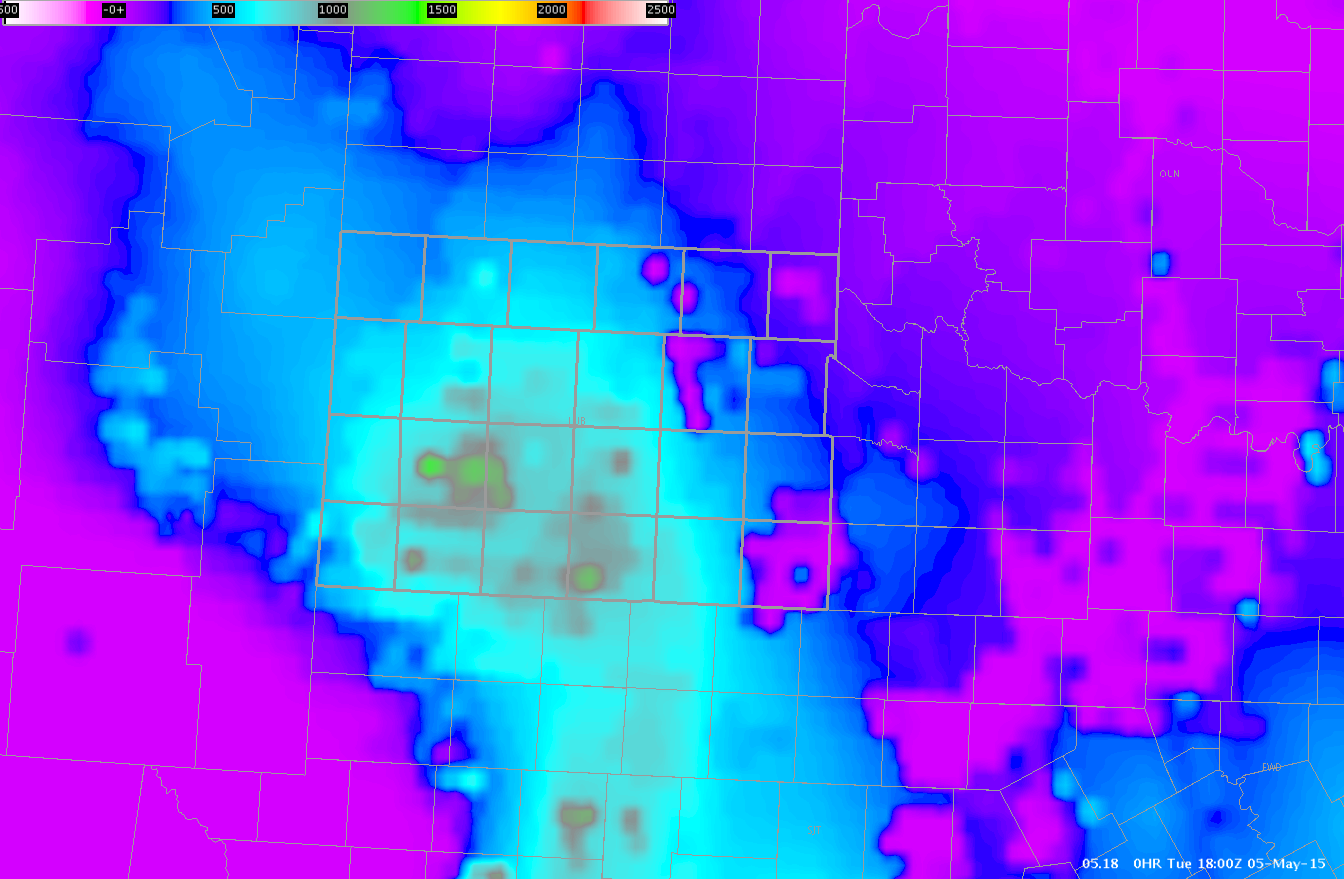
GOES-R/CIMSS CAPE values continue to increase across southeastern portions of the Albuquerque, NM, area towards the southwestern portions of the AMA CWA. Values are not markedly high, on the order of 400-500 J/KG, but skies continue to clear in the wake of convection earlier this morning allowing for greater destabilization later this afternoon.

050515_GOES_CIMMS_Cape_CI_18ZThe UAH GOES-R convective initiation probabilities continue to also increase for southeastern portions of the ABQ CWA and southern portions of the AMA CWA. Reflectivities remain weak moving northeast in the southern AMA CWA, but expect coverage to increase as the storms move into the more favorable environment.

1850Z_radar_ProbSevere_IR_CIMSS_CIBrick Tamland

Tags: None

Starting the day in ABQ

I’ll be starting out the day in ABQ. There is a short wave rotating through the region and convection has already fired off the higher terrain and is moving towards the NE. The GOES-R LAP CAPE and LI are enhanced in this area.

ABQ WV

ABQ GOES CAPE

ABQ topo radar

Interestingly, there has been very few CG lightning strikes with the stronger cells.

ABQ IC LTG

Time to go load up more data.

-V. Darkbloom


Tags: None

Pre Storm Environment

Briefing and water vapor loop showed short wave crossing north central New Mexico. Drying on Water vapor loop lines up with the clearing on the leading edge of the short wave. Better indications of CI in far sw CWA. CAPES have increased to near 1100 J/KG just south of the forecast area. Have DTA  set up and awaiting the next pass for NUCAPS availability. CAPES and LI 18z May 5 CAPES and LI 18z May 5


Lynford

Tags: None

Lubbock CWA Conditions

My warning operations will focus over the Lubbock CWA this afternoon.  Clearing of this morning’s cloud cover began to occur around 1830 UTC.  A cumulus field has quickly developed in the areas which cleared.  I will be watching the GOES CI Probability in this region as instability continues to increase.  GOES LAP CAPE values through the CWA range from 500 to 8000 J/kg, with some spotty areas of up to 1100 J/kg.GOESCAPE

Tags: None

Daily Summary: Week 1, Day 1

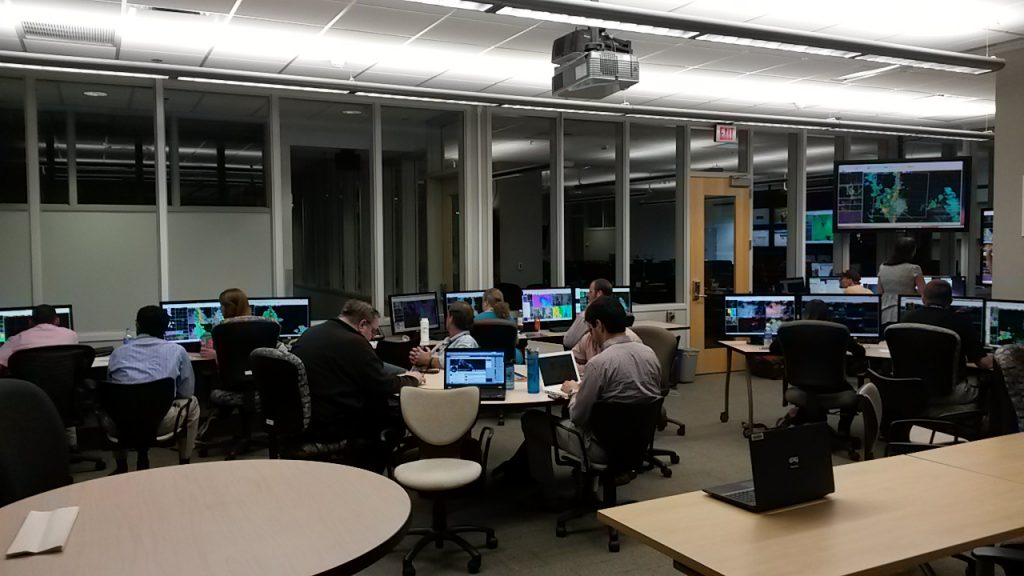
Today marked the first day of the EWP Spring Experiment in the Hazardous Weather Testbed in Norman, OK. This year, 5 NWS forecasters and 1 broadcast meteorologist will evaluate various GOES-R and JPSS algorithms, as well as Earth Networks total lightning products. Participants, working in pairs, will use the experimental products to issue area forecast discussions and severe thunderstorm/tornado warnings for their designated CWA. All of the products being demonstrated are available in AWIPS-II.
20150505_184843

Much of the focus for the first day of the week was hands-on training for each of the products under evaluation. After some initial familiarization with AWIPS-II and procedure building, the various PI’s worked with forecasters on how to interpret the products, and what to look for during the week. Forecasters also became familiar with saving images, and posting to the blog. By the end of the day, participants had already made several informative blog posts.

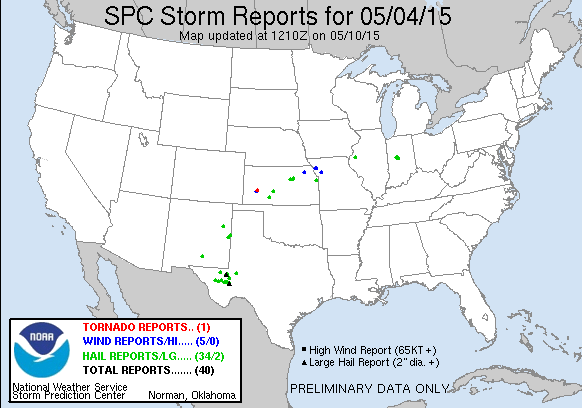
We began today’s operations in the Topeka, Omaha, and Midland CWA’s. As activity subsided in the Omaha CWA, that pair moved operations to the Wichita CWA. Participants were able to utilize all of the products today, including the PGLM total lightning from the West Texas LMA.

Tomorrow, we will start activities at 12:00 pm in the Dev Lab for the daily debrief before moving to the HWT for the 12:45 EFP briefing. Operations will likely take place in West Texas.
150504_rpts

– Bill Line, SPC/HWT Satellite Liaison and Week 1 EWP Coordinator

Tags: None

Convective Initiation in Southwest Kansas

Looking at the Convective initiation product over southwest Kansas in an area where the earlier cirrus had cleared out showed some enhanced probabilities in the 60-70% range at 2000 UTC over Hodegman county, KS.

SW_KS_CI_2000utc

At that time there was not any radar returns showing up in that part of the county where the CI was identified.  When looking at the radar imagery at 2045 UTC there was new convection that had developed across northeastern Hodgeman county.  I think this is a great example of the benefit of the CI product and how it does especially well in environments where only cumulus cloud development is occurring.

SW_KS_CI_2045utc

I think this can be a very useful product in the WFO, especially in offices where pulse convection can be a problem, such as the eastern United States.

Jack Bauer

Tags: None

Another CI Case

Just another brief example of using the GOES-R Convective Initiation Algorithm.

CZ (left) and GOES Vis and CI (right)
CZ (left) and GOES Vis and CI (right) at 1830Z. The orange areas show 81% probability of CI.
Click to animate.
Click to animate.

Convection did indeed initiate soon after, becoming severe by 20Z. There were several reports of golf ball sized hail associated with this storm between 20Z and 22Z.

LSR2

As of  2312Z this cell is still going strong. A pair of weak cells has popped up just to the south and the CI algorithm is showing two more 80% areas with these cells.

MAF CI 2

We’re about to start wrapping up for the day, but it’ll be interesting to see how these cells evolve over the next 30 minutes or so.

-V. Darkbloom

Tags: None

Earth Networks Lightning Time Series for 3rd SVR in Topeka

The time series lightning plot for the 3rd SVR in Topekas area is below. Note the peak close to 125 flashes/min around 2245Z which coincided with another hail core development aloft, 60 dBZ to around 22k ft/-25 C. This area is also tricky because it at the western tail end of a line of thunderstorms, so the centroid designation may be off since it is close to several other centroids, thus skewing the point values.

ETN_pointAnalysis_OttawaKS

Brick Tamland

Tags: None

Lightning Jump and Cell Intensification

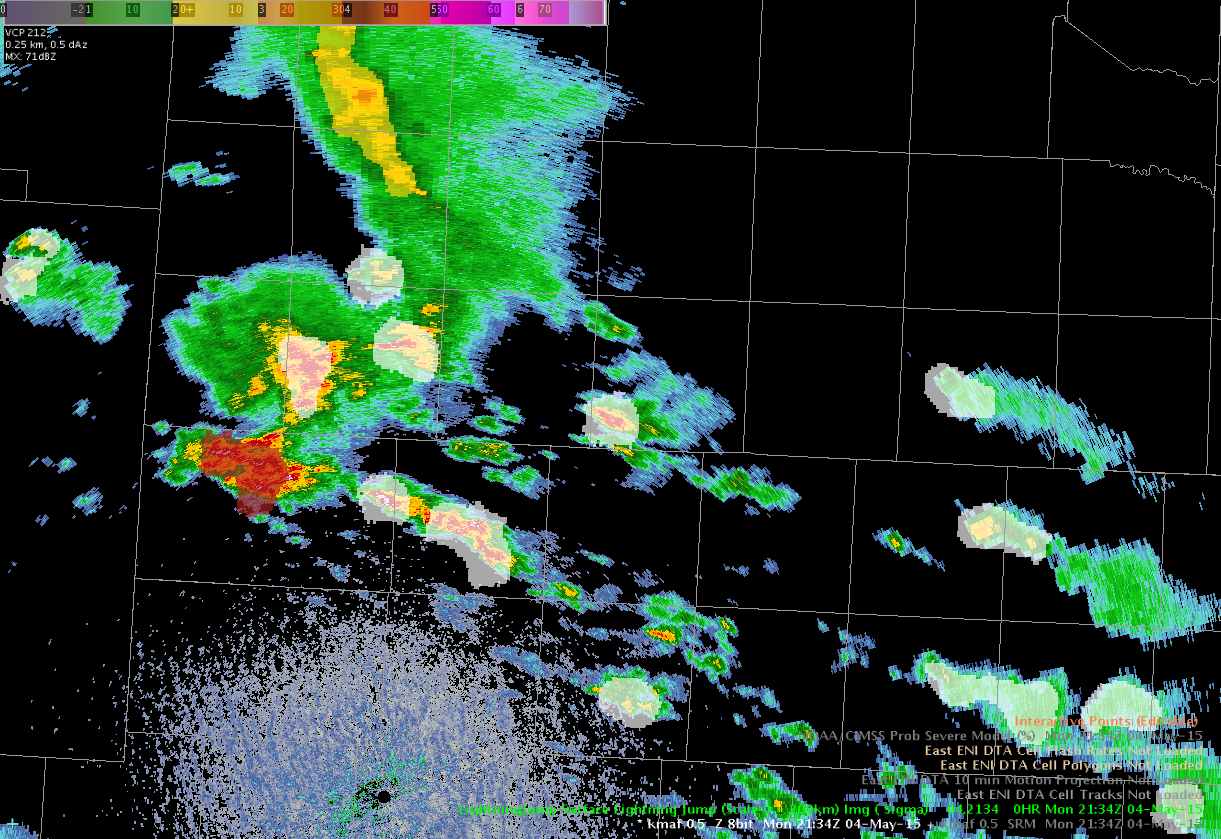
Another significant lightning jump occurred in west Texas (Midland CWA) around 2134Z (434 PM CDT). The jump was 4 sigma – shaded red below.

MAF 4 sigma jump

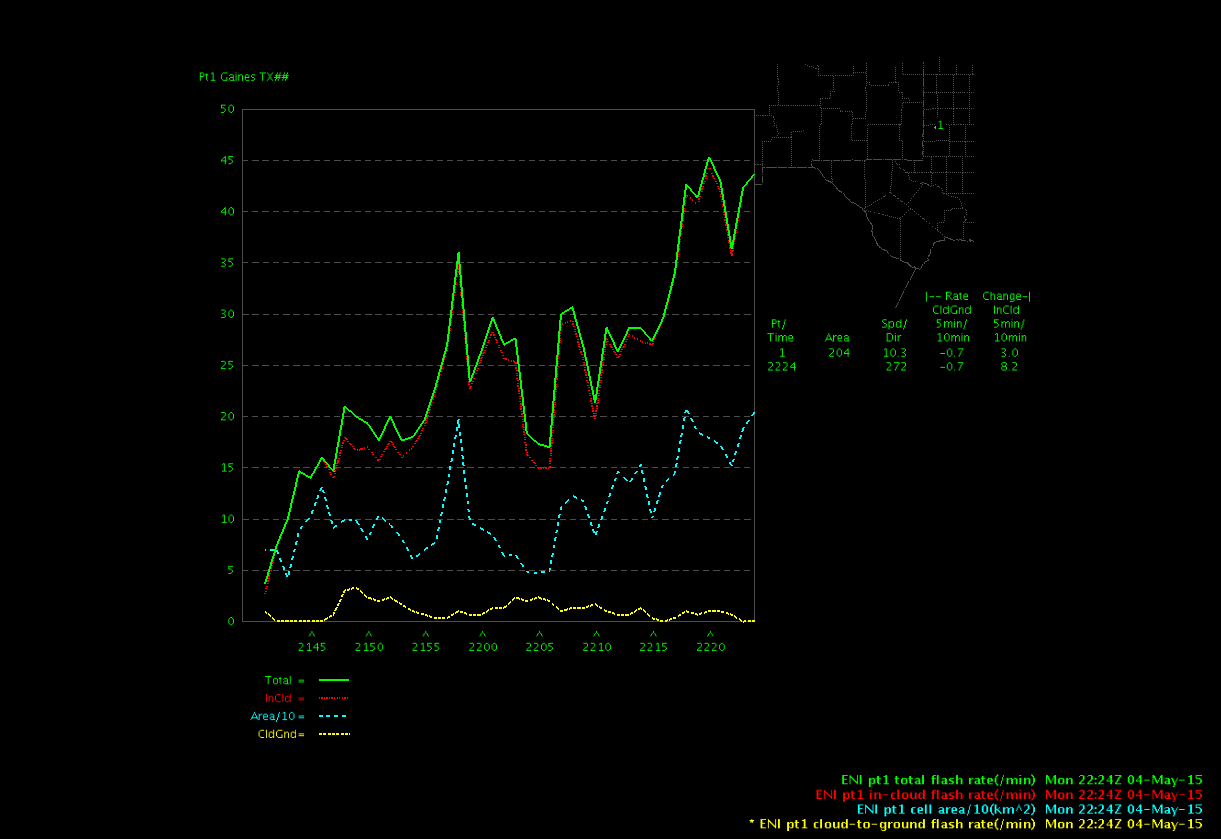
A time series reveals this was the first in a series of jumps.

MAF 4 simga time series

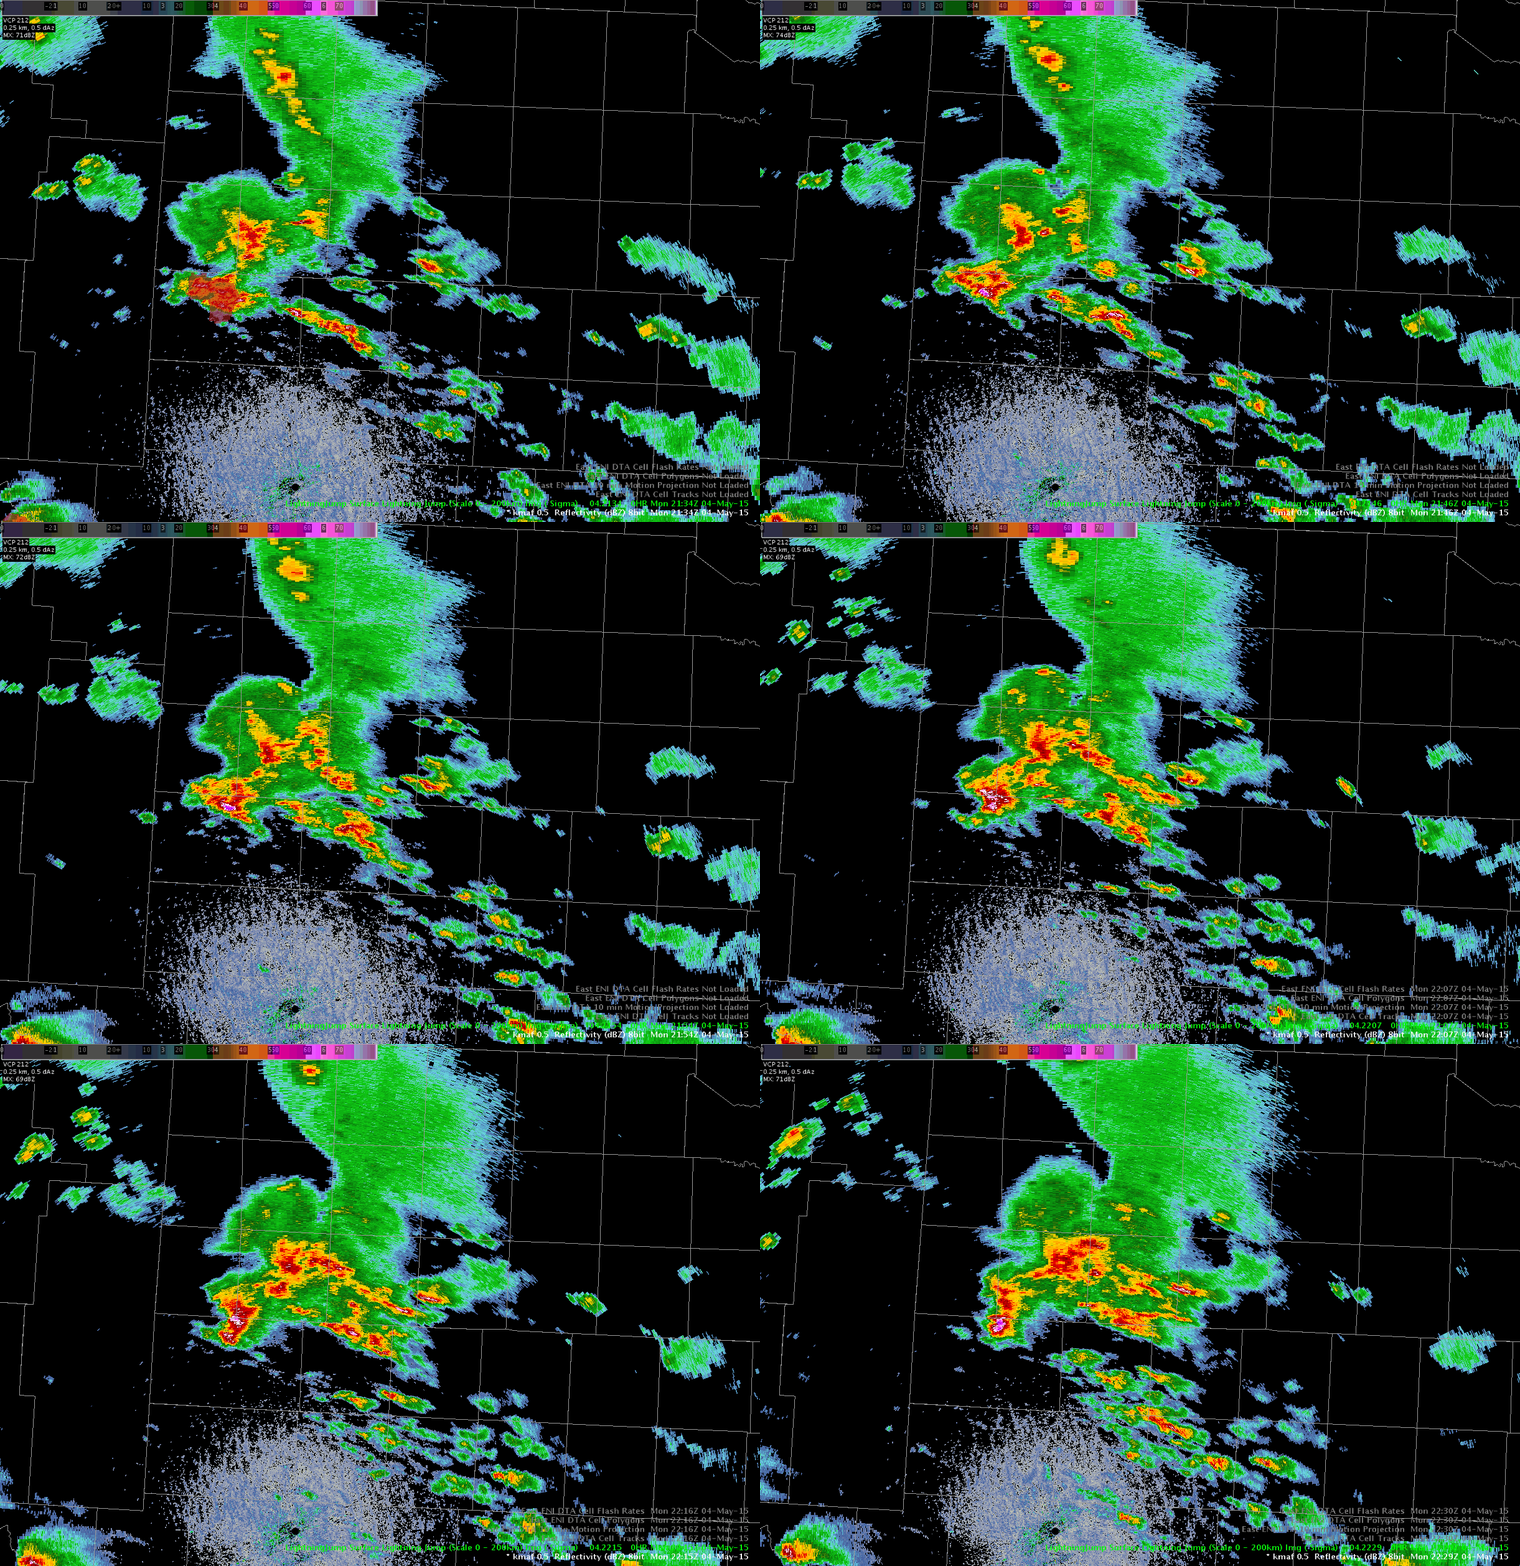
The second jump around 22Z was 2 sigma. A loop of the 0.5 deg reflectivity shows the cell intensifying after the lightning jumps occurred. The max Z at the 0.5 deg tilt increaed from around 63 dBZ to around 71 dBZ in 8 minutes, or two volume scans.

radar_loop

(click image to animate)

In this case, the lightning jump is a good indicator of imminent storm intensification.

-V Darkbloom

Tags: None