CI snow contamination

Since there is snow on the highest elevations of the Rockies, it’s interesting to see how CI handles that. I occasionally was seeing pink showing up and found that, indeed, CI tries to figure out snow contamination. It catches small parts of the snowcover, but doesn’t stay on them for particularly long periods (at least as of 1845z). I suspect the spatial resolution of the CI model plays a role in that.

Click for animation.

snowcontamination

Jason Williams

Tags: None

Jacksonville Mesoscale Discussion

The CIMSS products coming in are a little old (16Z), but looking at the CAPE, LI, PWAT and SI, it’s pretty evident that the most favorable area for convection in the Jacksonville FA is the northern part. The CIMSS CAPE in this area is around 2000 J/kg, the PWAT is higher here than anywhere else in the FA (1.75”), and LIs are up to -6. I compared the SPC mesoscale analysis CAPE and PWAT (18Z) to the CIMSS data (16Z) and both showed the most favorable values in the northern part of the FA. The 0-6 km bulk wind shear appears relatively weak, so believe convection will be disorganized. The GFS model data shows a mid-level cold pool focused over the northern part of the FA, so this will likely be a focus for convective development. Believe that locally damaging winds and hail will be the main threats today. NAM forecast soundings show some dry air aloft which may enhance the potential for strong wind.

CIMSS3

-Helen Hunt

Tags: None

Meso Discussion of CYS

Moisture gradient exists across the CWA.  The image below shoes the GOES derived PW across the area.  The green area is 0.70 inches or higher.  These PWs are in the 90th percentile for DVR.  Moisture across the area is much higher than typical.Screenshot-CAVE:CYS - D2DPW

Satellite derived CAPE, shows a gradient across central portions of the CWA.  This CAPE looks to be relatively accurate with the overall gradient.

Screenshot-CAVE:CYS - D2D -1

Looking at the RAP, 0-6km shear is around 50kts, this is conducive to supercell development across the area.  An upstream wave is moving into the area, this wave is still across Utah and probably will not make it to the area to force the storms to go linear.   Main threat will be large hail and damaging winds. Low level shear should increase later in the period when the LLJ kicks in.  So our threats for tornadoes will increase around 00z.

MacGyver and John Pendergrast

Tags: None

KFTG mesoscale discussion

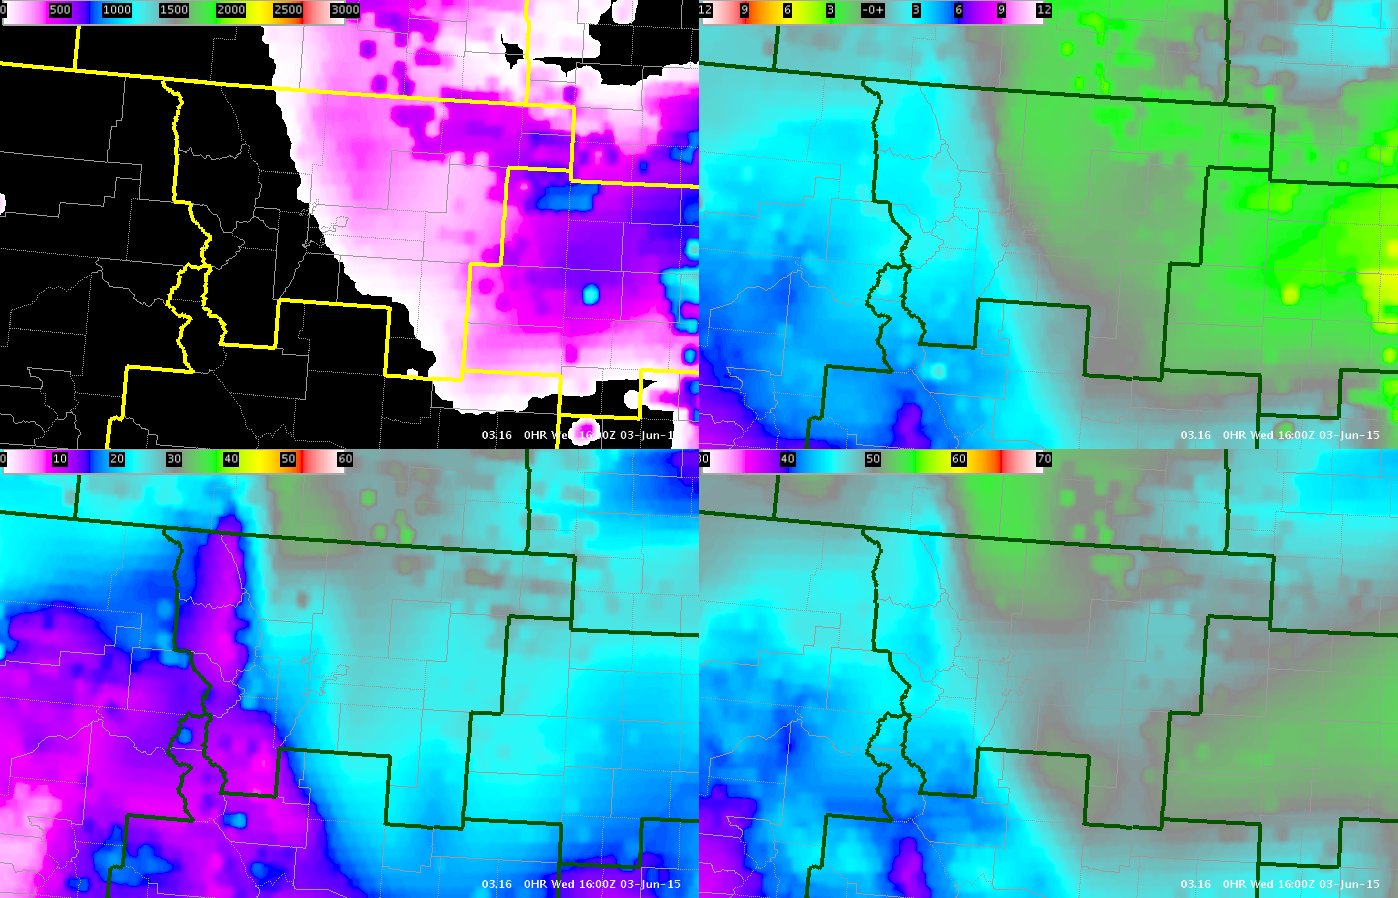
Large shortwave trough remains in the western CONUS, putting KFTG CWA in southwest flow. Surface low in western Colorado is bringing upslope flow.

16z GOES LAP stability indices indicate CAPE is increasing in far NE CO where the cloud deck has eroded over the past couple of hours. Clearing has been slow, however, per the super rapid scan visible imagery.laps

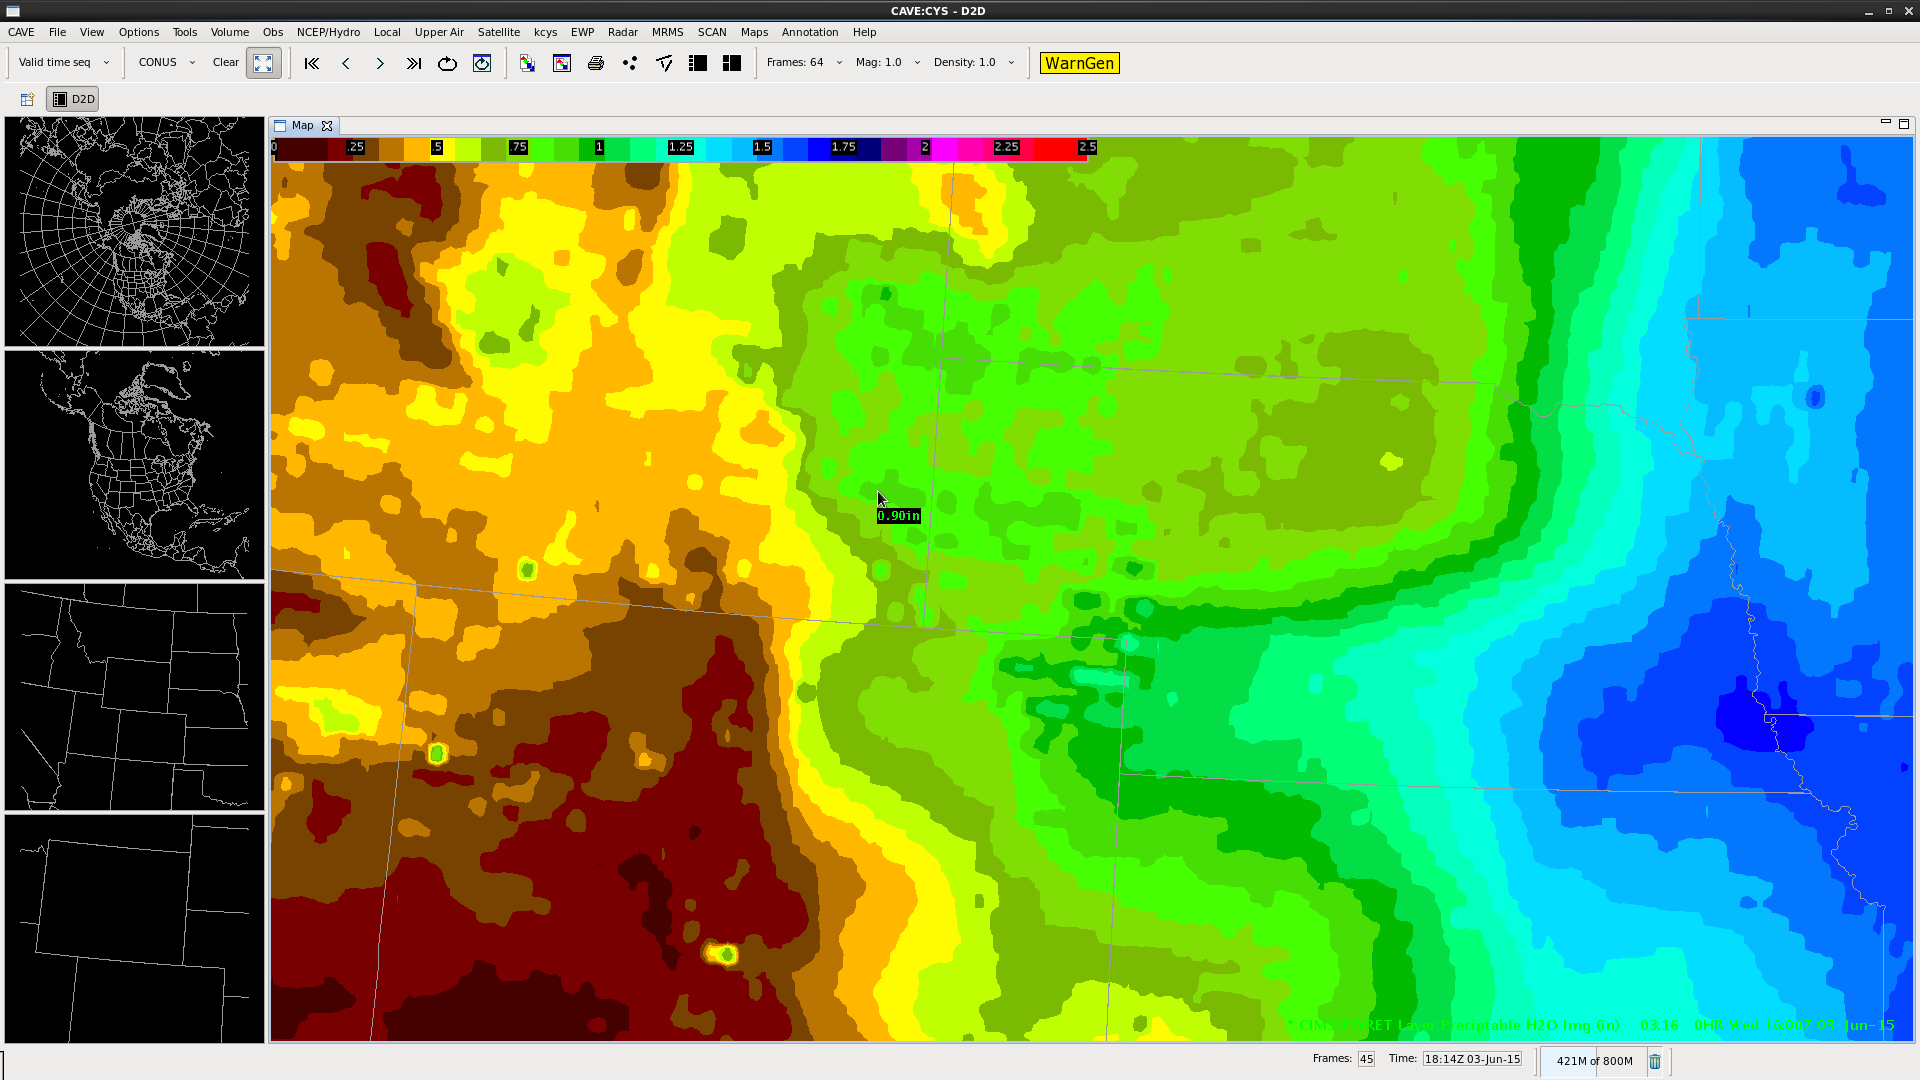
Dew points are in the mid-50s across the Front Range as of 18z, approaching 60F to the east.

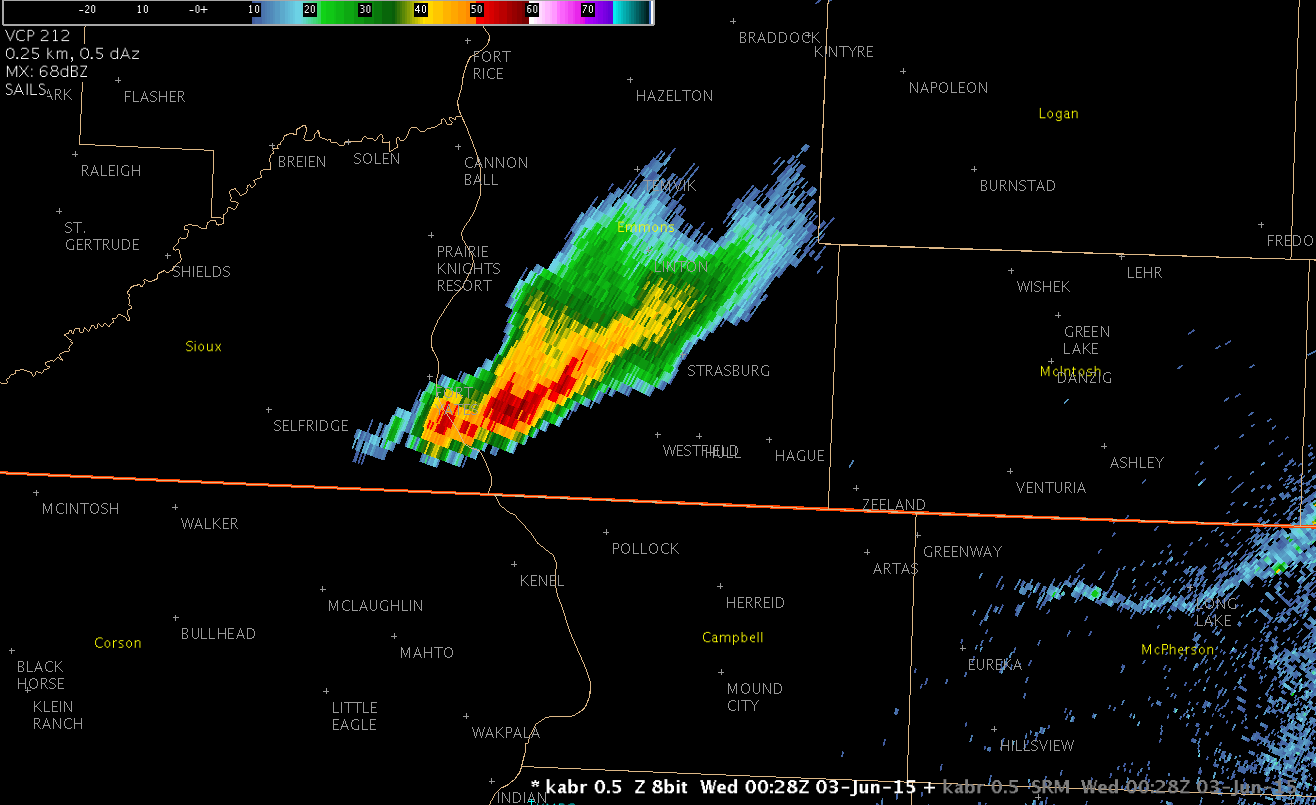
KDNR sounding indicates a large cap at about 700mb, but 700-500mb lapse rate is 7.9C/km. EML is at about 700-550mb. 0-6km shear is favorable for rotation/supercells (~40-50 kt) for storms once they actually do fire.

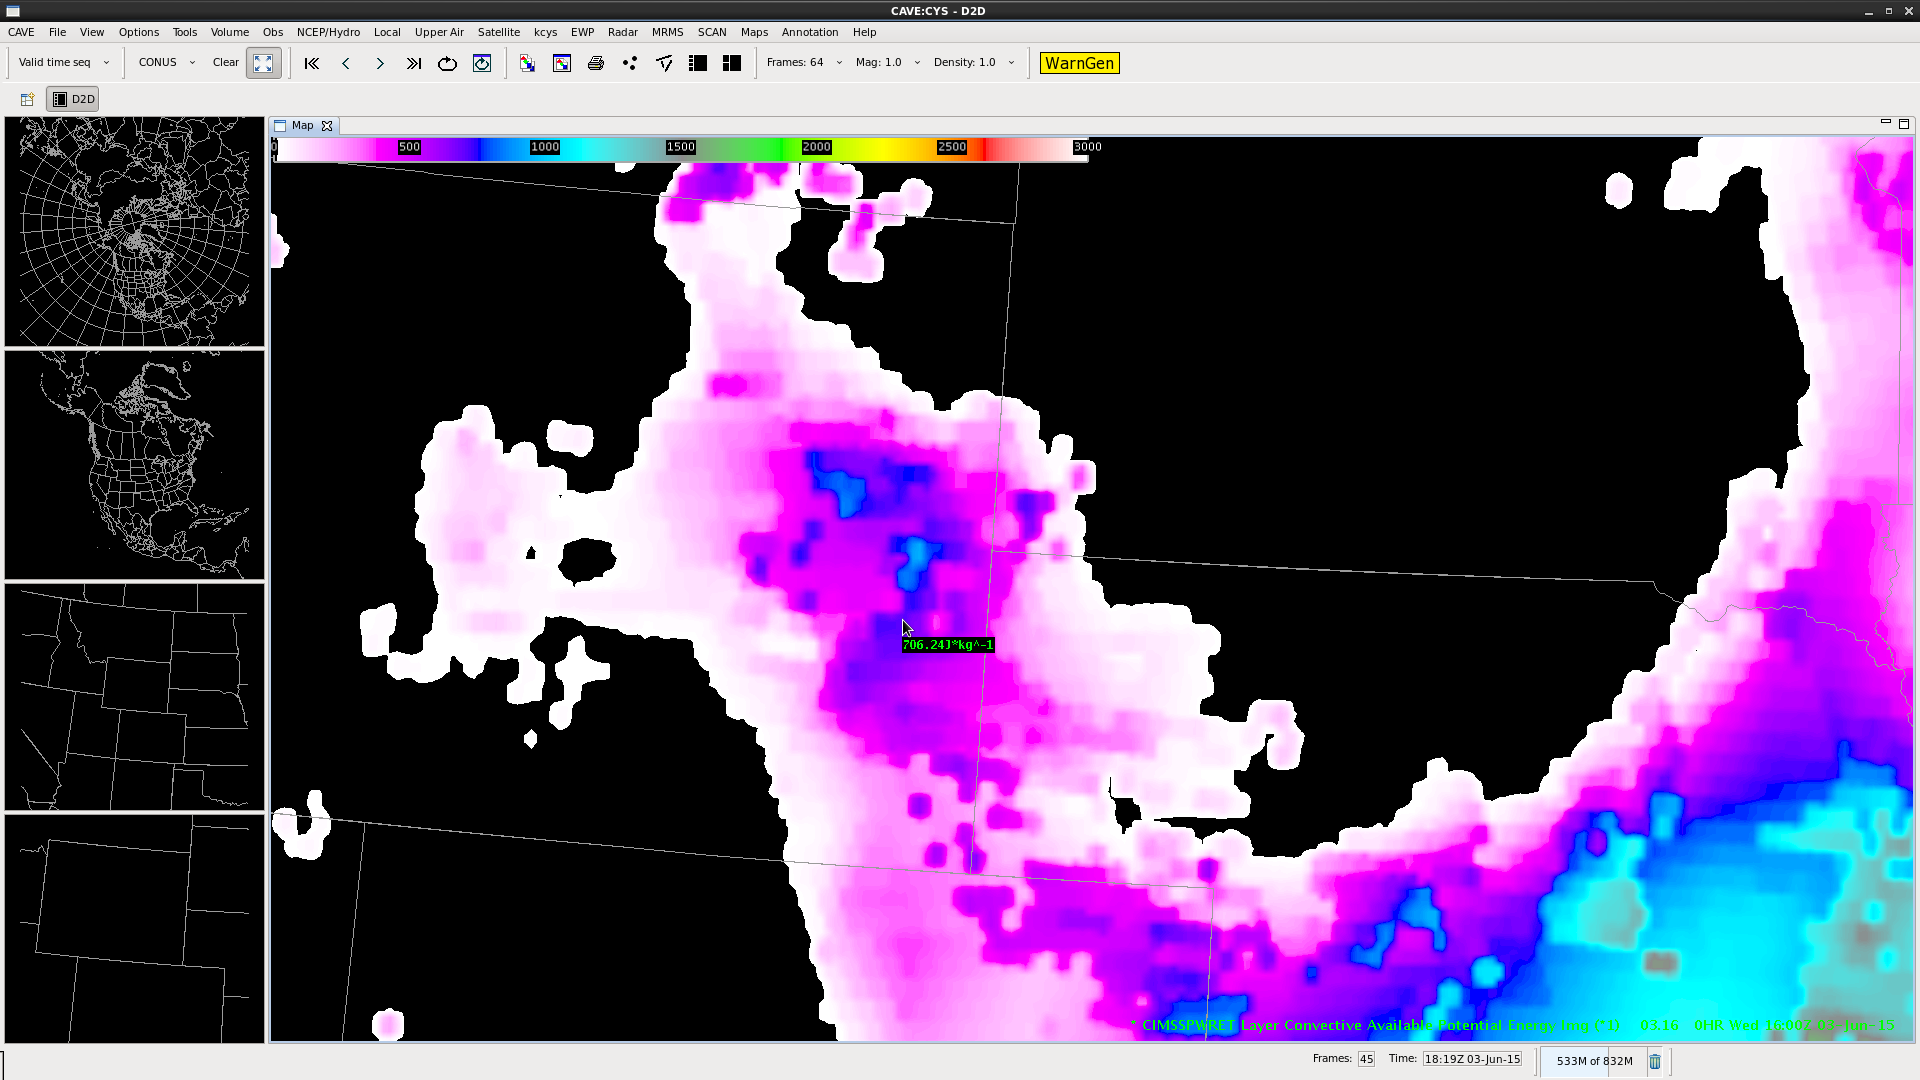
MUCAPE 2000-3000 J/kg, but CIN is still at about 500-750.

Small puffs of cu developing in the mountains, but they have not grown notably over the past hour.

SWODY1 has the FTG CWA in an ENH risk.

Cattywampus & Jason Williams

Tags: None

Daily Summary: Week 4, Day 2

Today’s activities took us just a little further east into the Bismarck, Billings, and Cheyenne CWA’s. The Cheyenne group would later move to the Aberdeen CWA as activity shifted out of the CWA. Participants were able to analyze the LAP products and later the NUCAPS soundings to get an idea of where severe convection was most likely. The CI product was also monitored for initial development during this period. As convection grew and matured, participants utilized the ProbSevere Model and Lightning Jump to identify significant changes in the storm that would warrant the issuance of a warning. The ENI total lightning products were utilized throughout the life cycle to monitor the evolution of the mature cells. The 1-min satellite imagery was helpful when monitoring for initial convective development, and seeing that development as it occurred, along with failed convective attempts. Additionally, the 1-min imagery along with 10-min winds generated from the imagery aided a forecaster in his assessment of the near-storm environment.


– Bill Line, SPC/HWT Satellite Liaison and Week 4 EWP Coordinator

Tags: None

Thunderstorm weakening as it moves toward Campbell Cty (ABR)

While monitoring a strong thunderstorm moving SE out of Sioux county near Fort Yates earlier this evening, we noted that the cell was beginning to take on bow echo characteristics (0050 UTC).  However, only two volume scans later, the cell began to reform out ahead of its parent cell (0054 UTC).  This broke down the bow echo, and by 0104 UTC, the cell was weakening as it approached the Campbell county line north of Pollock (Figure 1).

Here is the loop of the 0.5 degree KABR radar:

RadarLoop_KABR_3Jun15_0104Z

Fig. 1: Animation of KABR 0.5 degree reflectivity (click to animate)

Another excellent advantage of seeing the 1-minute GOES-14 satellite data is seeing interesting features.  We also noted that, at about the same time that the cell was redeveloping ahead of the parent cell, the clouds also redeveloped out ahead of the original line (Figure 2).

GOES14_1-min_Satellite_loop_3Jun15

Figure 2: Animation of GOES-14 visible satellite (click to animate)

CoonieCatEye

Tags: None

ProbSevere jump

probsevere0056z

The ProbSevere algorithm jumped from 36% to 88% between 0052z and 0056z. At 0102z, a large TBSS appeared, so there was certainly lead time on that feature showing up.

lightning

Lightning has also increased enough to flag a Significant Thunderstorm Alert. While it didn’t initially look like storm was going produce much, it ended up intensifying – the ProbSevere definitely gave a few extra minutes of lead time.

Jason Williams

Tags: None