
A severe thunderstorm pushed through the northern portion of the CWA and I had a tornado warning in effect in anticipation of tornadoes along the eastern most portion of the bowing line. Unfortunately, the NMDA was not initially identifying mesocyclones along that portion of that line. It was only until well after the warning was issued that the NMDA identified anything along that portion of the line. Sandor Clegane
Author: Michael
CPTI Trend with Storm in WFO FWD – 24 April
Watched the trend in CPTI on the storm in the far southern section of WFO FWD. This was associated with a cell that straddled the FWD and HGX CWA. Velocity data showed broad cyclonic rotation that tightened up periodically – including decent GTG.
In terms of CPTI – the probability of the lowest range (80 mph) ranged from 40 to 50% between 2015Z and 2230Z. As wind speed thresholds increased, the values at 95 and 110mph did not differ much from 80 mph – generally around 40 to 45%. The highest values of CPTI also remained higher than I might have thought in this case with even the 170mph+ as high as 25%. This seemed a bit high to me (did not like like an EF4 event) – but maybe statistically this is true???
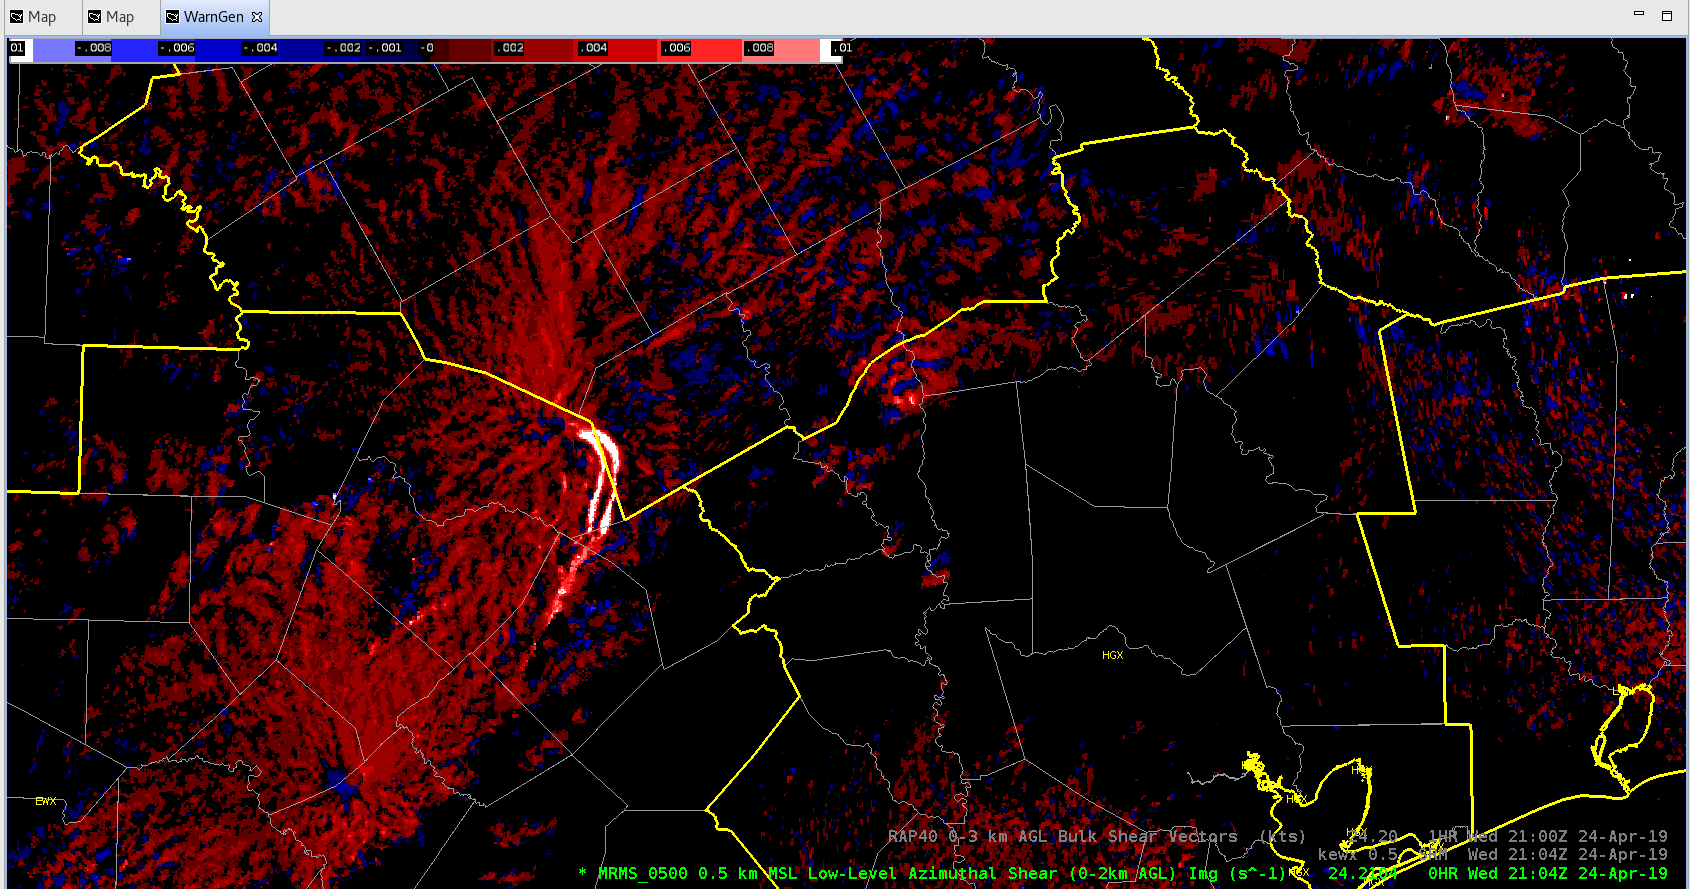
The merged 0-2km AzShear highlighted this area nicely. Note, I adjusted the default color table – to cooler colors – e.g. bright white is > 0.015 s-1. I wouldve loved to view the single radar AzShear product as well!
See AzShear plot at the trends in CPTI below.
HGX Mesoanalysis
Storms are approaching the HGX CWA. GOES-16 imagery shows amply cumulus development across much of the CWA. With temps in the upper 70s and dew points in the upper 60, I expect there to be ample instability in this environment. All Sky LAPS retrievals indicate ML CAPE just shy of 1000 J/kg, but with this environment, I would expect instability to be higher.
 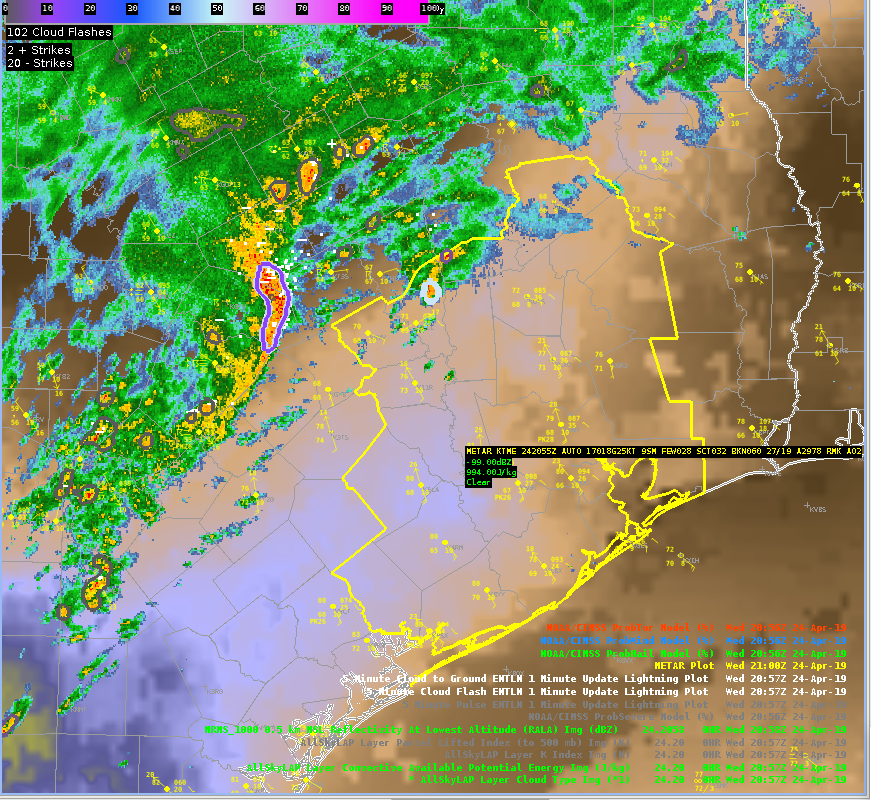 The modified NUCAPS shows a profile more in line with what I would expect to see. In this profile, the surface dew points were close to what surface obs show, but the surface temp did need to be adjusted up a bit. This sounding, coupled with analyzed deep layer shear, leads me to think severe weather is a possibility in this area.
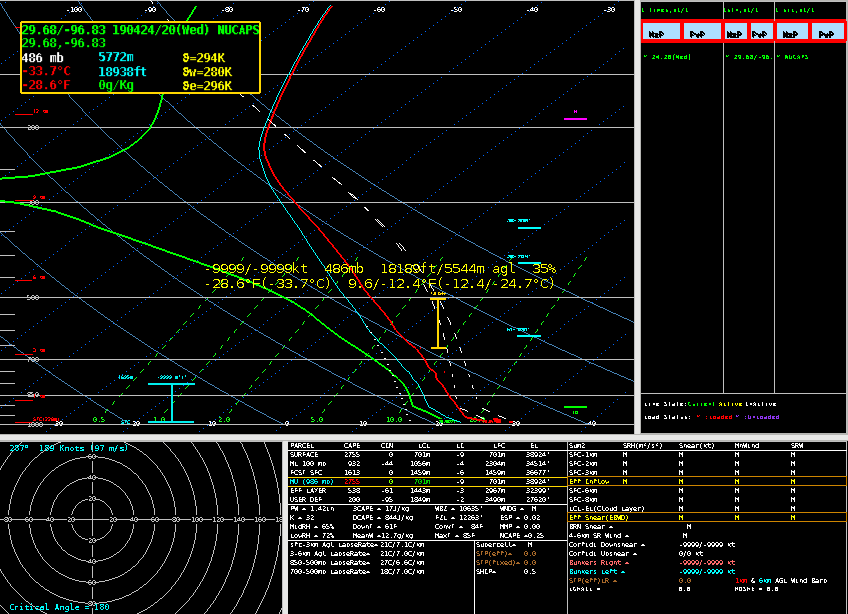 Sandor Clegane
GLM Assist In DSS
The below image shows GOES-16 day cloud convection (DCC) beneath GLM Minimum Flash Area (MFA). Point F is a DSS event. DCC shows clouds glaciating a county upstream of our DSS event, with the storm becoming electrified shortly after glaciation per MFA. This prompted a call to the emergency manager providing support for the DSS event letting them know that lightning was imminent.
ENI total lightning also shows lightning (white points), but the point data fails to show the extent of the lightning, which may lead decision makers to think that they have more time to react to the approaching lightning than they actually do. Sandor Clegane
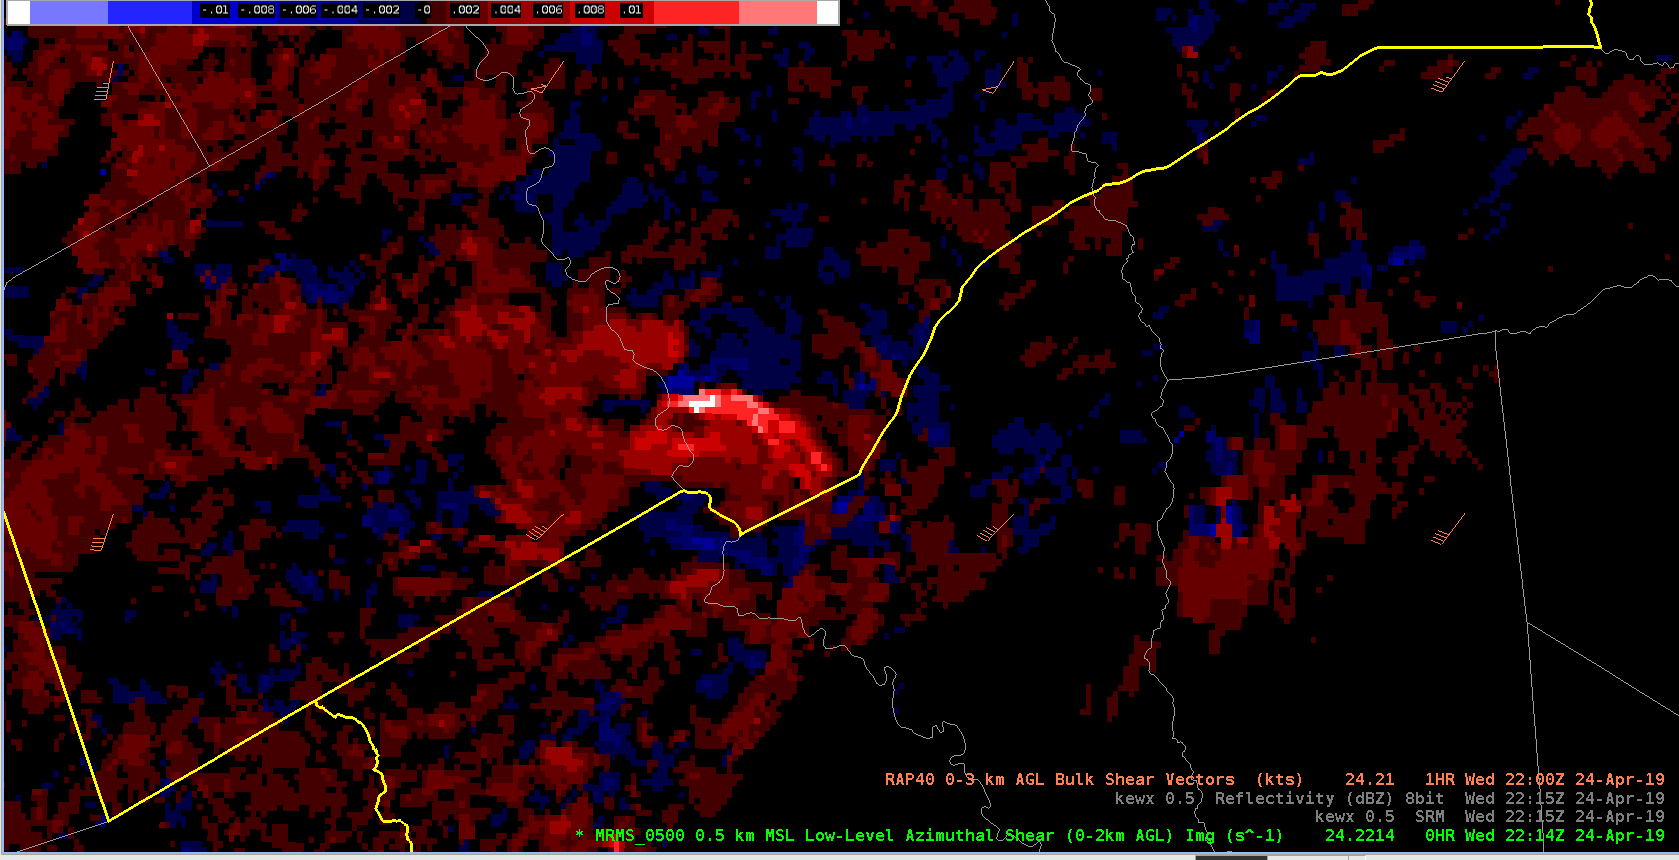
Spike in Merged AzShear Product – Wed Apr 24
Noted a big jump in the merged 0-2km AZshear product – see below. This caused a corresponding jump in ProbTor. Also note the “double peak” likely caused by SAILS scans. This is an a favorable location with > 30kts of 0-3km shear – so mesovortex formation is possible. Will be interesting to see if anything develops….
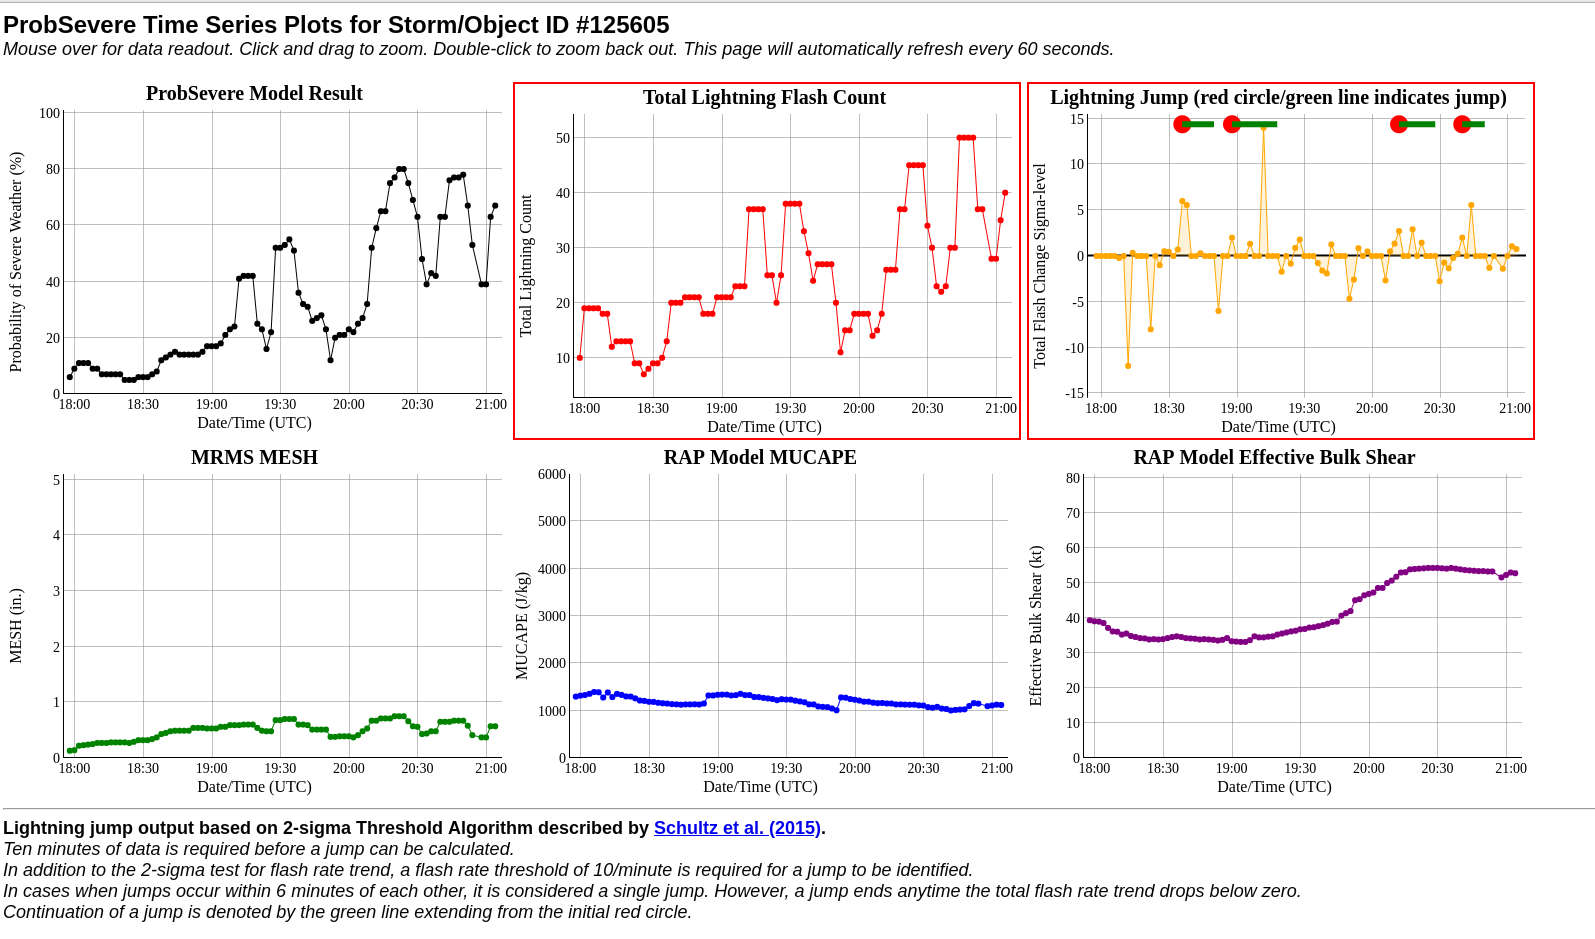
ProbSevere Trend Tracker
ProbSevere has been very useful over the years. One desirable feature would be to have a “trend tracker” see the example from WFO MPX. It sounds like work is being done on this endeavor?
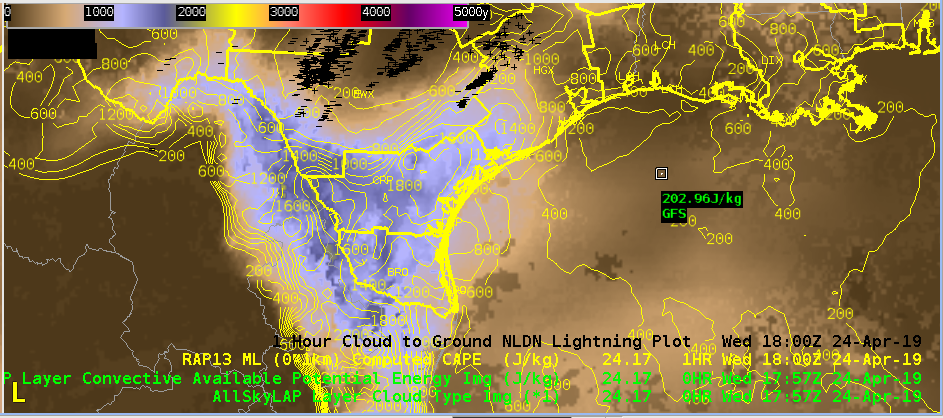
AllSkyLAP – CAPE vs RAP
Takeaway – CAPE on the AllSkyLAP shows a good comparison to RAP CAPE – perhaps even better near the mountainous areas of old Mexico. Think forecasters will consider using this.
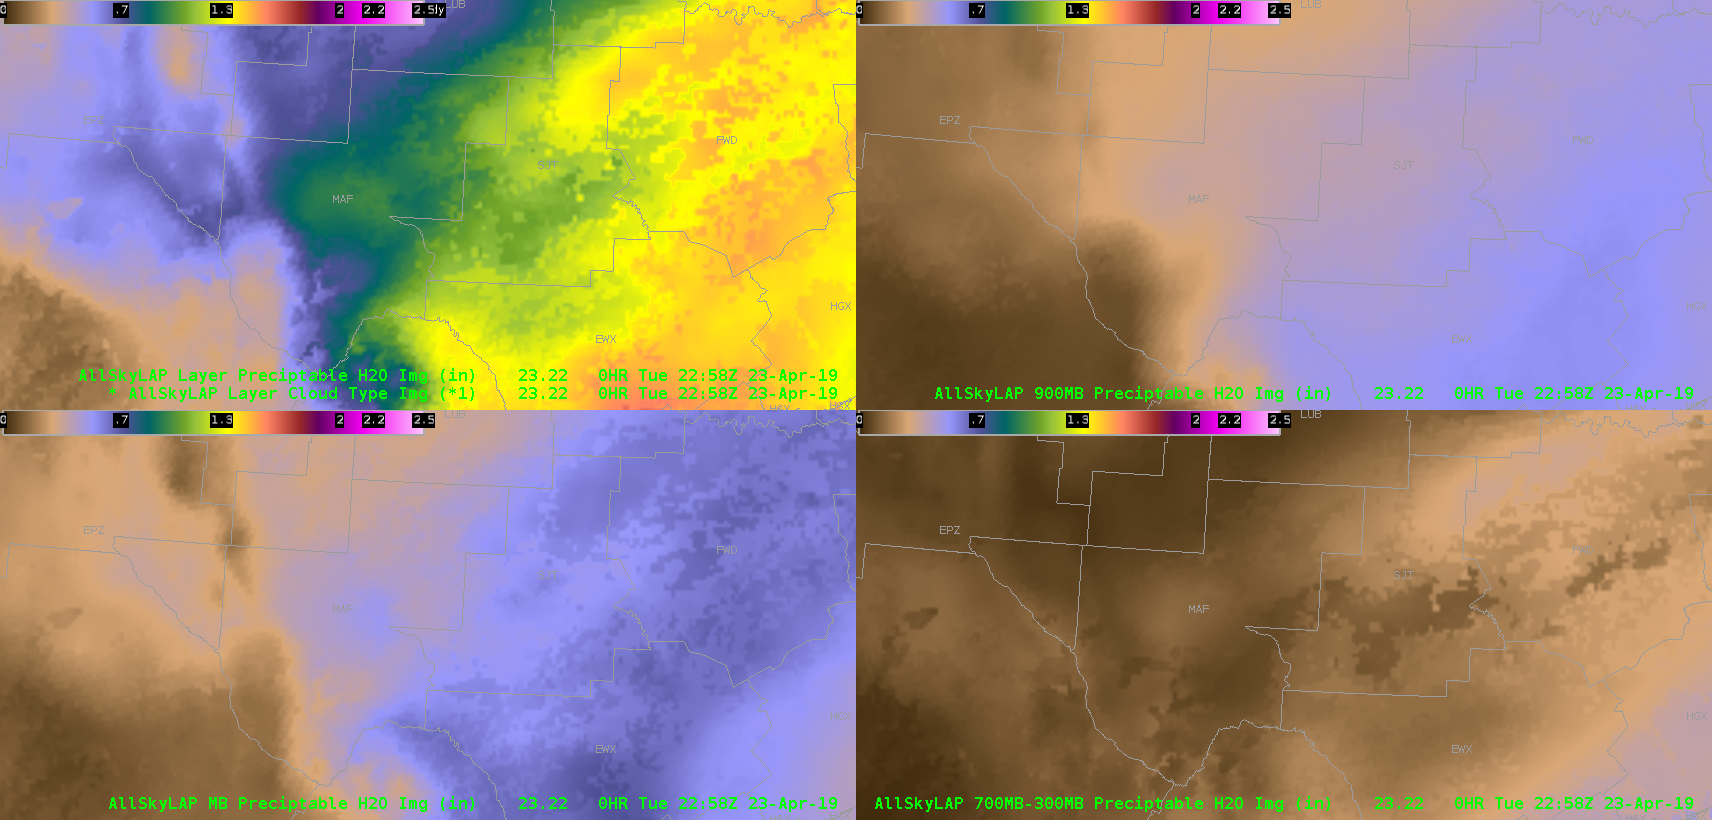
Revisiting the AllSky Products
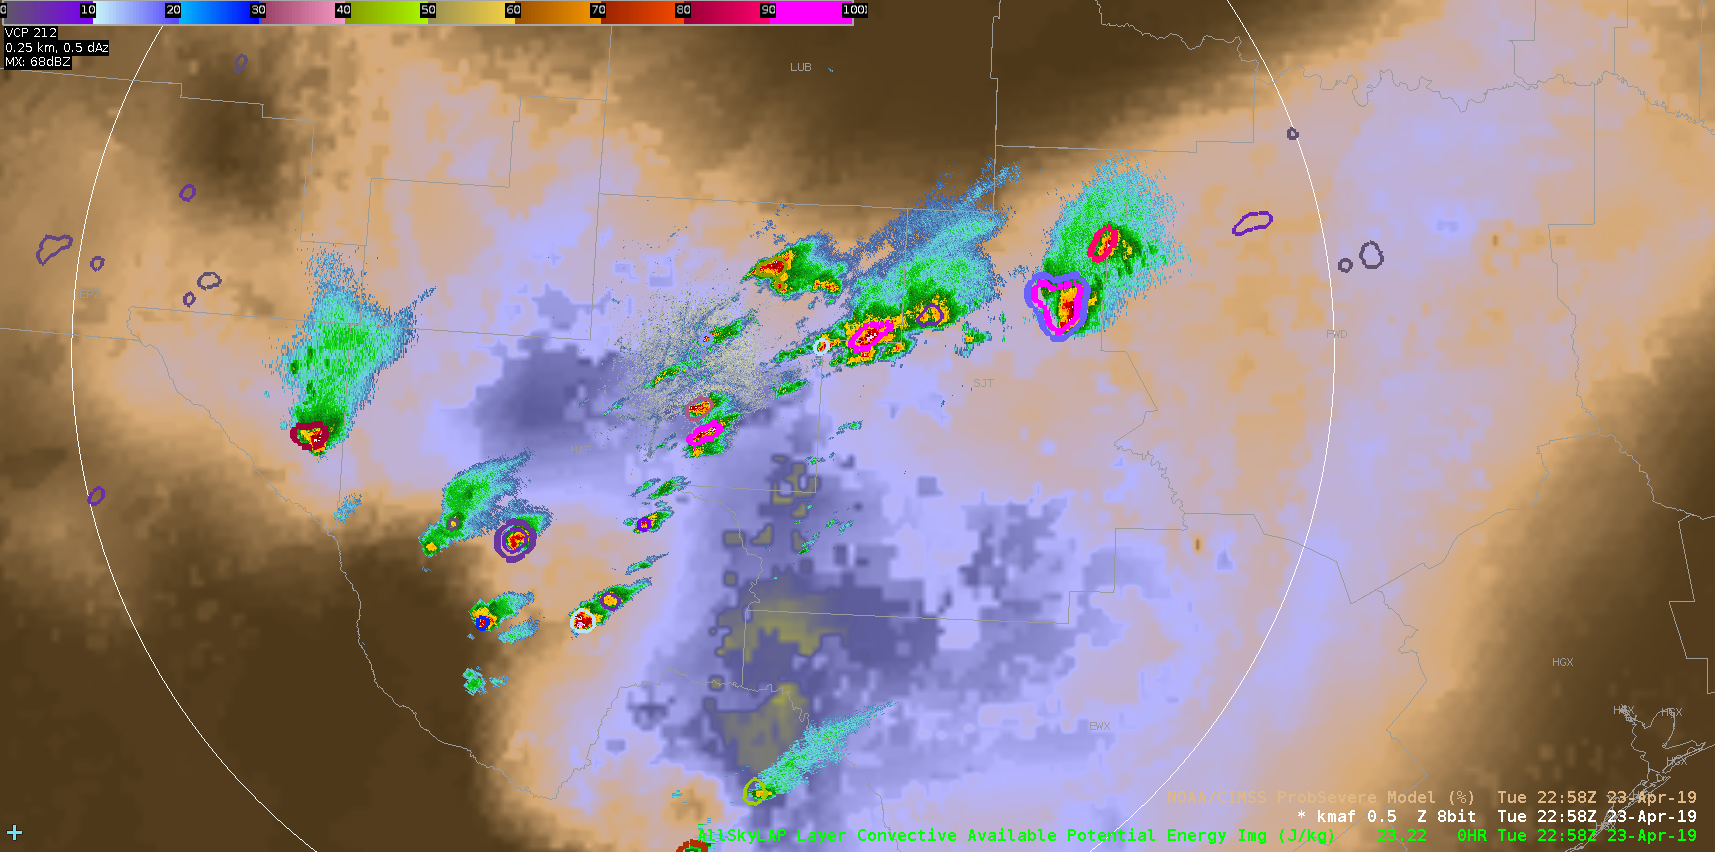
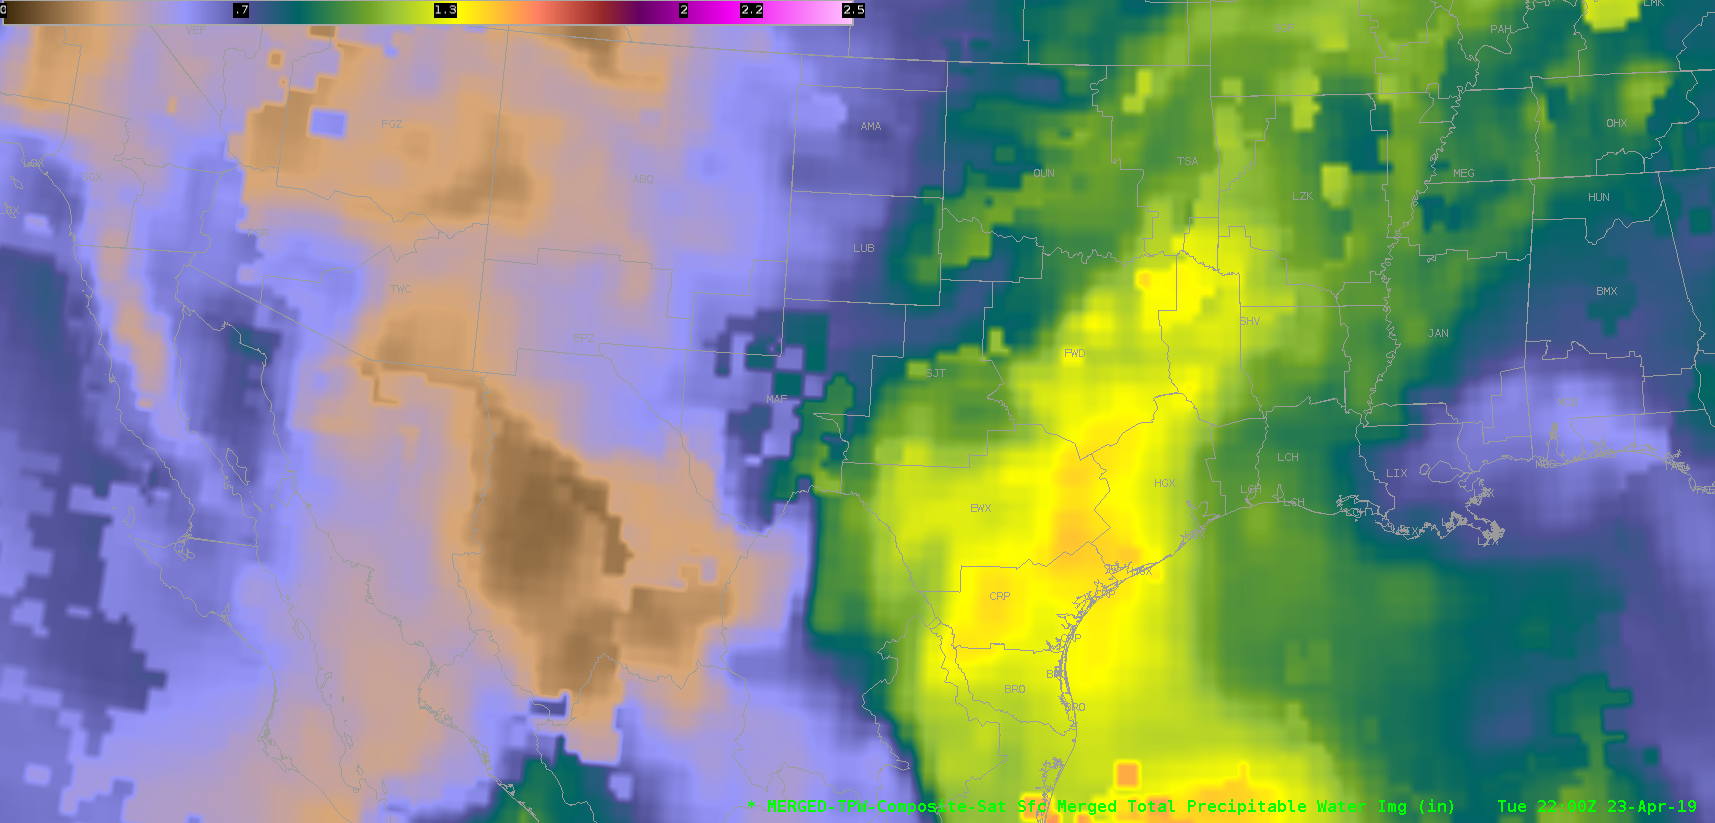
Went back to do a broader-scale mesoanalysis and noticed right away that storms are initiating right along the southwestern extent of a moisture/instability gradient, and following a SW to NE gradient between two areas of higher PWATs/CAPE, as depicted on the middle image below (reflectivity overlaid on AllSky CAPE). Just focusing on the trend aspect of these products is very useful in determining where storms may continue to develop and roll. I attempted to look at the merged TPW product, but unfortunately, the data I have is almost an hour old by the time of these screenshots, and the lower resolution isn’t as easy to work with in comparison. It’s possible the values of the TPW product may be closer to reality, but gravitating more toward the tendencies of the current state of the atmosphere found in the AllSky products seem to be more useful for this purpose.
~Gritty
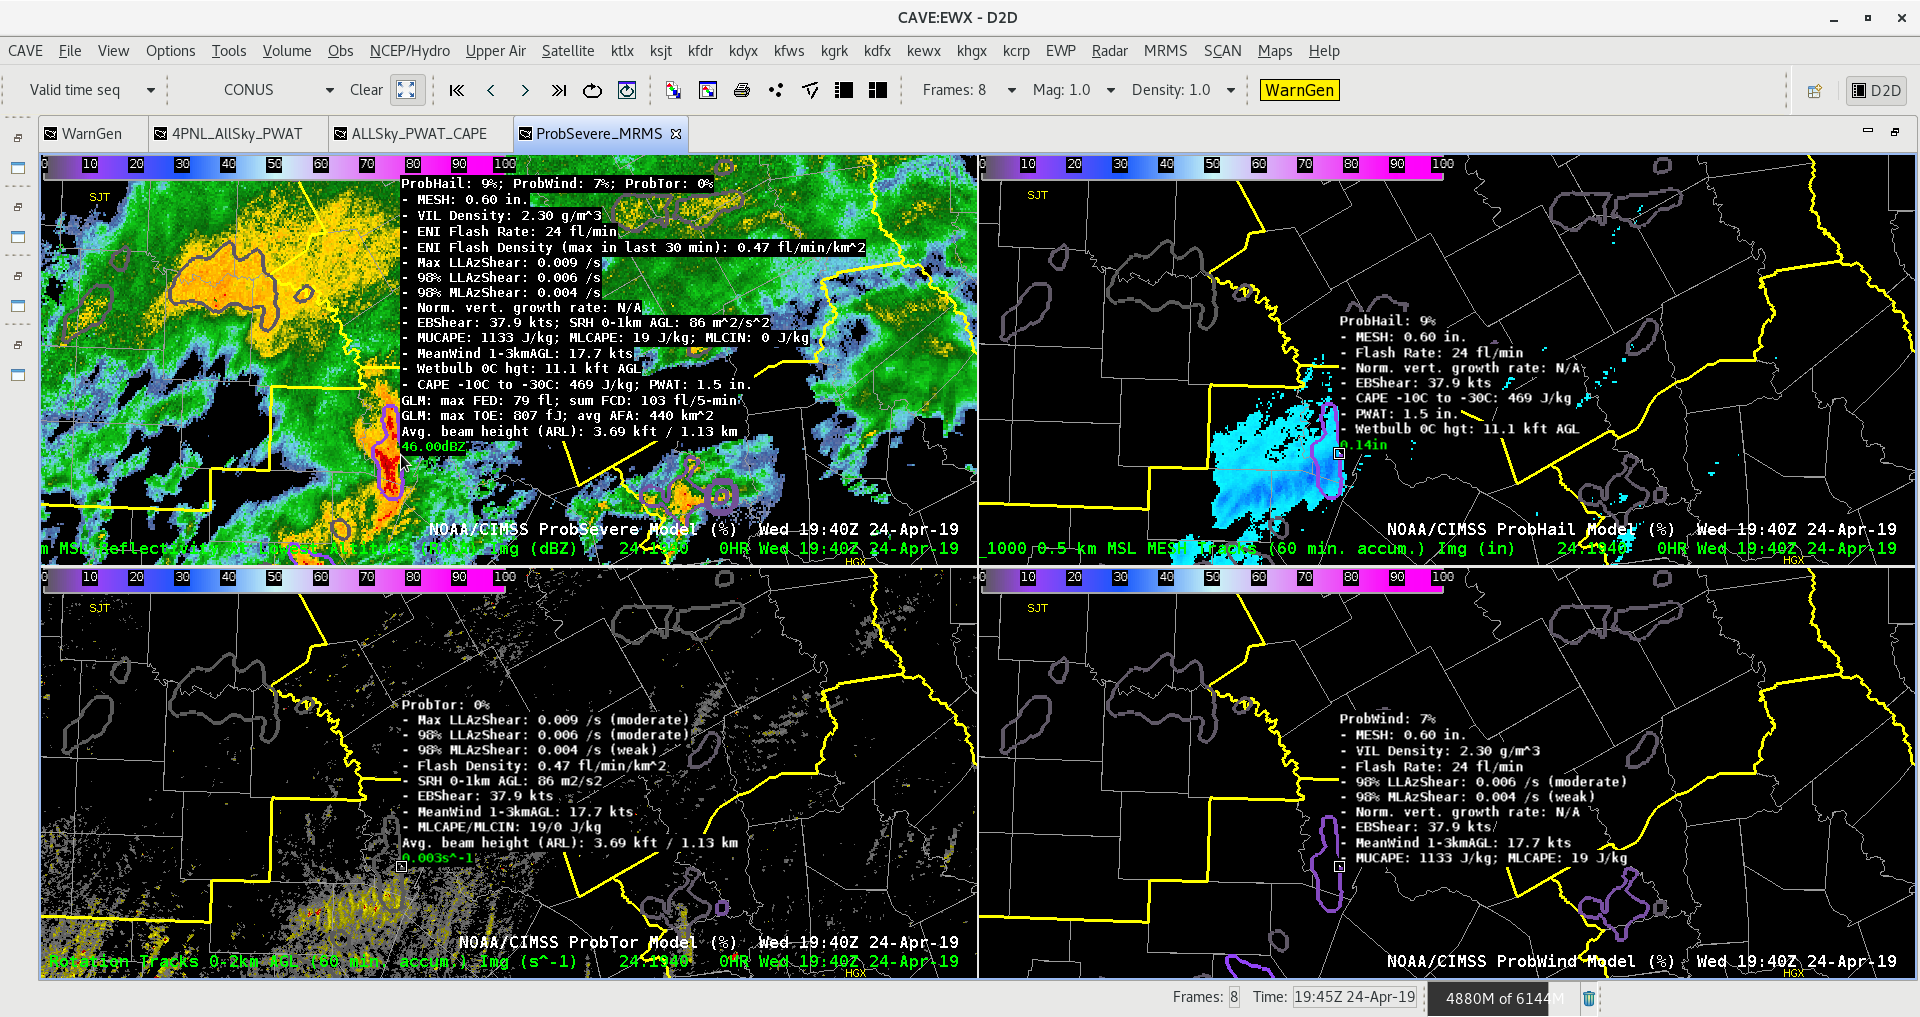
Merged AzShear in West Texas – Large Distance from Radars
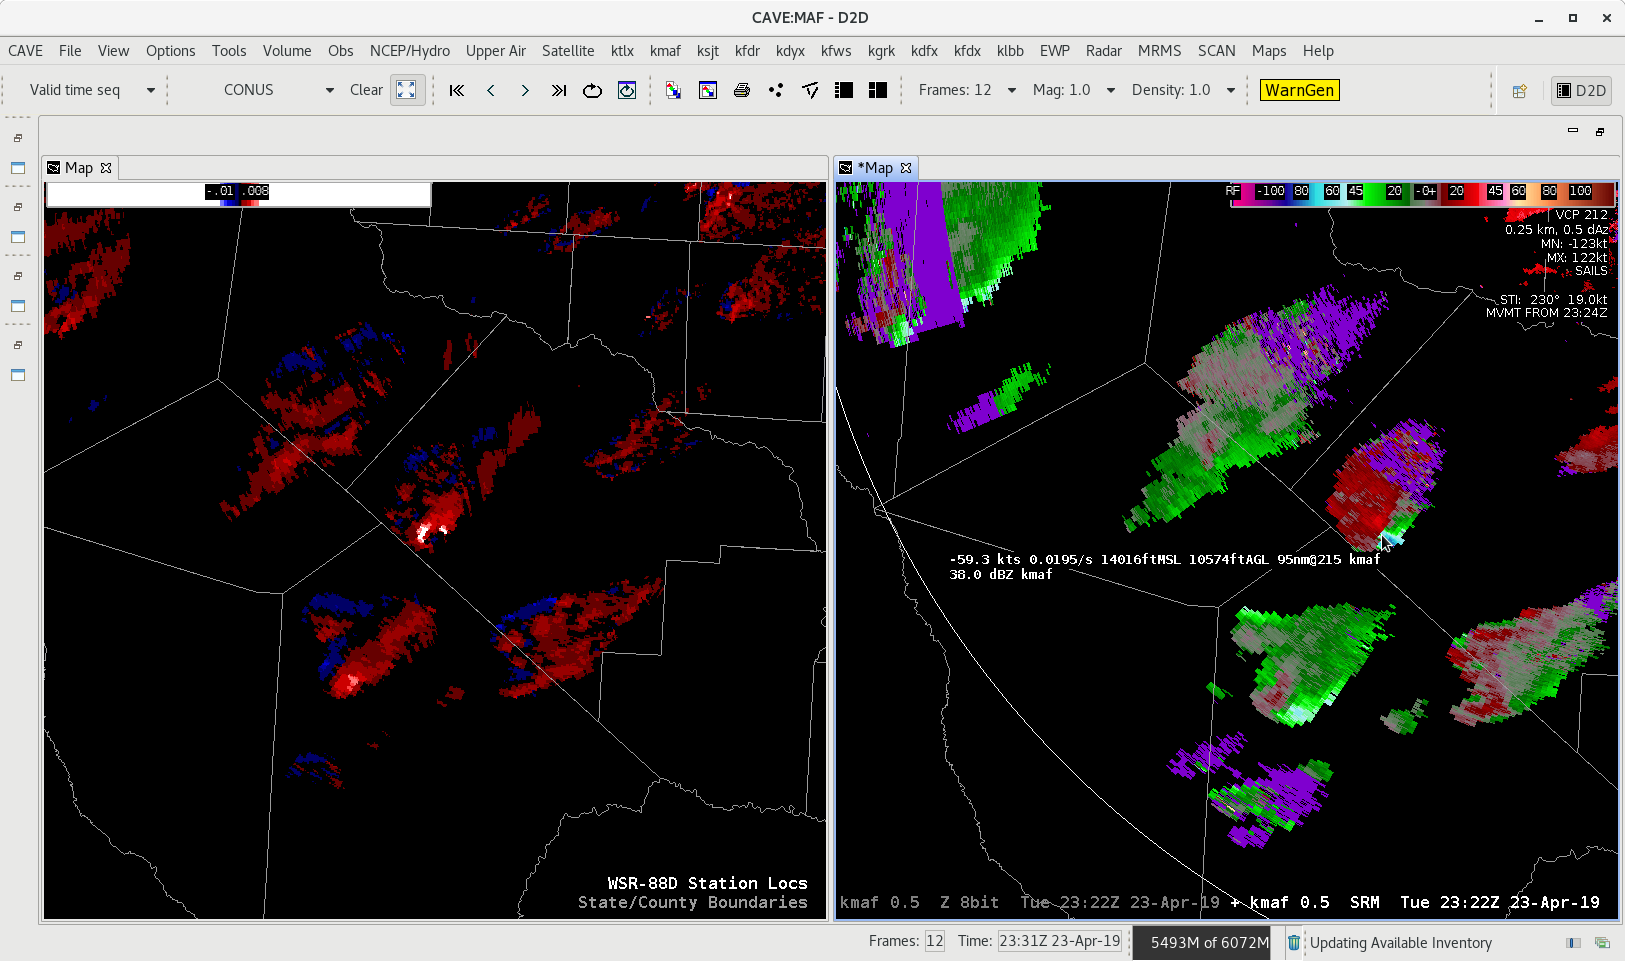
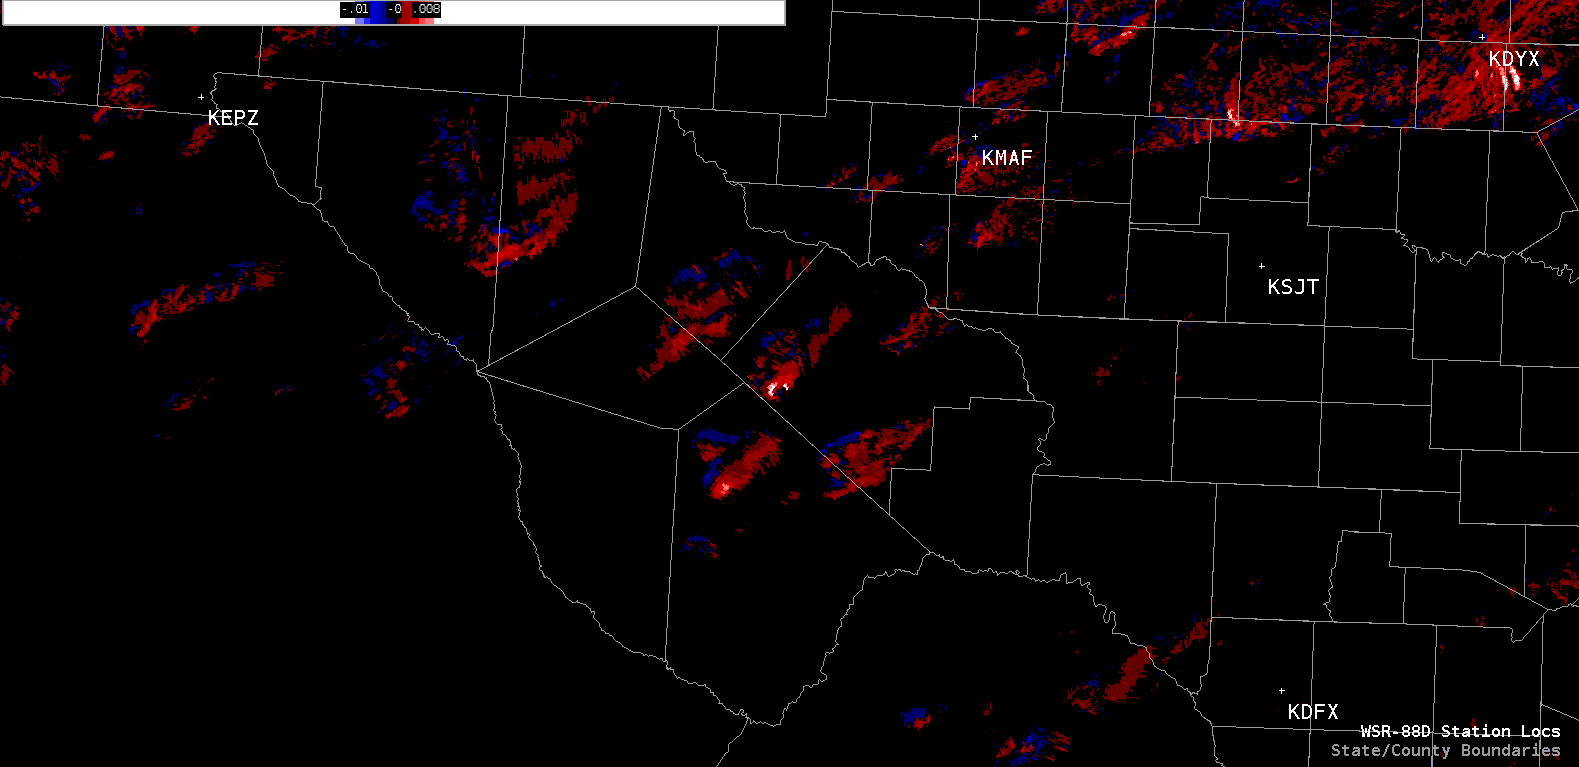
Looking at the Merged AzShear across West Texas the issue of how many radars are taken into account when calculating different MRMS parameters. You can see the SRM from KMAF, the closest radar to the storms. These storms are rotating in the mid-levels but the radar is looking between 10,000 and 16,000 feet depending on which storm you reference. The Merged AzShear is pegging the storm storms where the circulation is evident, but the question is since KMAF is closest is the AzShear product taking in more than one radar? If it is all the other neighboring radars (KEPZ, KDFX, and KSJT) are all as far or farther away, which means they would be looking even higher in the storm. The image below shows how far the radar are from the ongoing storms.
- Alexander T.
More Lightning Analysis…
So far, the MFA is following the previous logic of using it as a way to identify vigorous updrafts. Below, the progression in a 15-minute period follows that correlation between the smaller flashes increasing in area indicating a strengthening cell(s). However, I could see its utility degraded in a larger-scale multicell environment with clusters close together, especially as the areas of smaller flashes increases, given the low-resolution of the grid itself. As for Total Optical Energy (TOE, at the bottom), I think there is benefit in using this product as well to monitor trends, but I had to use a different color curve for it to stand out to me more (last animation, below).
~Gritty
2146Z:

2155Z:

2200Z: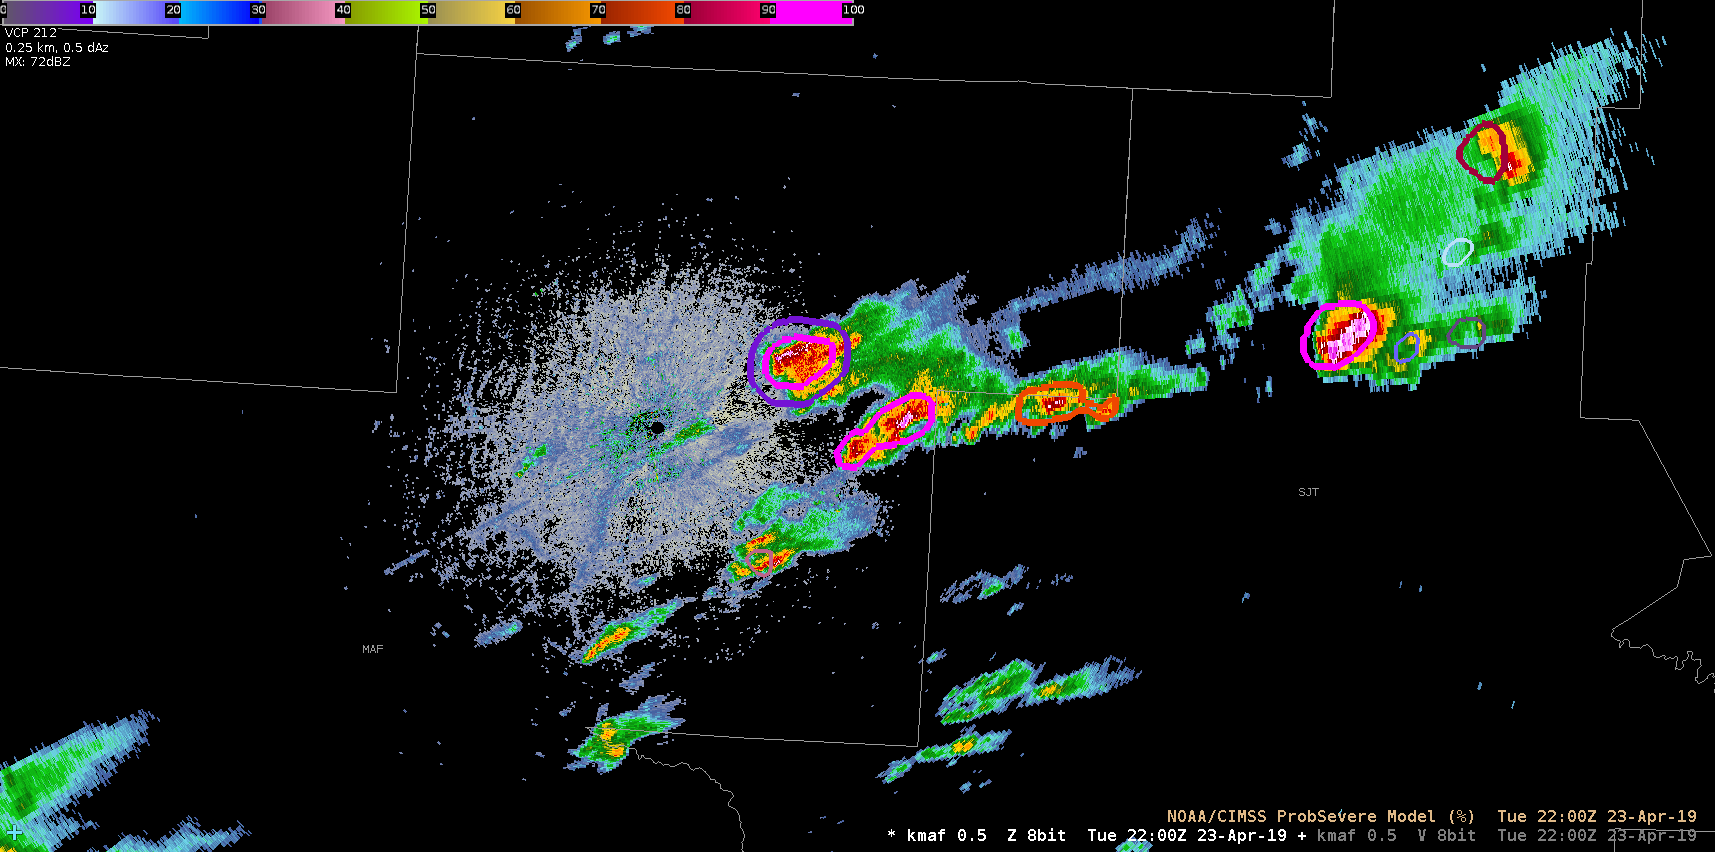

TOE Loops:
