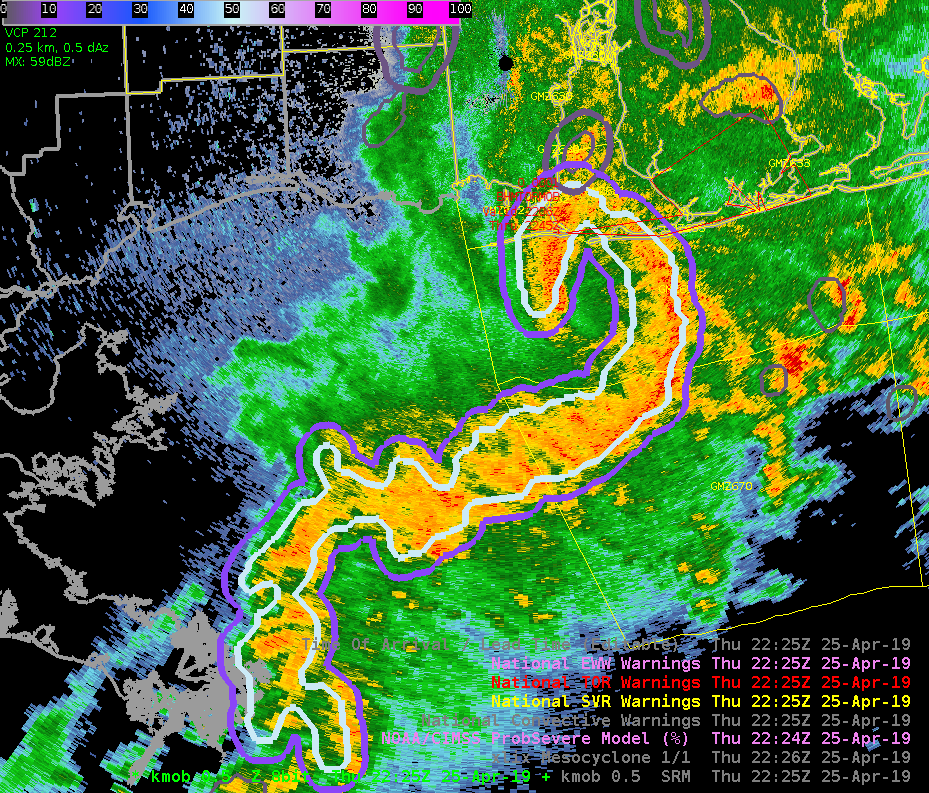
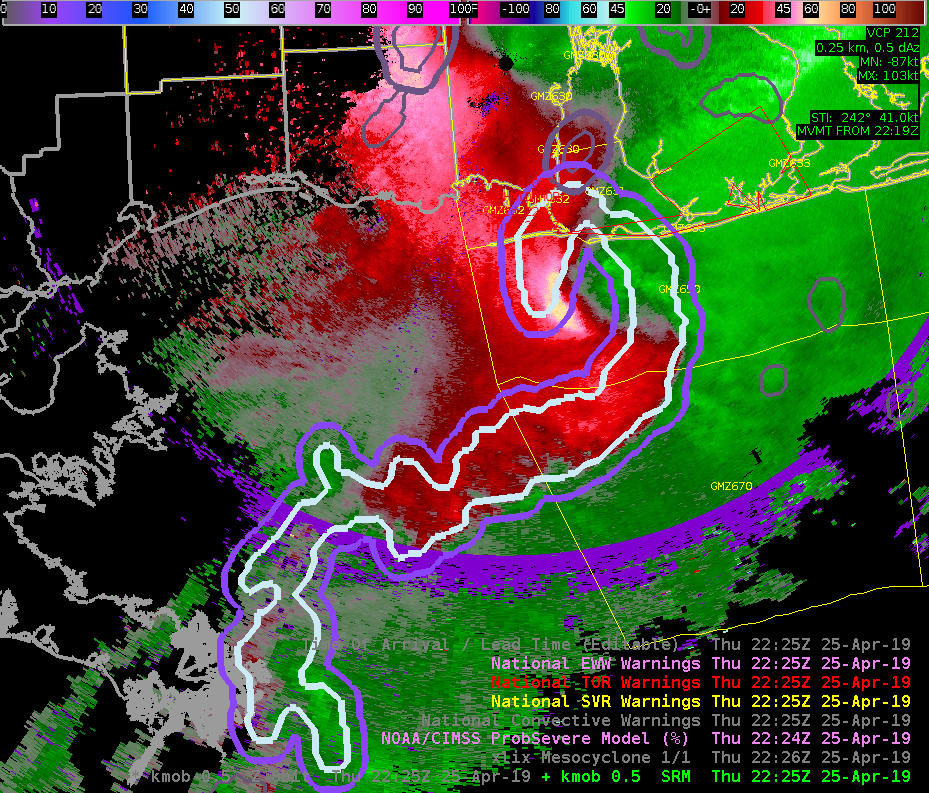
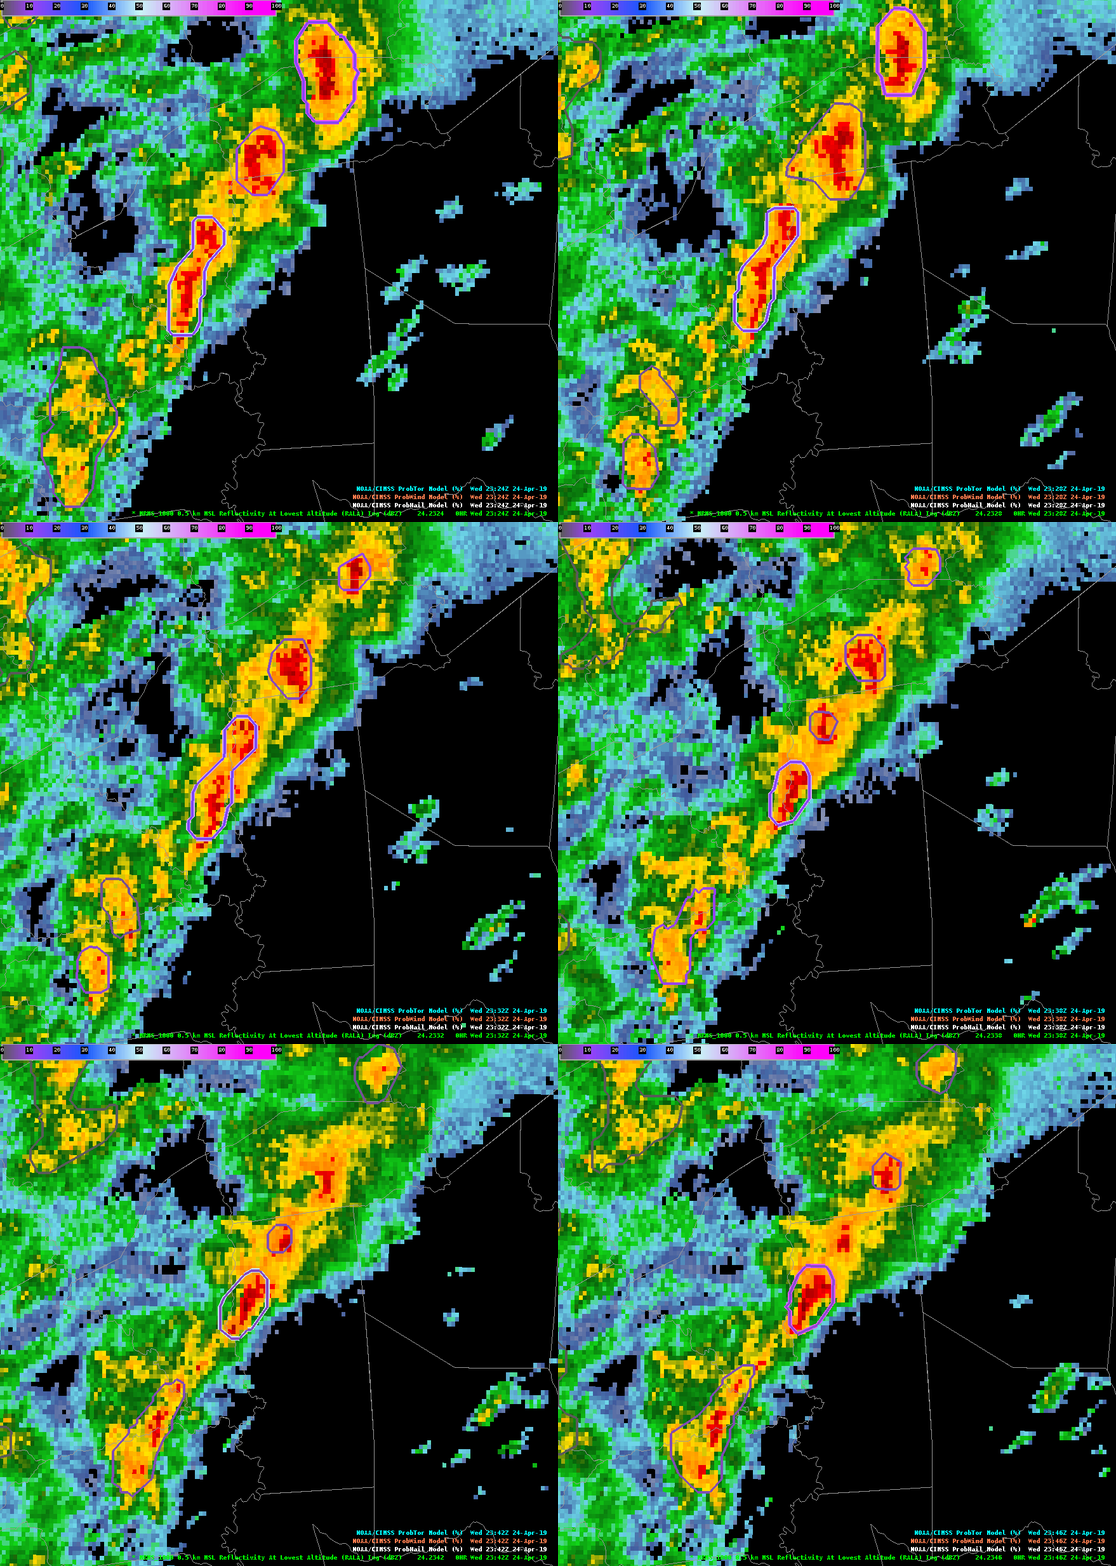
Large ProbSevere Blob

Here is one drawback of ProbSevere that has been briefly discussed. The areal extent of the identification is not based off of some of the features that feed into it, but rather the dBZ reflectivity representation. In this case, for a MCV and line of storms, the blob below is approximately 152 miles long using a center line to calculate the distance. ProbSevere kept this size of storm for two 2 minute calculations before breaking the storms apart into several different identifications.

-Alexander T.

Tracking Meteogram Tool With AzShear

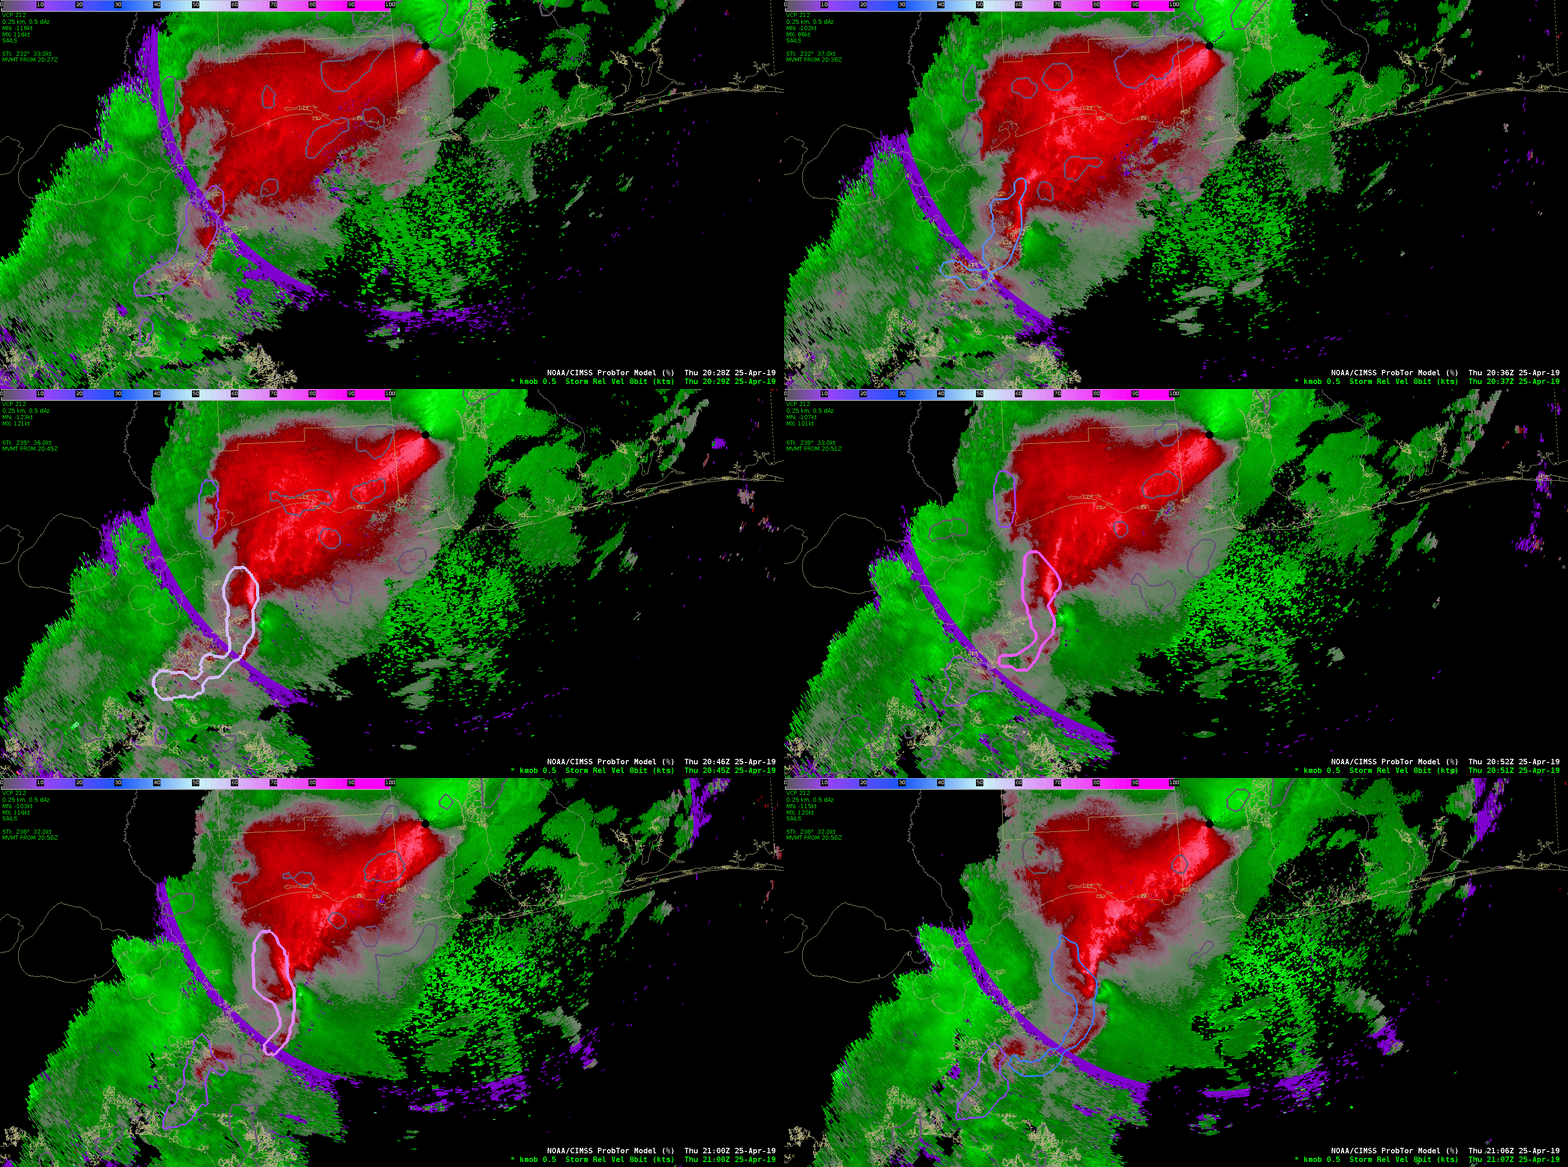
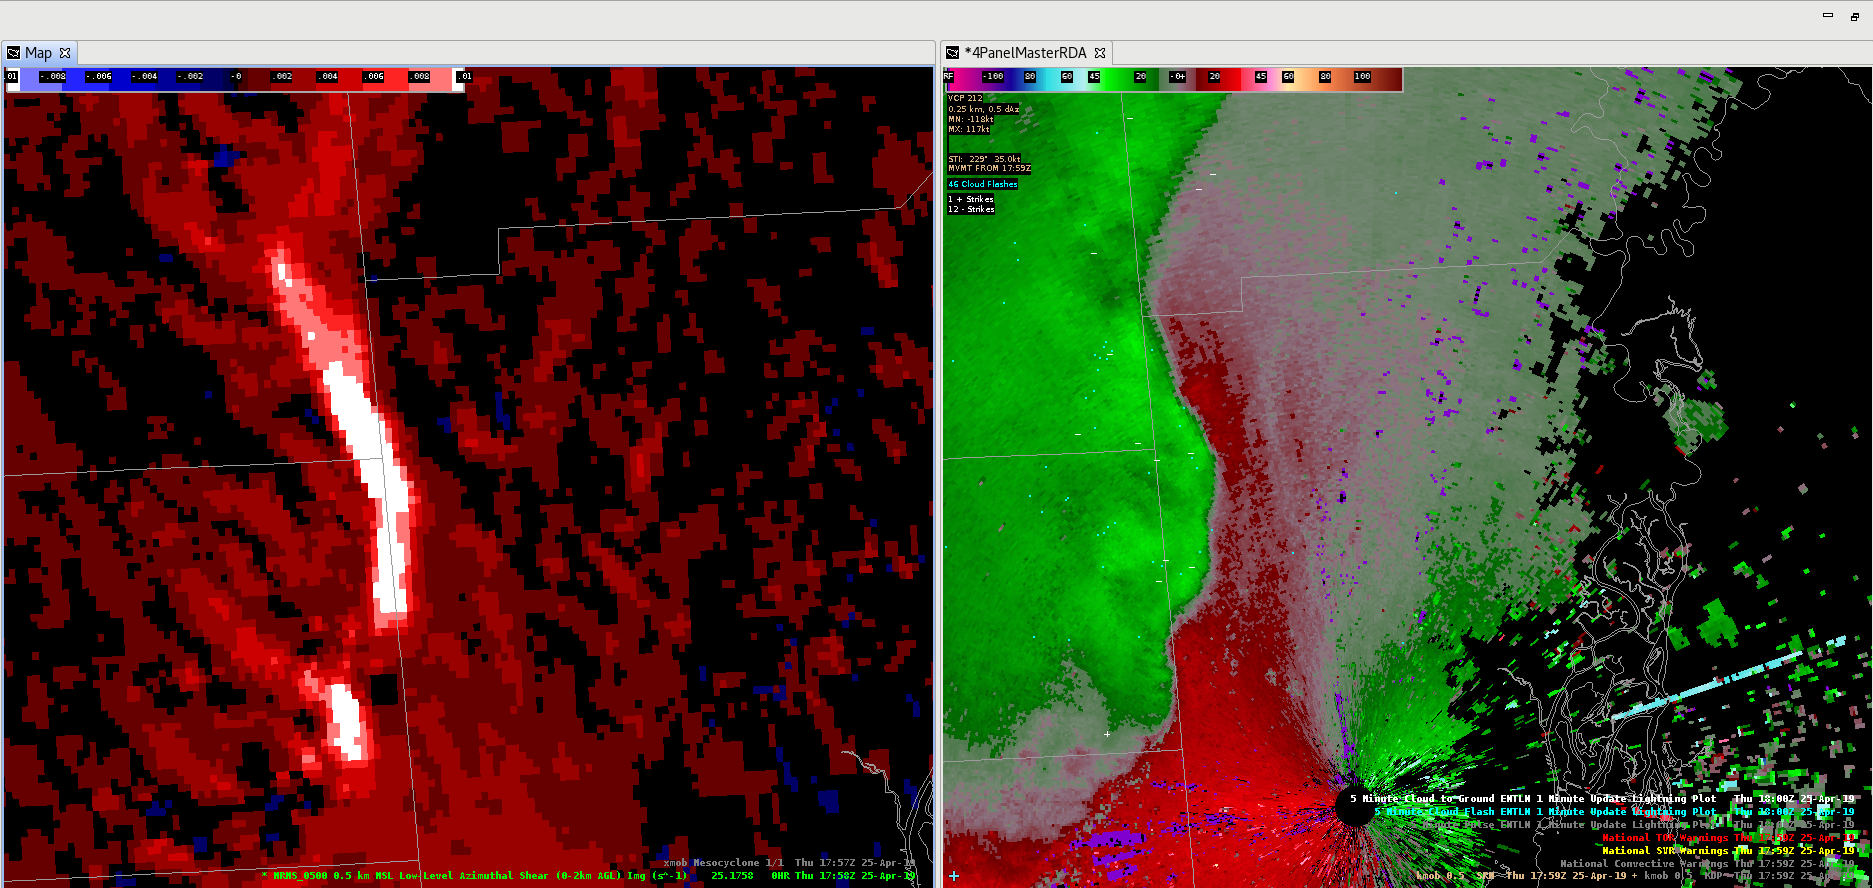
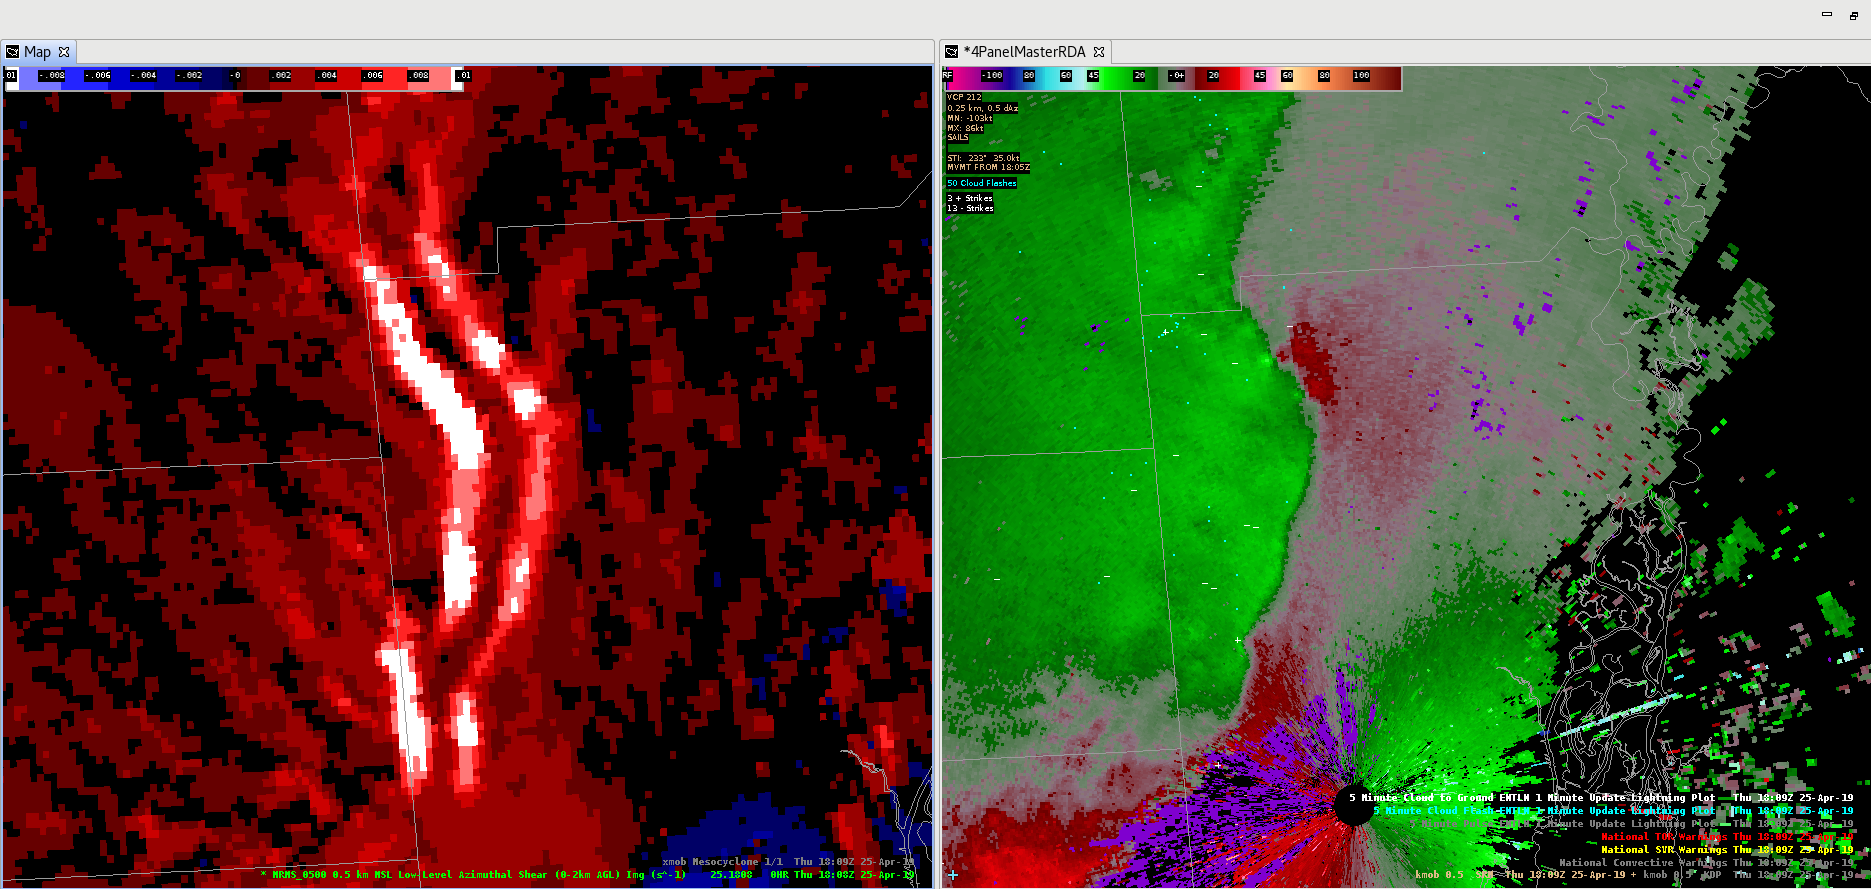
One of the discussion points that has come up about the Merged AzShear product is monitoring the trends of the AzShear as storms progress. One way to do this that is built into AWIPS is the Tracking Meteogram tool. The following are a  GIF and PNG for a MCV just off of the MOB CWA. The radar image is above. The GIF shows the tracking tool and AzShear and then the plot showing the trends. In this case you can see general increase in AzShear values. There are some limitations of the Tracking Meteogram took like only being able to track one feature at a time, there is a lot of things to edit and modify with the Meteogram (the position and size of the tracking area), and this would not be an easy tool to modify and update while trying to focus on other warnings.

-Alexander T.

Long Flash via GLM in the Anvil / Stratiform Region

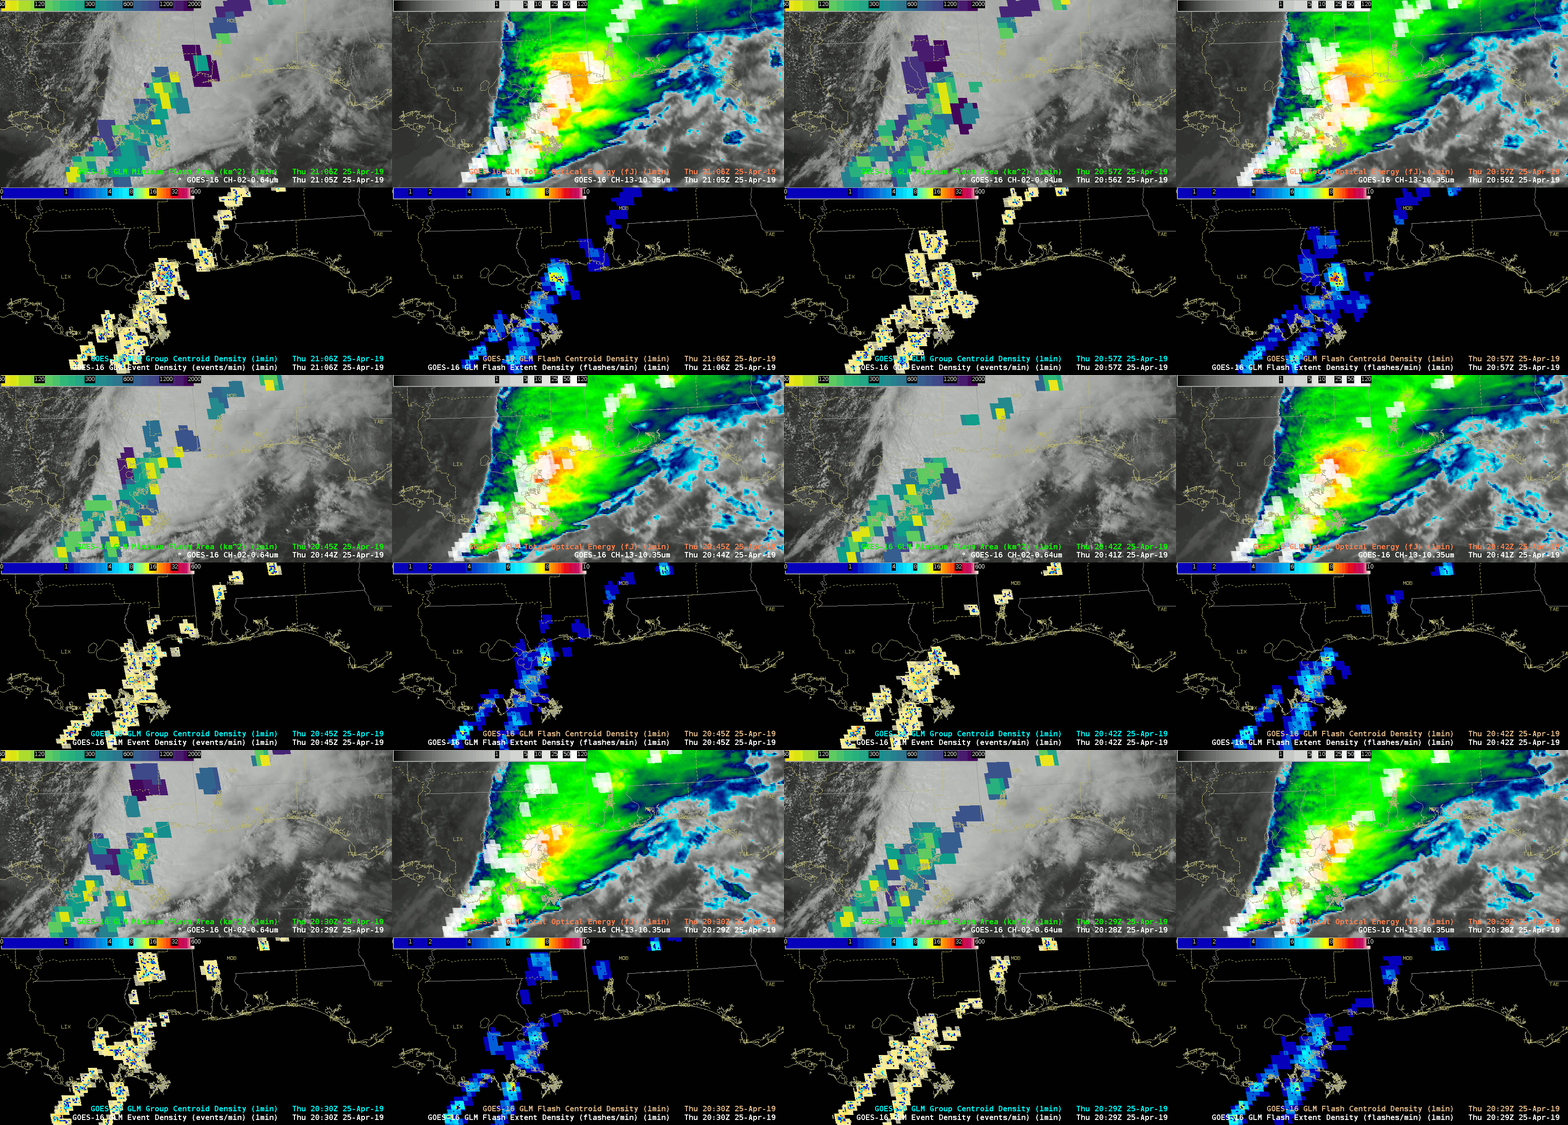
GLM does a good job at capturing large flashes that appear in the stratiform region behind lines of storms. In this case looking at the Total Optical Energy for 5 minutes with 1 minute updates you can see the large flash show up (the yellows and the whites). Reflectivity from KMOB and Visible satellite are layers under the TOE data.

This large flash has Minimum Flash Area values between 1100-1700 km^2 with the Average Flash Area anywhere between 2700-3600 km^2. This is a large flash that extends back into the stratiform region (the Anvil) of the cumulonimbus clouds. You can see the lighter precipitation on the RALA (Reflectivity at Lowest Altitude) product below. The darker blocky outlined area is the Average Flash Size with other variables in the 4 panel.

One important operator note is to be careful what you time match with the GLM lightning data. In this case another forecaster had time matched with the 1 minute meso-sector of satellite and because of errors in that data the large anvil flash was skipped in the one minute GLM data. If the GLM data is the focus of your analysis always remember to time match with it and then use other data (like satellite or radar) on those time scales.

-Alexander T.

AzShear and storm mode

An example where mode can be inferred using AzShear products. In the first image, we’re dealing with a nice linear segment without any ‘concerning’ rotational features.

Shortly after, the AzShear product clearly highlights threat areas for QLCS tornadic development in at least two distinct locations.

Having this product up in an SA perspective, you’d be able to quickly tell when you need to start being concerned with a structure change in the line.

Merged AzShear for Strength Trends

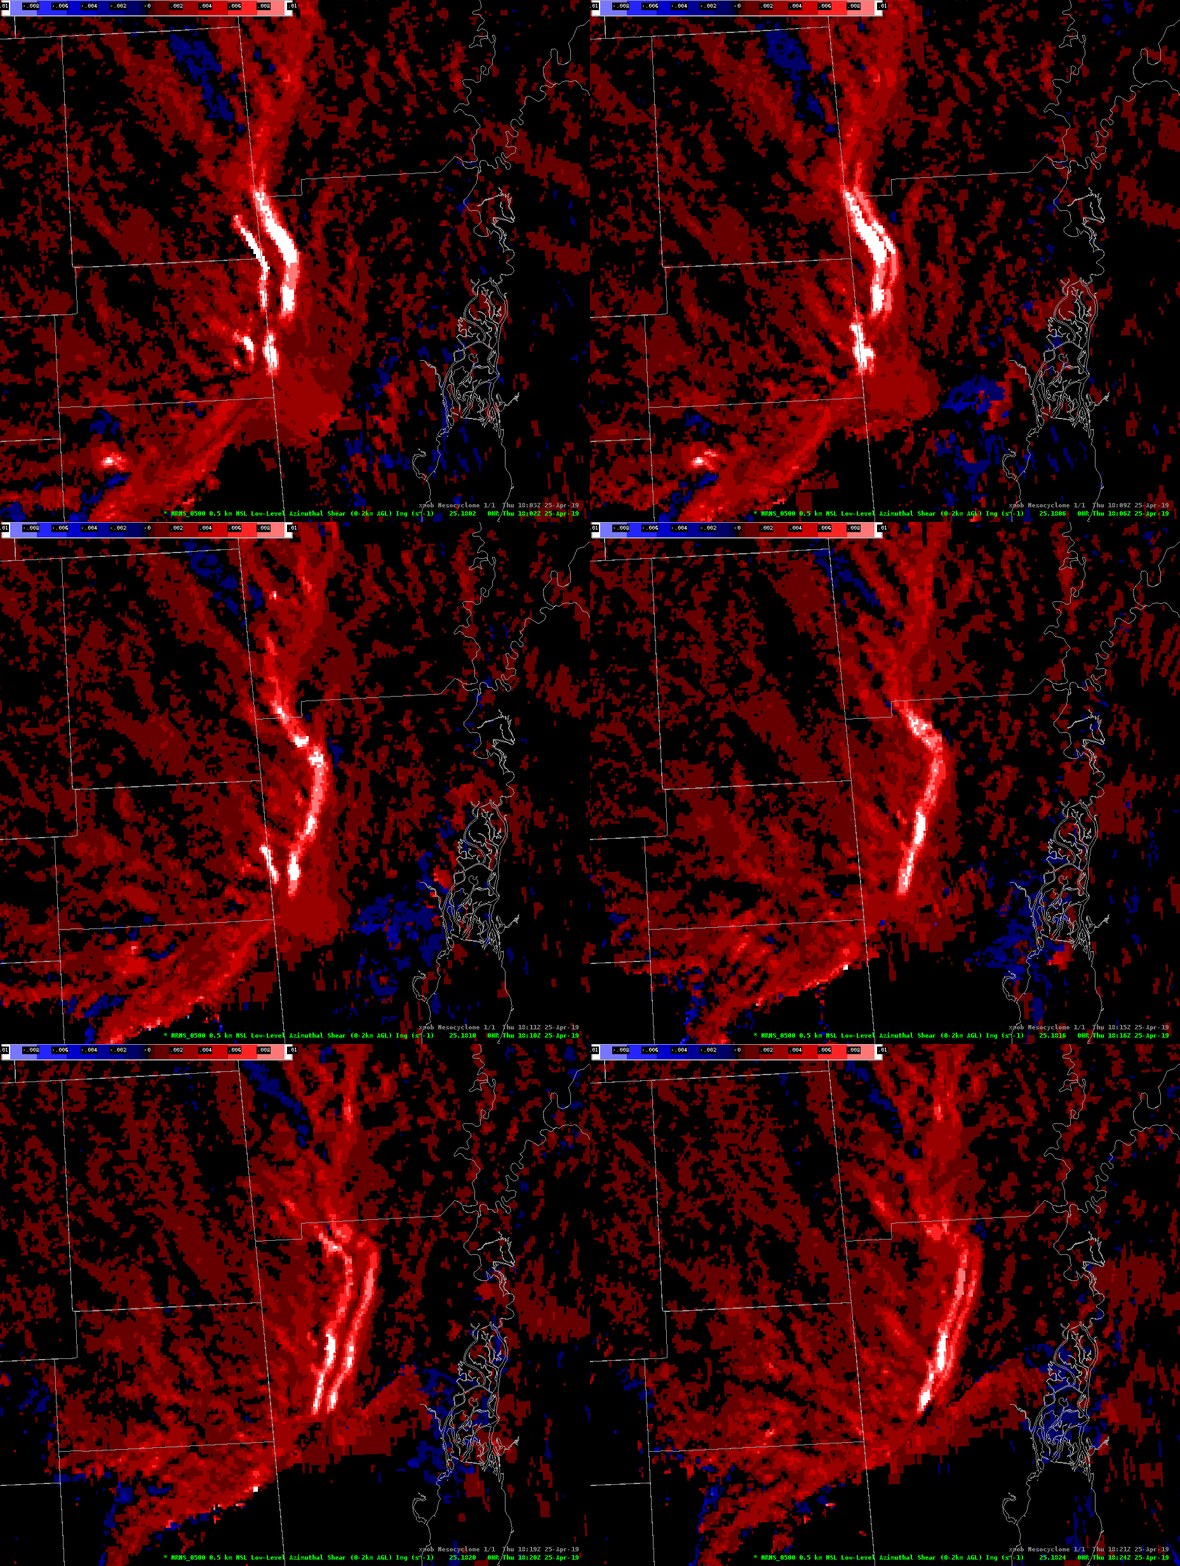
An example where AzShear data can show storm trends in one image without looping. As SAILS cuts come in you’re able to view rotational strength trends before the entire image is replaced by the next volume scan. Although this image is looping you can see the times when sails cuts would be overlain on one image.

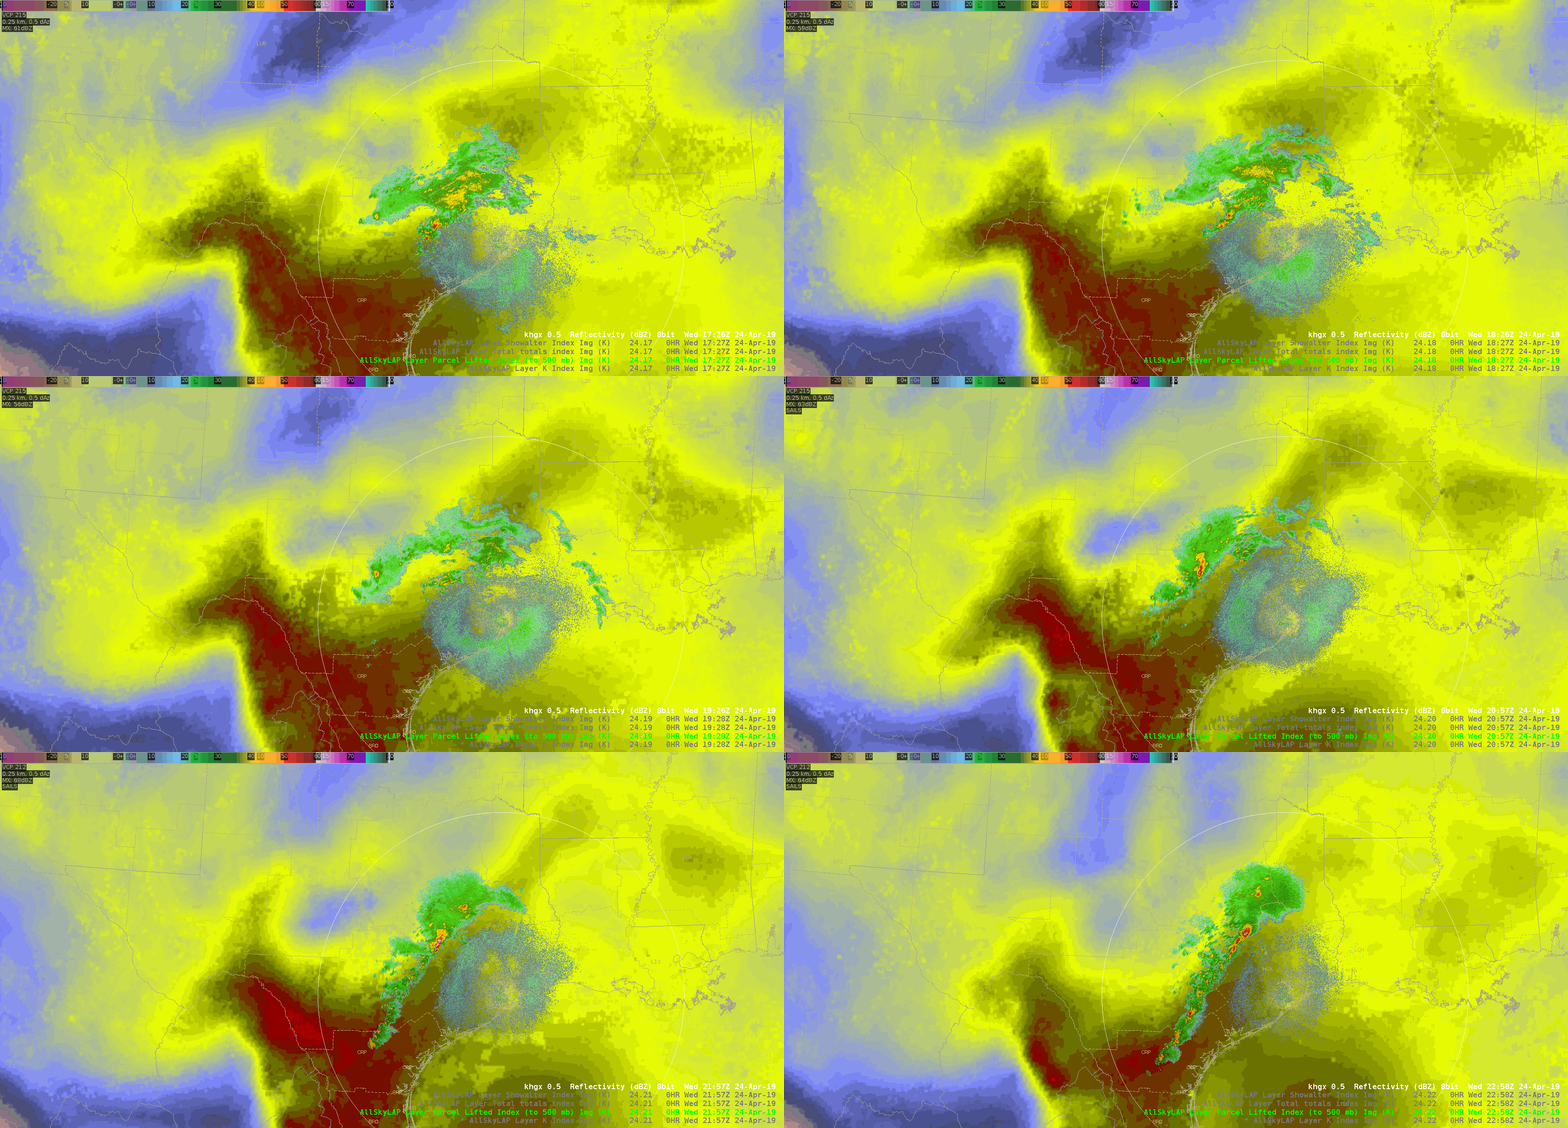
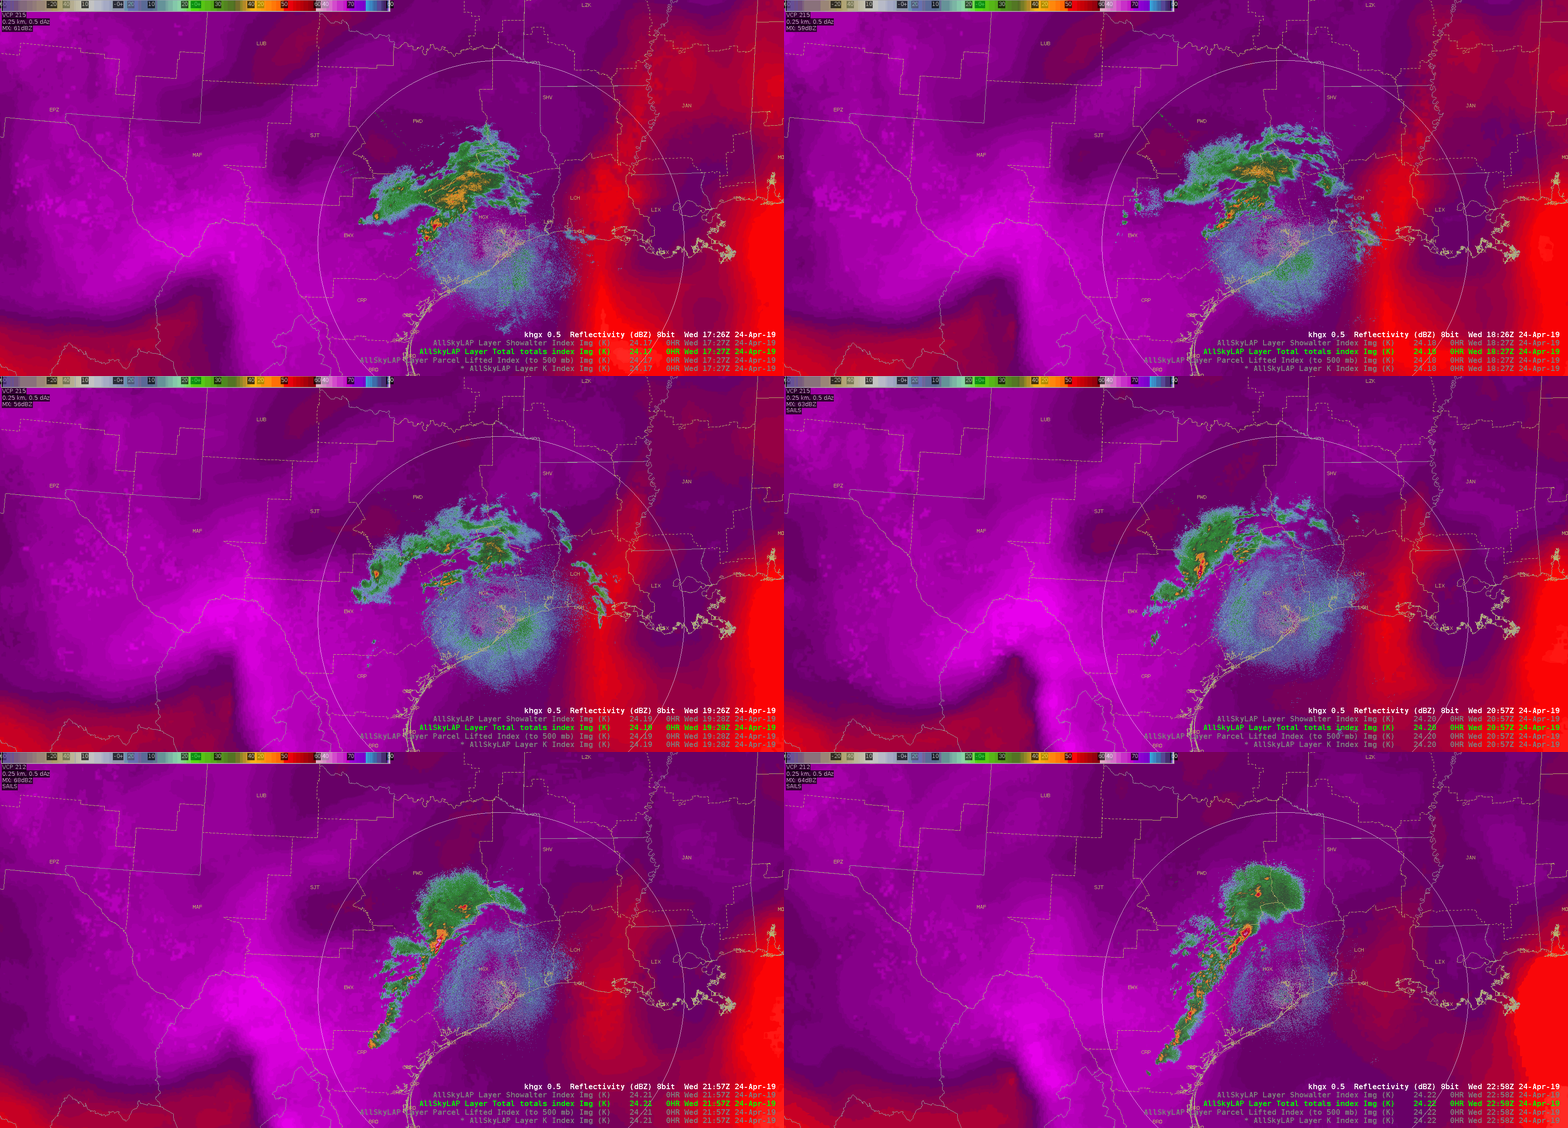
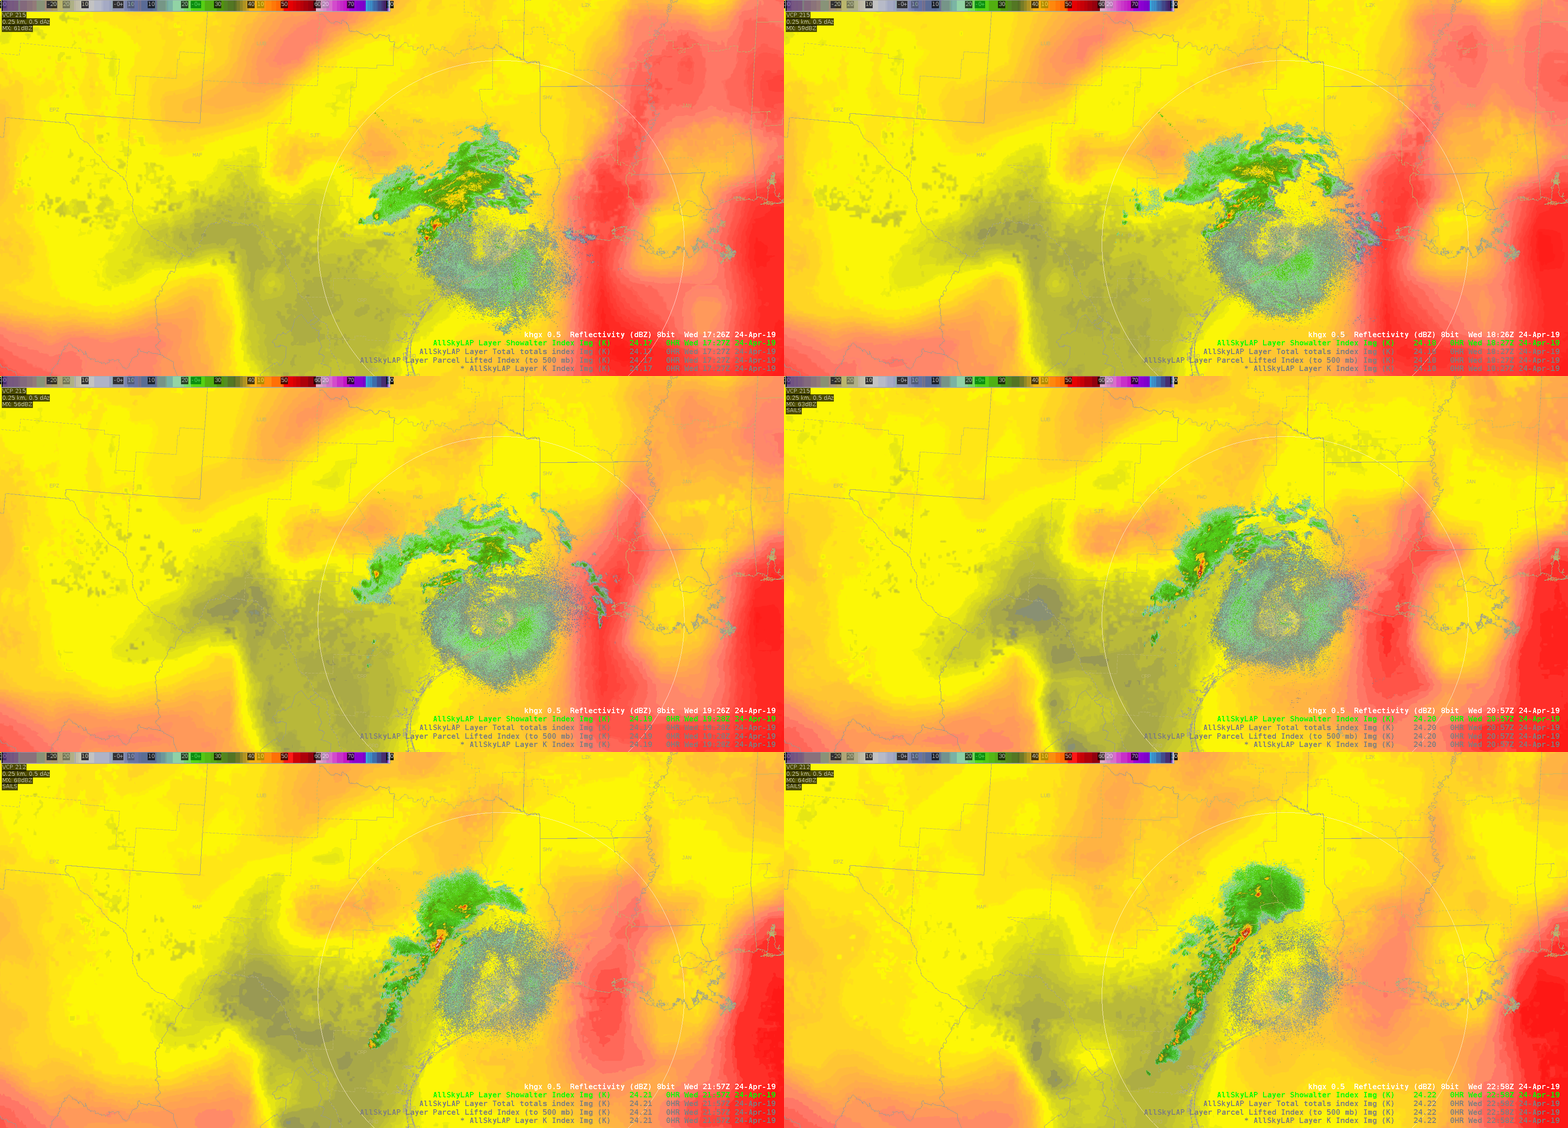
AllSky Indices

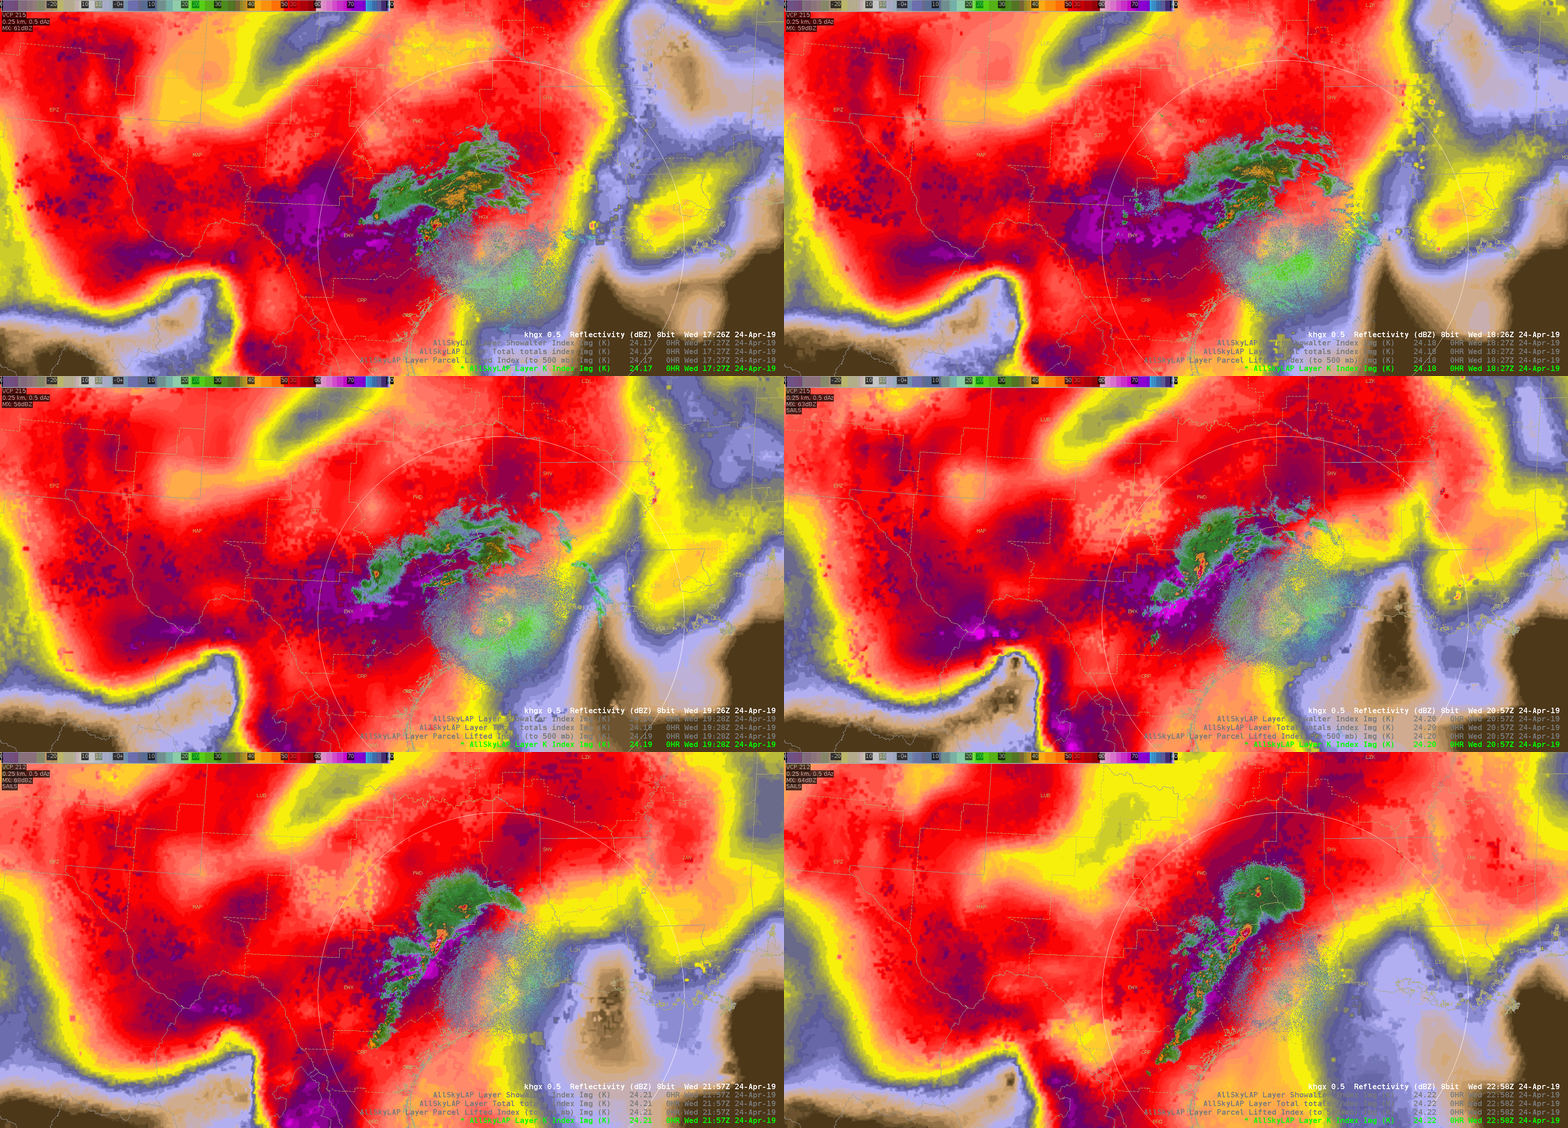
Of the indices below, there is some utility in these products, although did not find the Total Totals Index to be of much use considering there were warned storms with verification within HGX’s CWA. The K Index seemed to be the most useful, with the Lifted Index product showing the storms once again riding along a gradient.

~Gritty

G16 and G17 Flash Extent Comparison

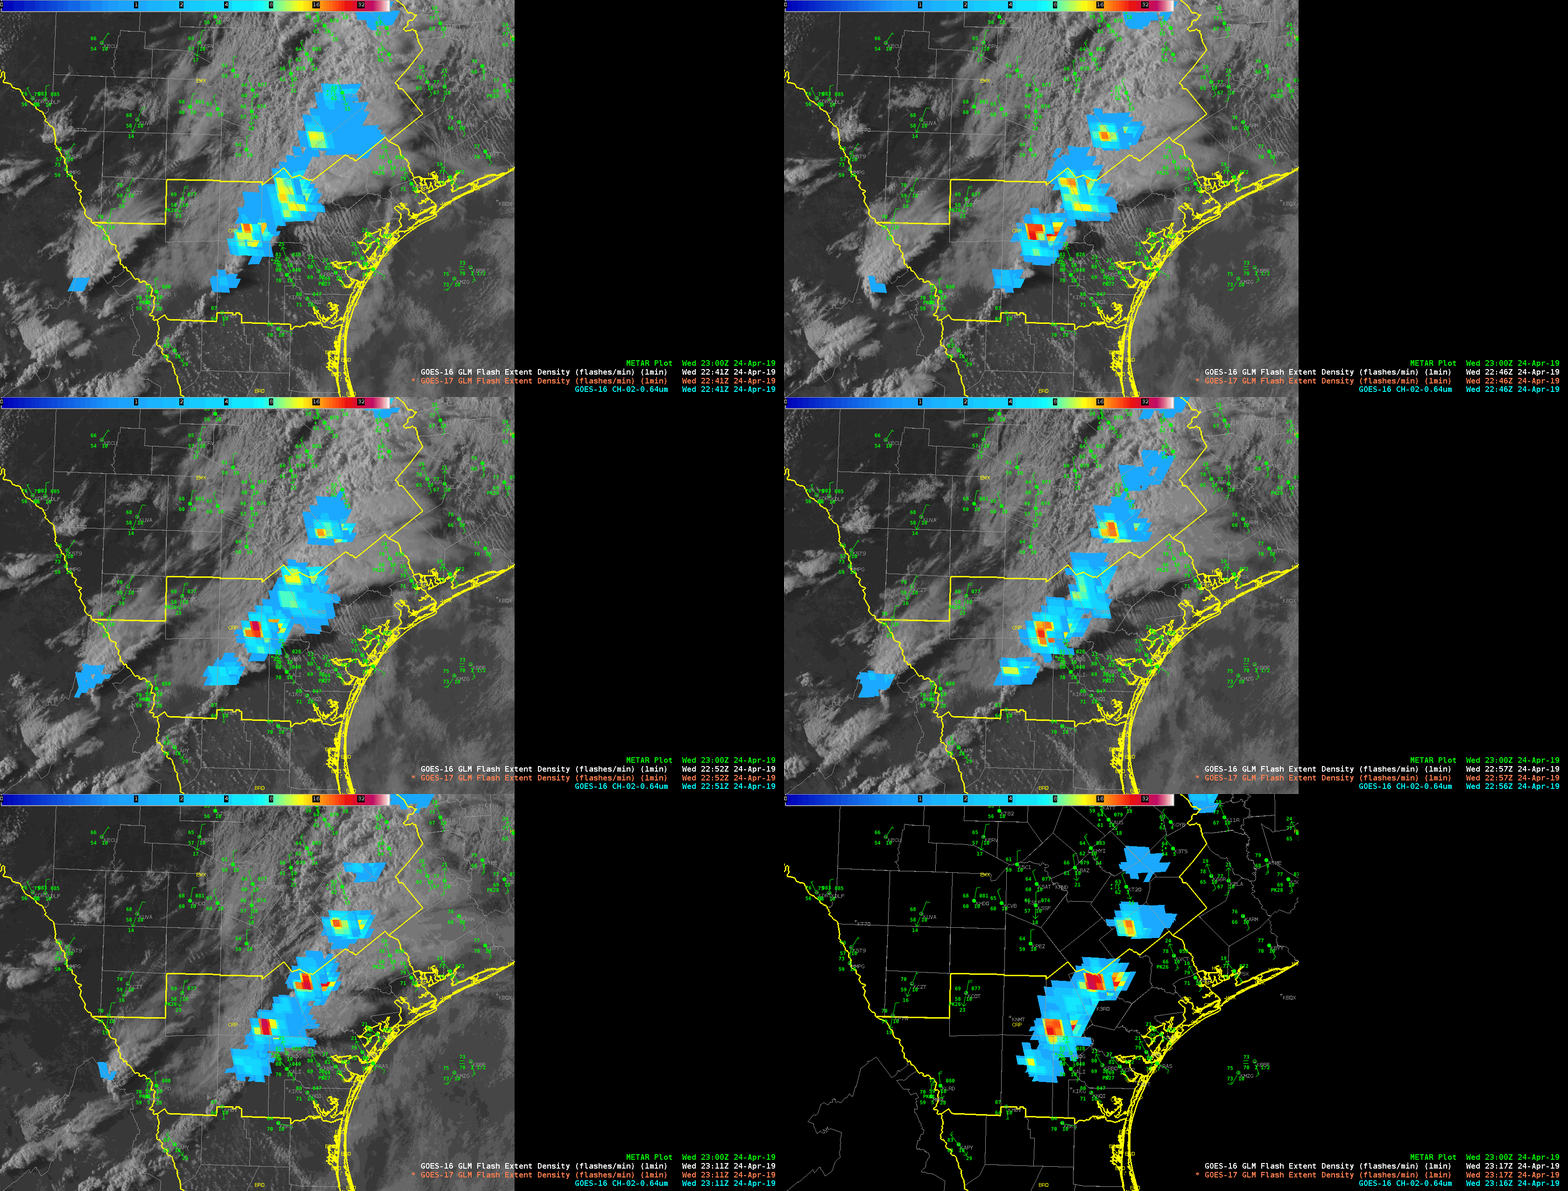
Showing a quick comparison of G16  and G17 Flash Extent Density over srn Texas.

Takeaways – some “minor” changes in Flash Extent absolute values but trends are similar.  Quick look – had higher values than G17.  Also, parallax is different – but to be expected.  Overall – think both products could be used interchangeably across TX.

The Evolution of an Intensifying Cluster

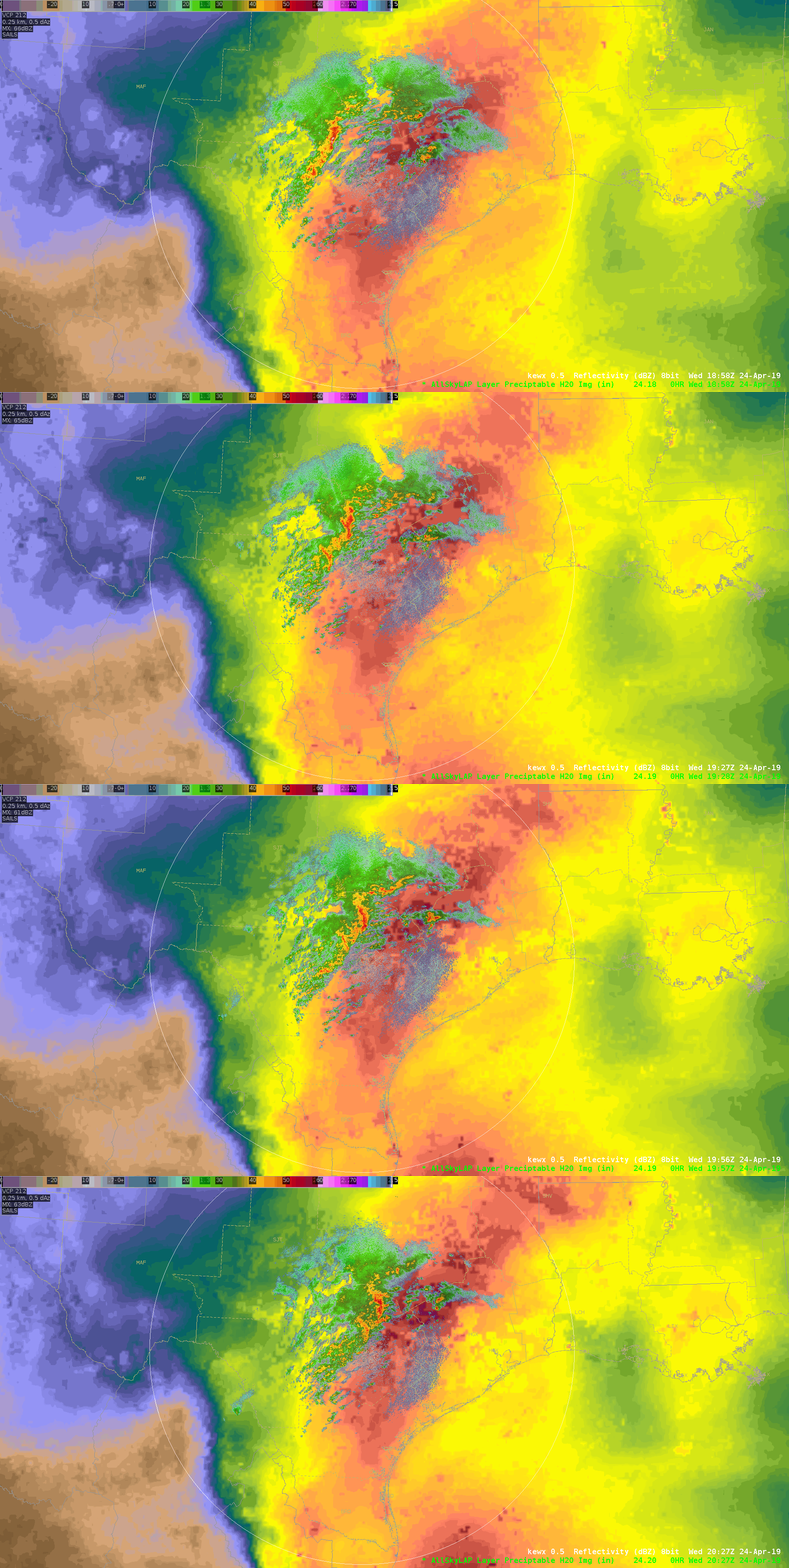
Storms in the EWX CWA early in the shift were generally remaining sub-severe, with what looked to be heavy rain as the dominant threat. The first two loops (below), the storms were riding right along the gradient of the PWATs and CAPE. (continues below)
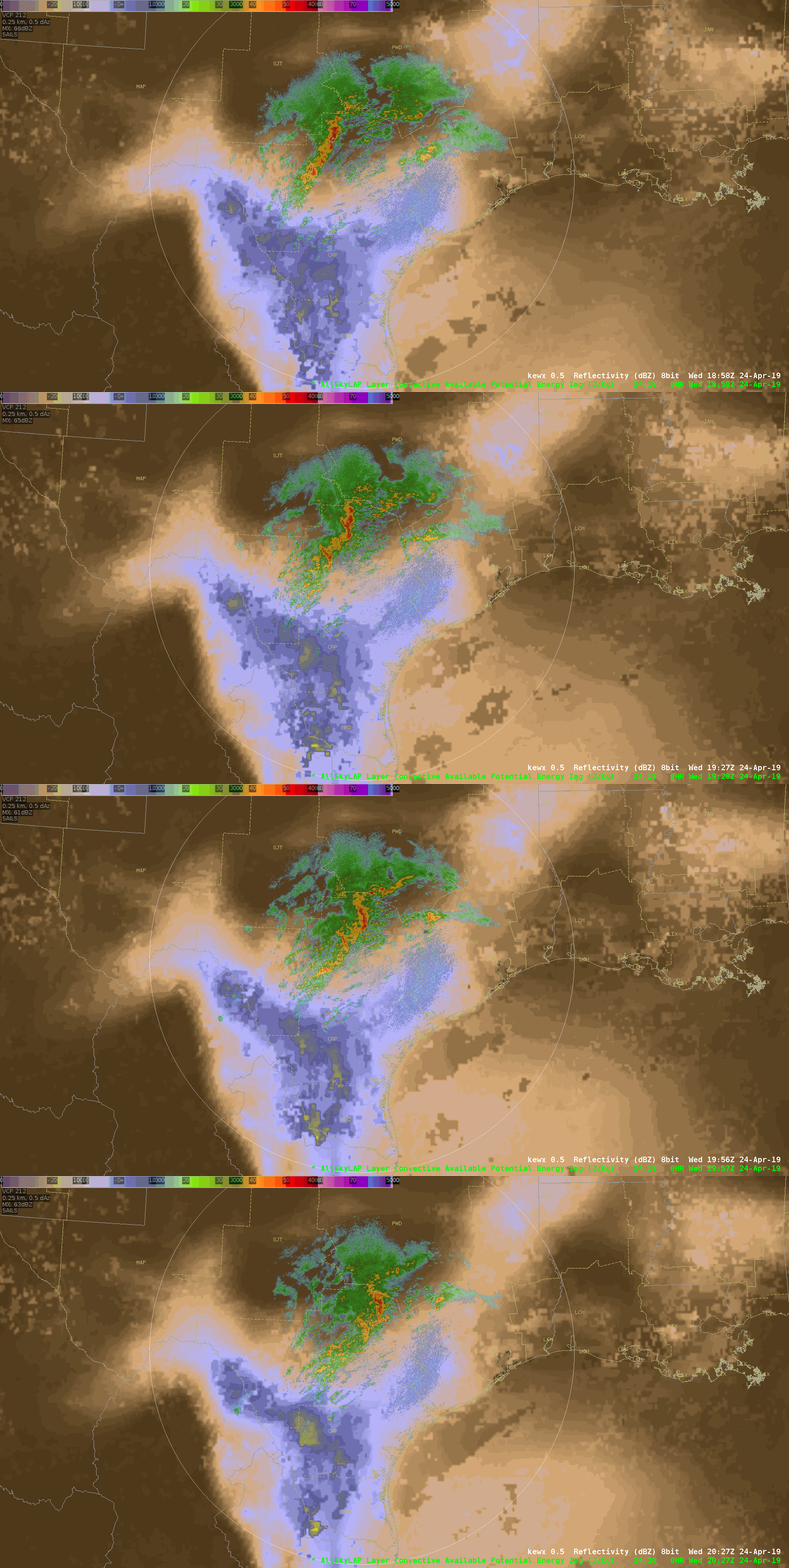
As the cluster of storms reached the eastern edge of a greater area of instability (below), the concern then turned to how much of the instability would be tapped into and how storms would react, with the thought that they’d likely become more robust. (continues below)
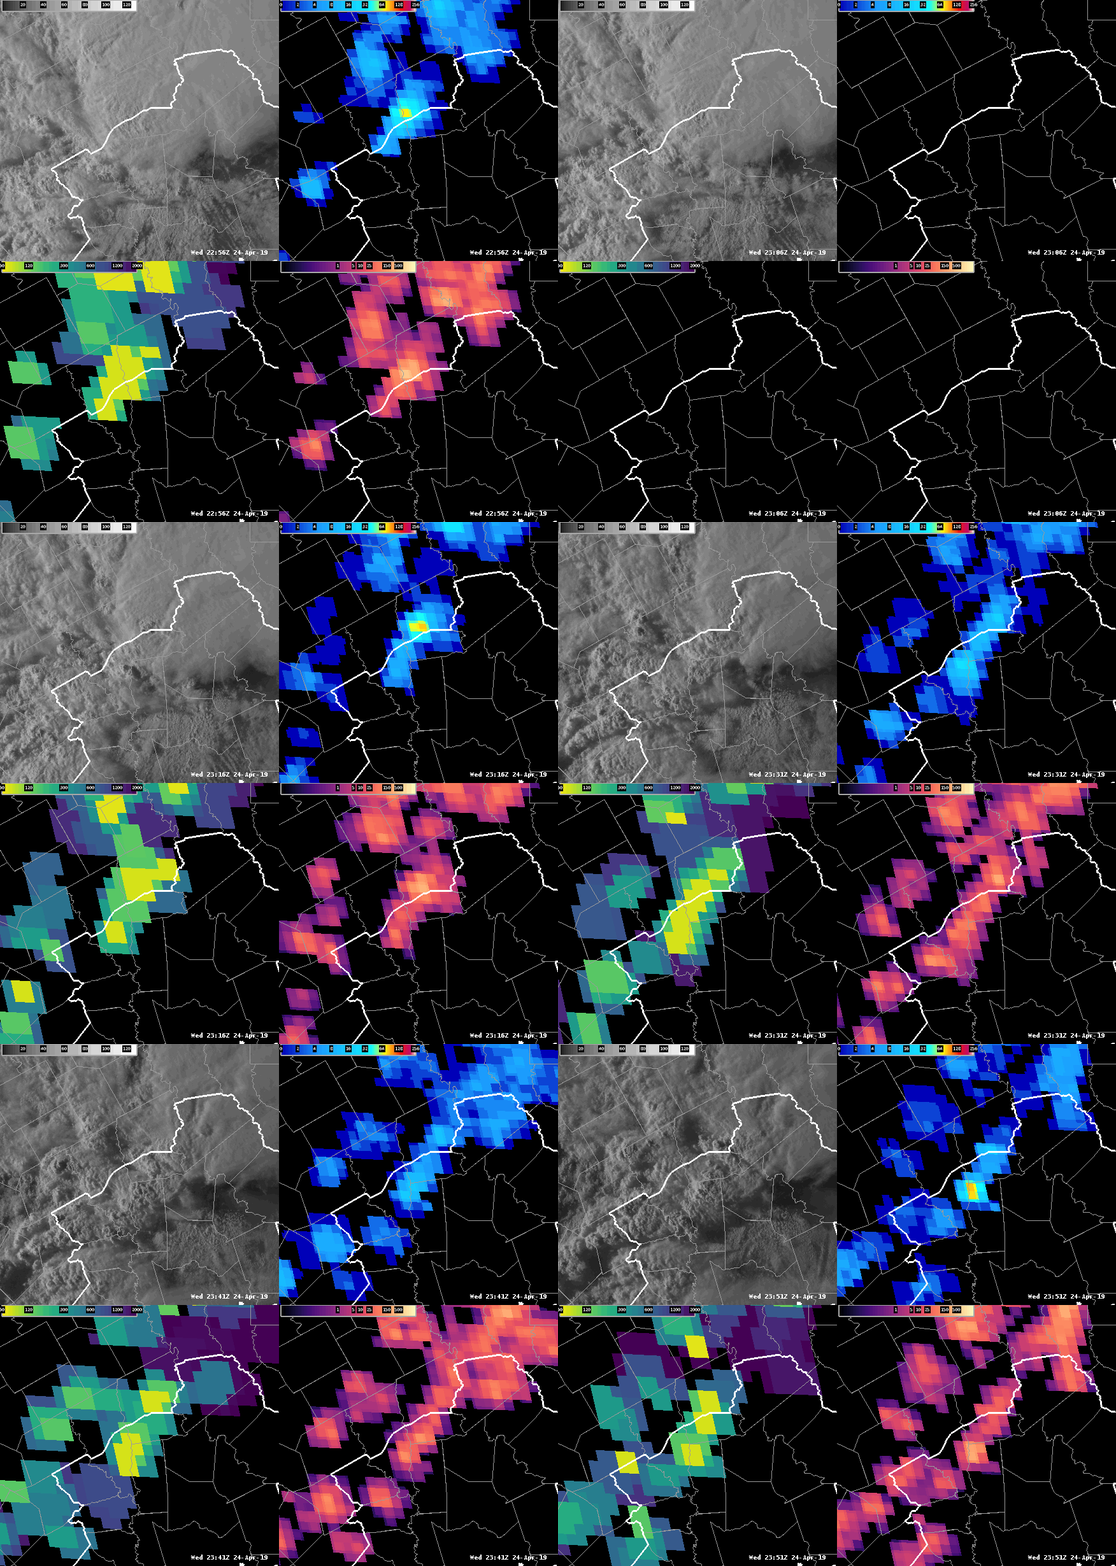
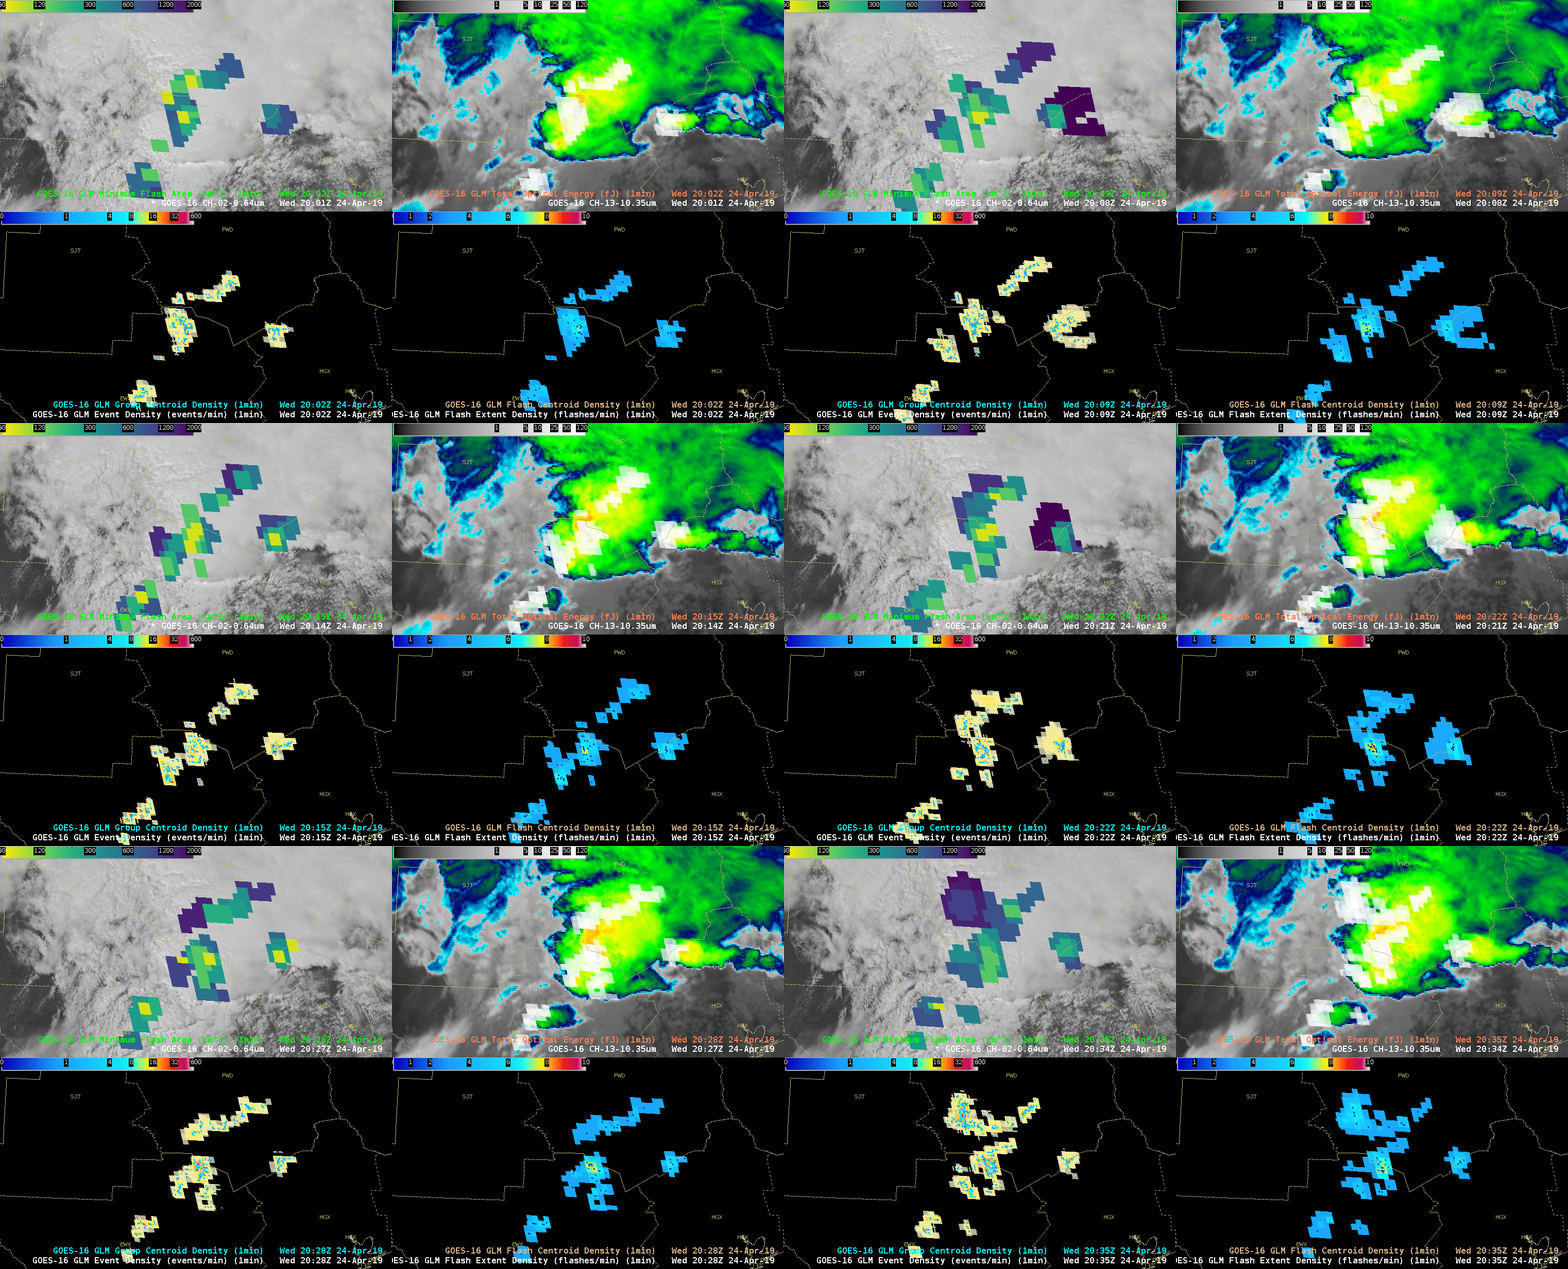
Attention was then turned to how the GLM was observing the evolution of the stronger cluster of storms within the northeastern portion of the CWA. I created a four-panel display, with MFA overlaid onto the mesosector visby imagery (upper left, below), clean IR with TOE overlaid (upper right; I had blinking enabled to capture the highest fJ, but is unseen in this GIF), Event Density with Group Centroid Density overlaid (bottom right, below), and FED with Flash Centroid Density overlaid (bottom right, below). It was fascinating to watch how the lightning unfolded with this particular cluster, and the MFA in particular immediately drew my eye to the storms moving toward the FWD CWA border. The smaller flashes began to blossom and expand out, which then had me look at the TOE and density products. The density products ramped up, but what I found the most interesting is that the MFA seemed to give me that initial clue that this storm was in fact tapping into some of the higher instability and allowing for the updraft(s) to intensify.
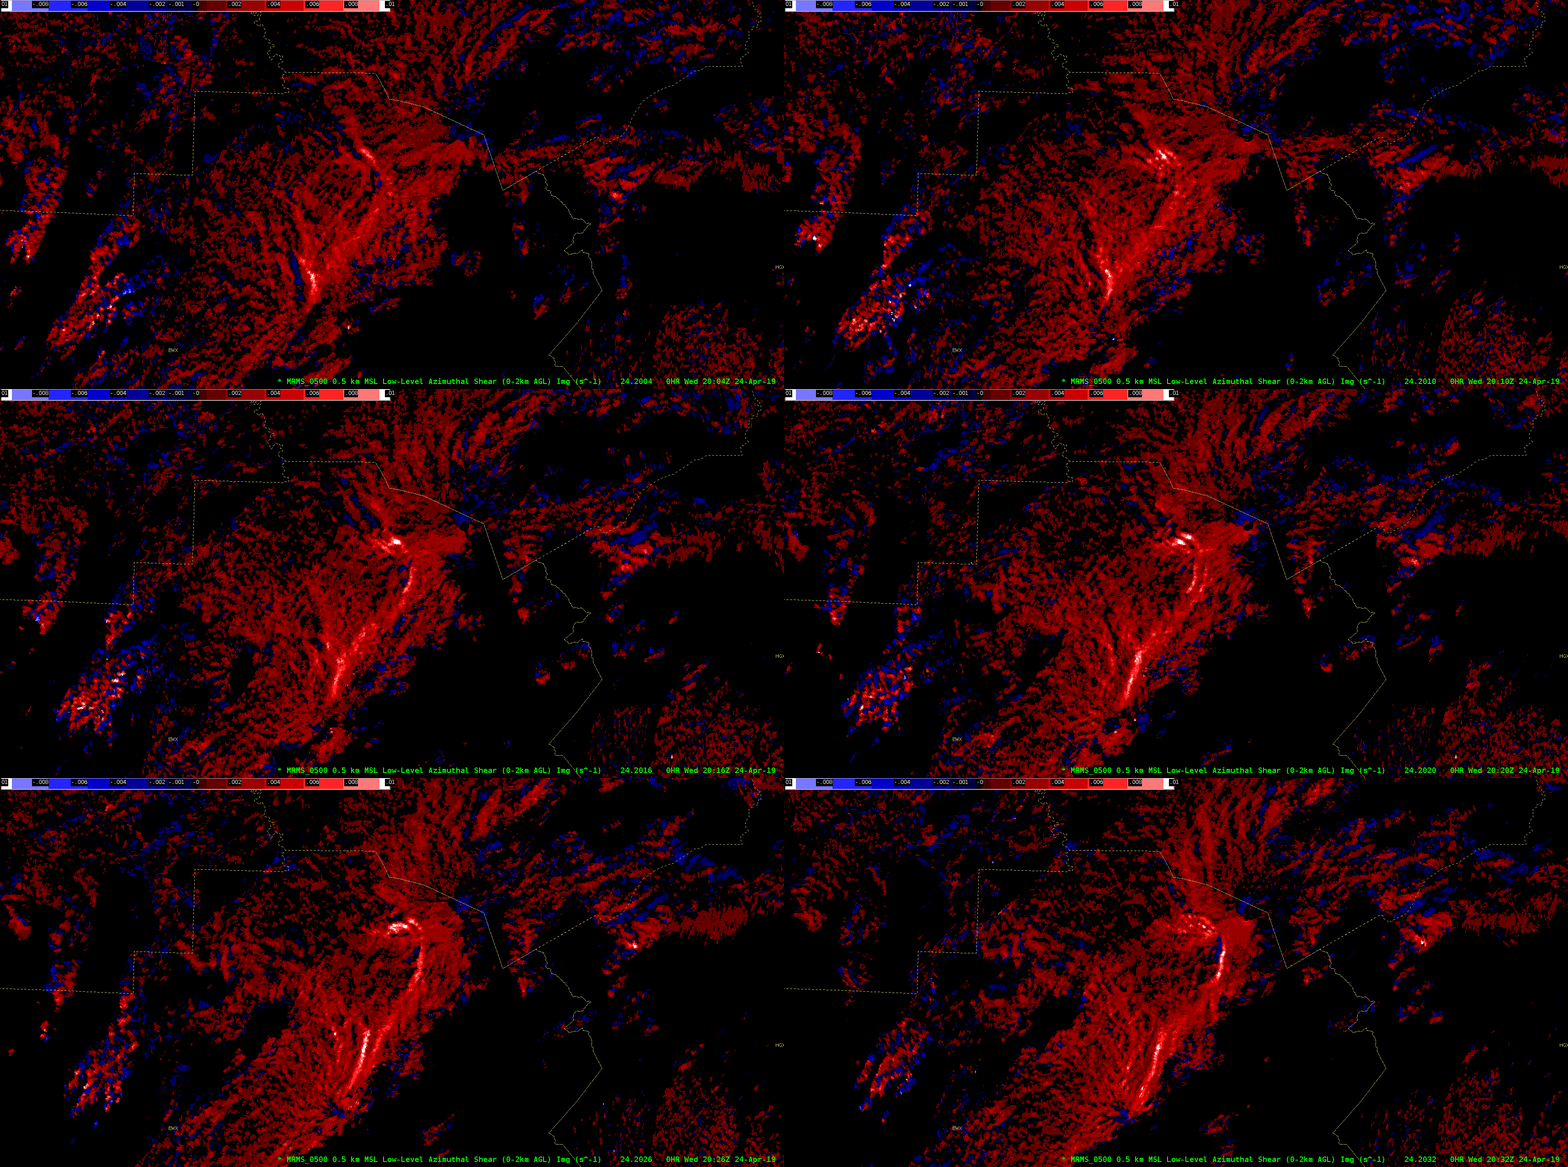
I then proceeded to take a look at the MRMS LL AzShear product (below), wistfully wishing I could look at the single radar version of this product. Sure enough, a clear signature developed, highlighting the amplifying wind within this cluster.
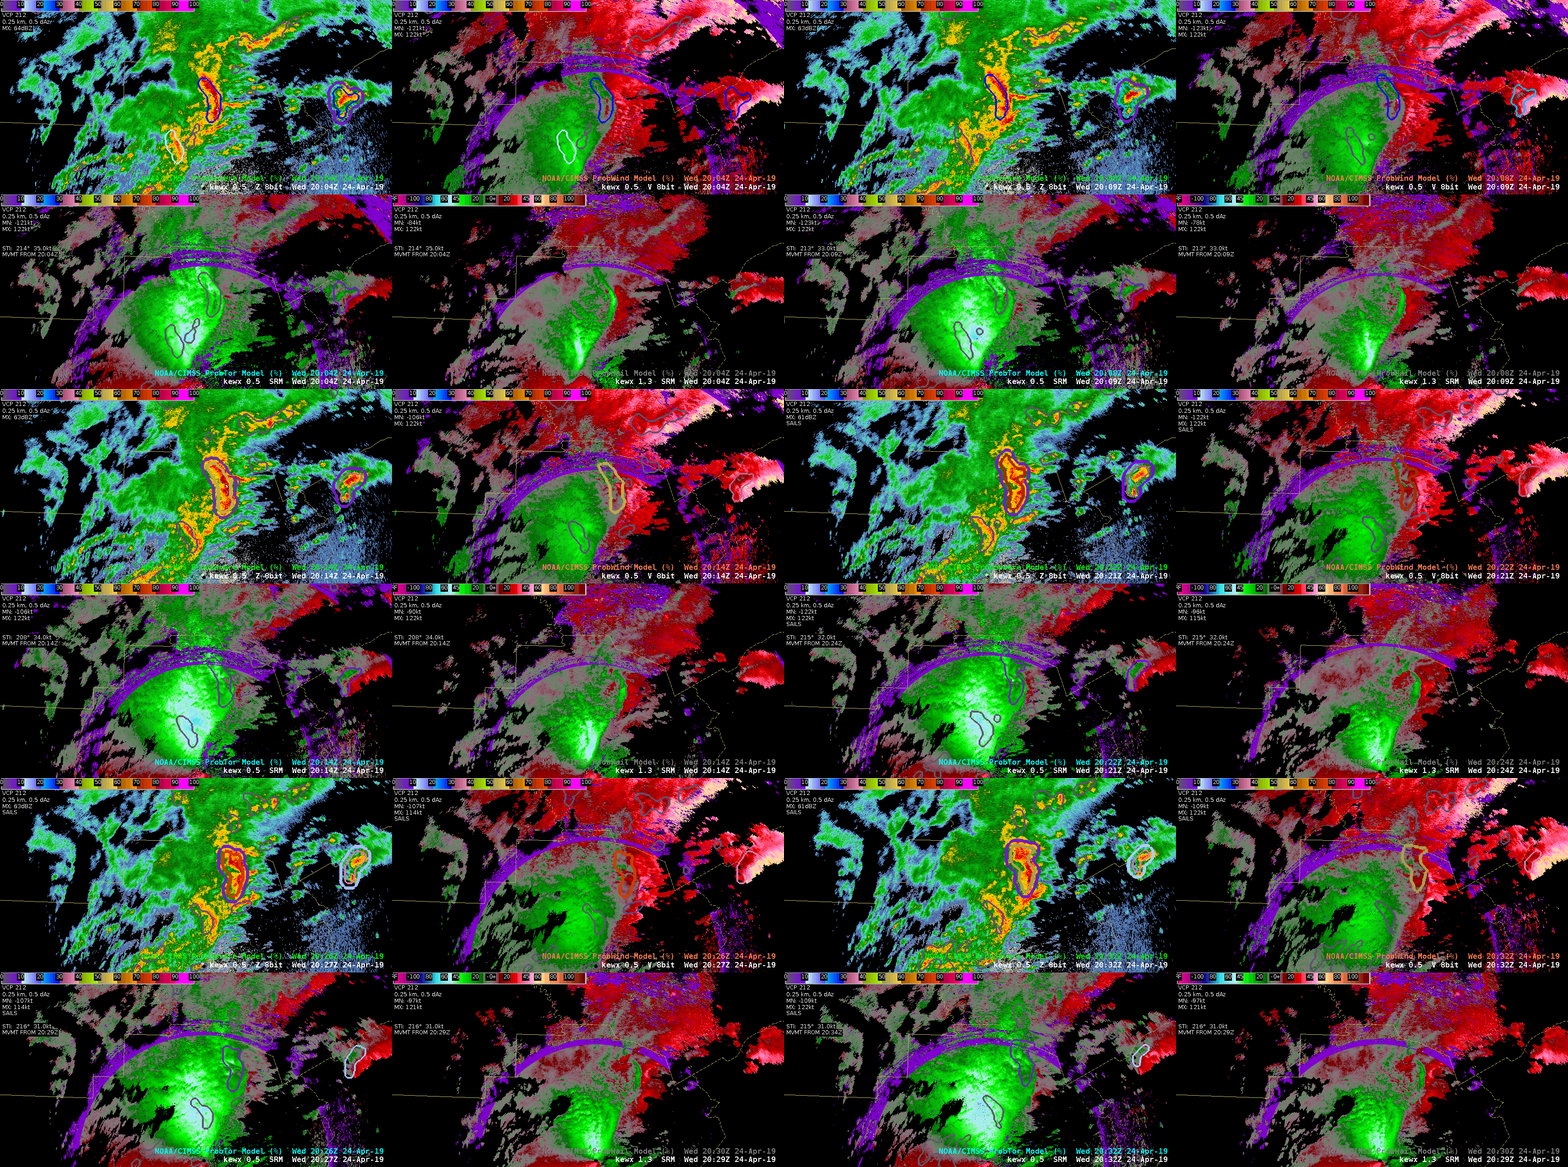
Last but not least, looking at ProbSevere, the ProbWind product picked up well on this signature, highlighted below.
Conclusion: I’m continuing to see some promise that there’s something to look deeper into with respect to these additional lightning products, particularly the MFA when used in combination of something like the Event or Flash Extend Density products. There seemed to be a good correlation with the TOE, as anticipated, but I’m still unsure about its utility as a stand-alone product. As for the Average Flash Area, I didn’t even pull it up given the limited amount of screen space I had and what I saw yesterday, with the AFA in particular not giving me hope of being able to gather good info/lead time in comparison to the MFA.

~Gritty

Side note: Had some excellent conversation with the GLM expert in the room and as we were talking and analyzing some of these products, it was noticed that there was quite an extensive channel, lightning that shot out well to the north of this cluster of focus. These GLM products could provide beneficial information when providing DSS to partners, such as letting partners and the public know not to go back outside just because there’s either light rain or the storm had already passed.