NUCAPS Modified vs. Non-Modified

With an afternoon pass of NOAA 20 there are now NUCAPS soundings over our active area of MAF and SJT. Looking at the non-modified and modified soundings there are several different things to note. On the image below the raw NUCAPS sounding is on the left and the Modified is on the Right. From this view it may be hard to see the differences, but a few are listed below.

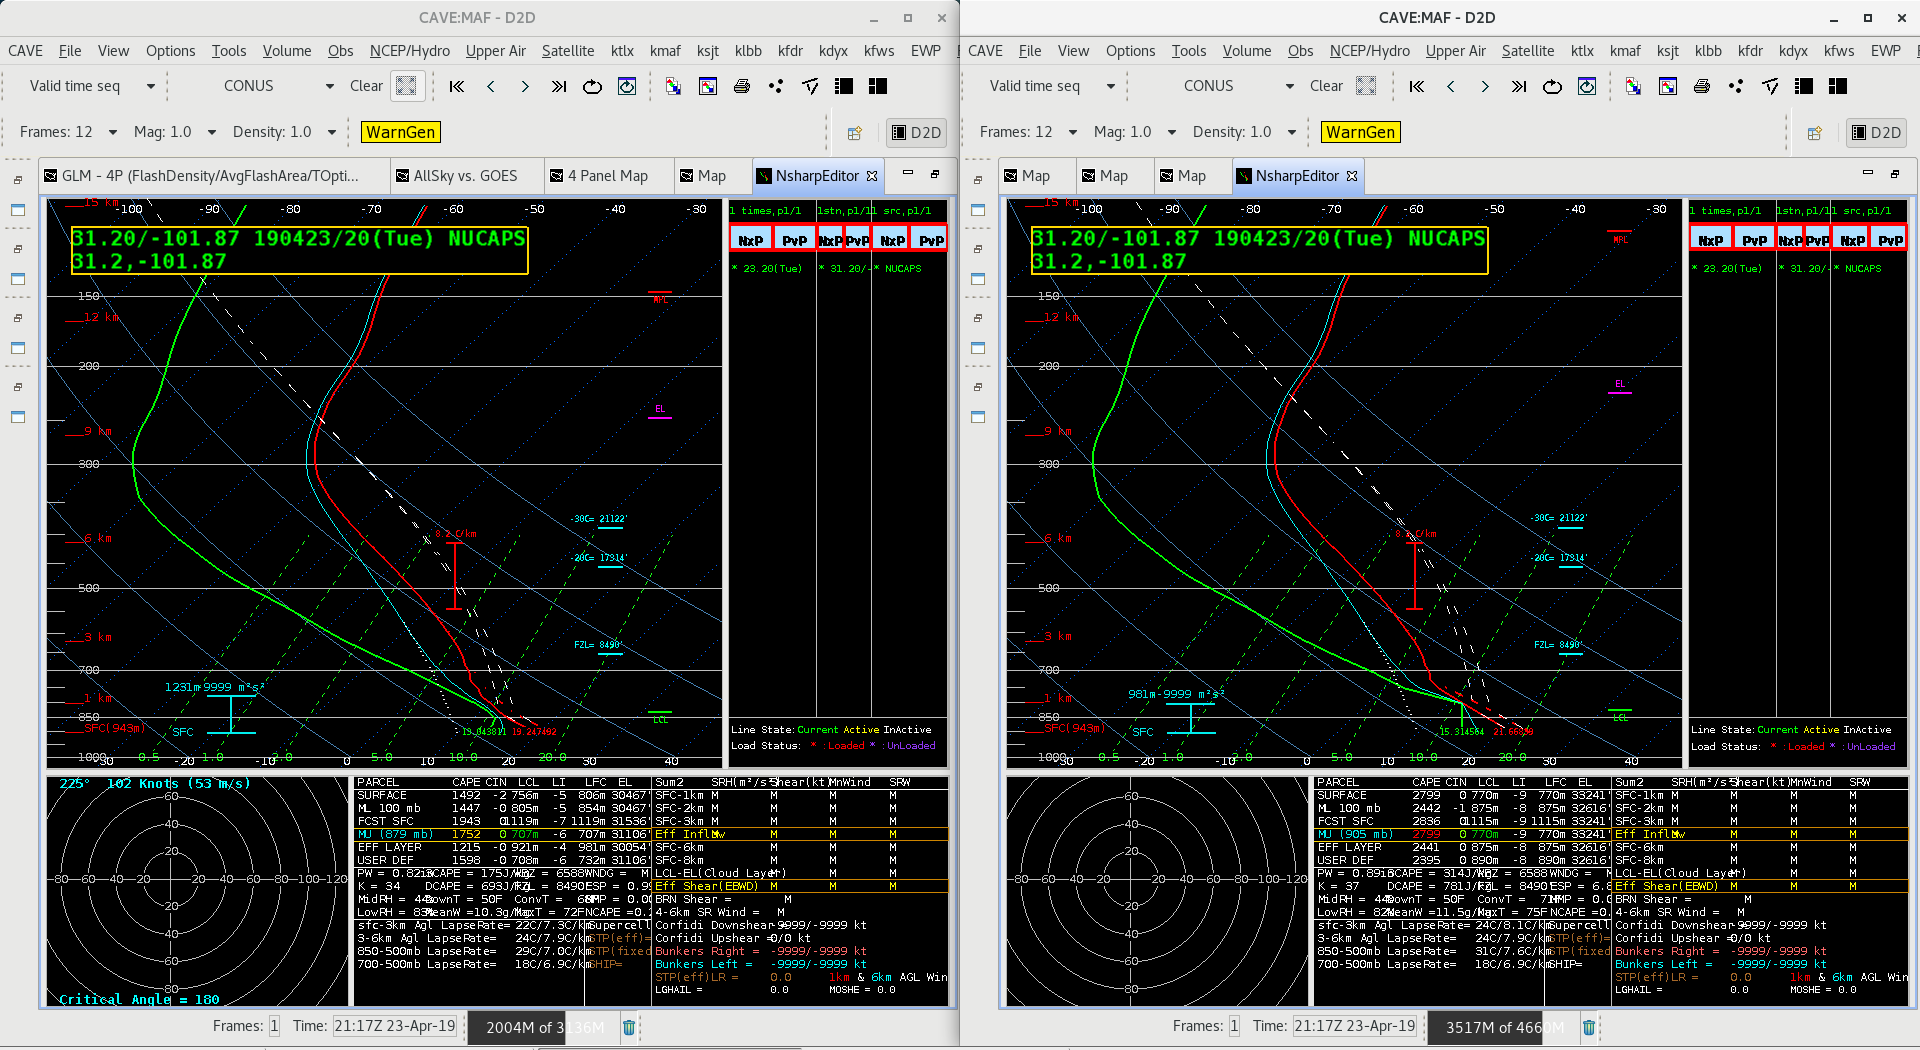
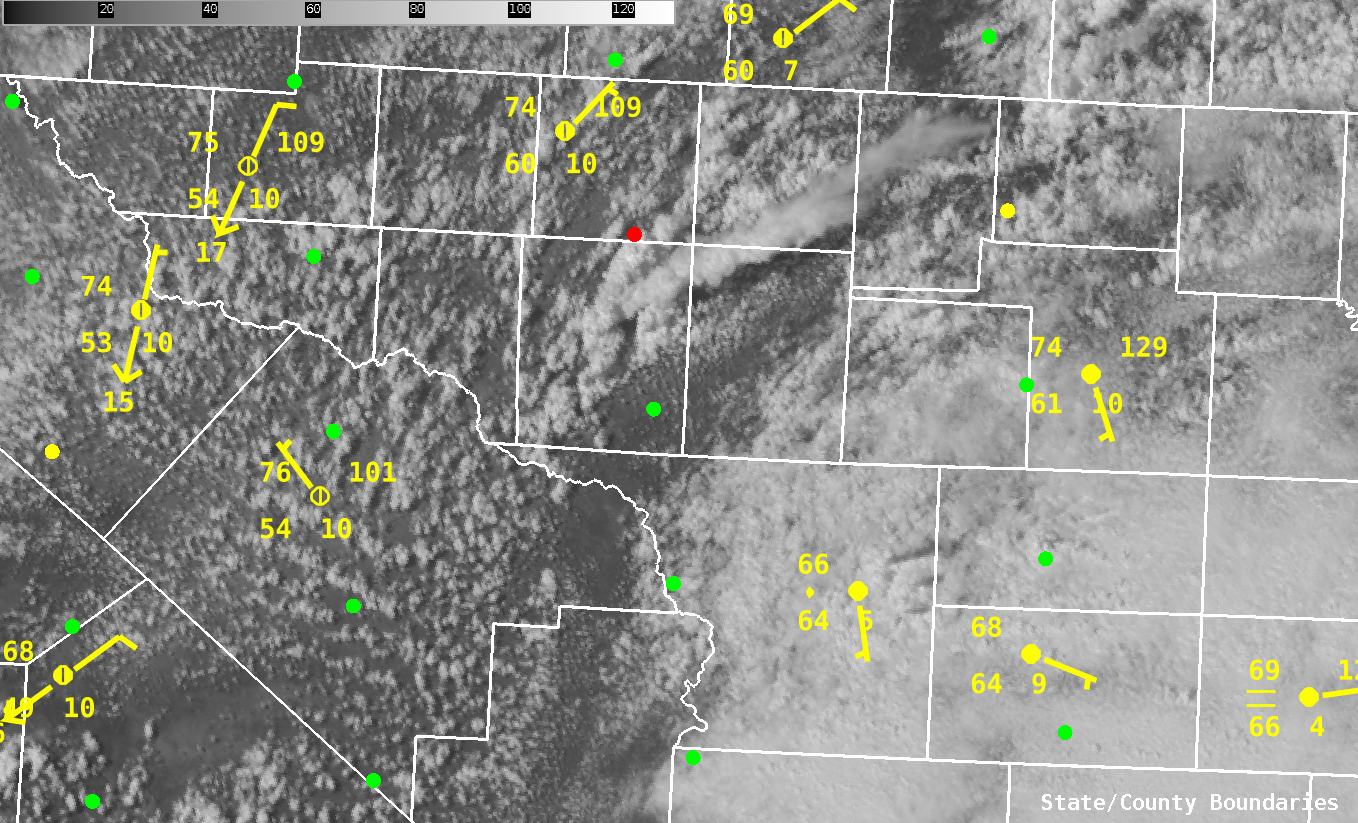
  1. Based on the location of the sounding and the surface observations (the location is the green dot just south of the red dot in the image below) the modified sounding DOES DO A GOOD JOB at the surface. The Modified Sounding has T=71 and Td=60. The non-modified sounding shows T=67 and Td=55. Looking at the surface observations below the modified sounding is more reasonable with Td around 60 and temps in the upper 60s and lower 70s.
  2. Just above the surface though there is some questionable signatures. First it appears the modified sounding assumes that there was a cloud deck around 1km (T and Td almost the same). This is questionable as the visible satellite below does show more clear skies around the point. As that point is right along the front there has been mostly clear skies near that point. How it handles these parts of the mixed layer are more questionable.
  3. These differences to make a BIG difference in the severe weather environment. Most notably CAPE. If you look at the surface CAPE it goes from 1492 in the non-modified to 2799 in the modified. That is significant, especially when these supercells are producing hail. There has been a 2.5 inch hail report to the east of this dot location, which does lend itself to pointing towards larger hail.

-Alexander T.

Minimum Flash Area: Capturing the “Pulse”

Taking a look at the Minimum Flash Area (MFA) product (part of the GLM suite) and comparing it to the Average Flash Area (AFA), my initial analysis leads me to think that there’s more value in the MFA as opposed to the AFA. The MFA, when watching the evolution of a storm in the far northeastern part of SJT’s CWA, shows the pulsiness rather well. The AFA, in comparison, had a washed-out look during the 19Z hour of analysis. I had a side-by-side of the meso-sector VIS satellite imagery with the MFA on top (1-min.) and the ProbSevere suite with radar products, including reflectivity (GIFs below). The MFA provided a few minute lead time over the ProbSevere and reflectivity products of the storm pulsing up. Thought: watching the trend of the MFA could provide some insight into the overall nature of the storm. In this particular case, the smaller flashes were consistent for several frames/minutes, and the ProbSevere/reflectivity core showed an uptick shortly thereafter. Because the smaller flashes remained confined to a smaller area/grid box (<72km^2), this indicated to me that this storm would remain pulsy and likely either sub-severe or low-end severe. Taking a look at what WFO SJT issued during this hour indicated to me that this thought process likely held true. From a mesoanalyst perspective, this could prove to be invaluable information to provide to a radar operator.

~Gritty

Weak Pulse Storm Analysis – GLM

In the below GIF from Top Left to Bottom Right you have:

  • GLM Flash Extent Density from GOES-16 (East) and GOES-17 (West)
  • GLM Average Flash Area from GOES-16 (East) and GOES-17 (West)
  • GLM Total Optical Energy from GOES-16 (East) and GOES-17 (West)
  • ENTLN Ground Based Lightning Detection and GOES-16 1 Minute Channel 2 Visible Satellite.

The animation shows the quick pulse life cycle of the storm – you can watch the updraft grow and then the anvil get sheared off of the storm in the visible satellite. The Flash Density and the Optical Energy show a quick uptick and GLM registers at the same moment the first ground indication shows up. The Optical Energy maxes out as the storm grows to its tallest before the top gets sheared off. The Flash Density seems to follow the progression of the updraft eastward as well. The smallest Average Flash Area also follow the ‘newest’ and/or ‘growing’ parts of the storm. While convection continues from the cell (it is sitting along a boundary across the SE Part of MAF’s CWA), it does weaken (looks like lower tops in visible – could certainly check this in other ways) and you use lightning from all networks.

While there is nothing ground breaking here it does show how GLM handles pulse convection and the trends in the GLM data. The one downside that I would note here is the lack of some sort of downtrend before the storm weakens. It seems the data generally peaks then goes away rather than drops before the storm dies. It is important to note that the coverage of the various products did gradually decrease (went from several pixels, to two, then none) as the storm weakened.

-Alexander T.

Precipitable Water Overview

Looking at the different precipitable water (PW) products available in the HWT and doing a quick overview the All-Sky products provides a great first guess to fill in the PW where it is cloudy. Both the Merged TPW and the All-Sky take the first step in filling in where there are clouds. The image below  shows the sheer volume of data that isn’t available due to the pesky cloud cover. The 4-Panel to the left shows the All-Sky PW and CAPE on top vs. the raw derived PW and CAPE from GOES-16. On the right you can see the visible satellite and the All-Sky mask showing that most of the data, especially over Texas and Oklahoma is raw GFS (gray areas) at this point.

Looking at the Blended TWP vs. the All-Sky there are significant differences over north Texas and Oklahoma for this time frame. The BTWP product “is not forecast model dependent. ATPW uses  GFS model winds to advect the microwave retrievals and the GOES-16 component uses GFS in its TPW solution.” You can see where the blended product (big window below) only shows about 0.75 in PW, while the All-Sky is showing 1.25 in. across the Norman WFO. This can make a big difference when looking at rainfall forecasting and trying to assess just how much moisture in the atmosphere is over an area. In this case would certainly lean towards the All-Sky and then compare the information to other model soundings (from the HRRR, NAM, ECMWF, etc.) and to actual Upper Air soundings to see how the areas populated by the raw GFS are doing.

-Alexander T.