BIS: 3D-VAR Struggling at Long-Range from Radars

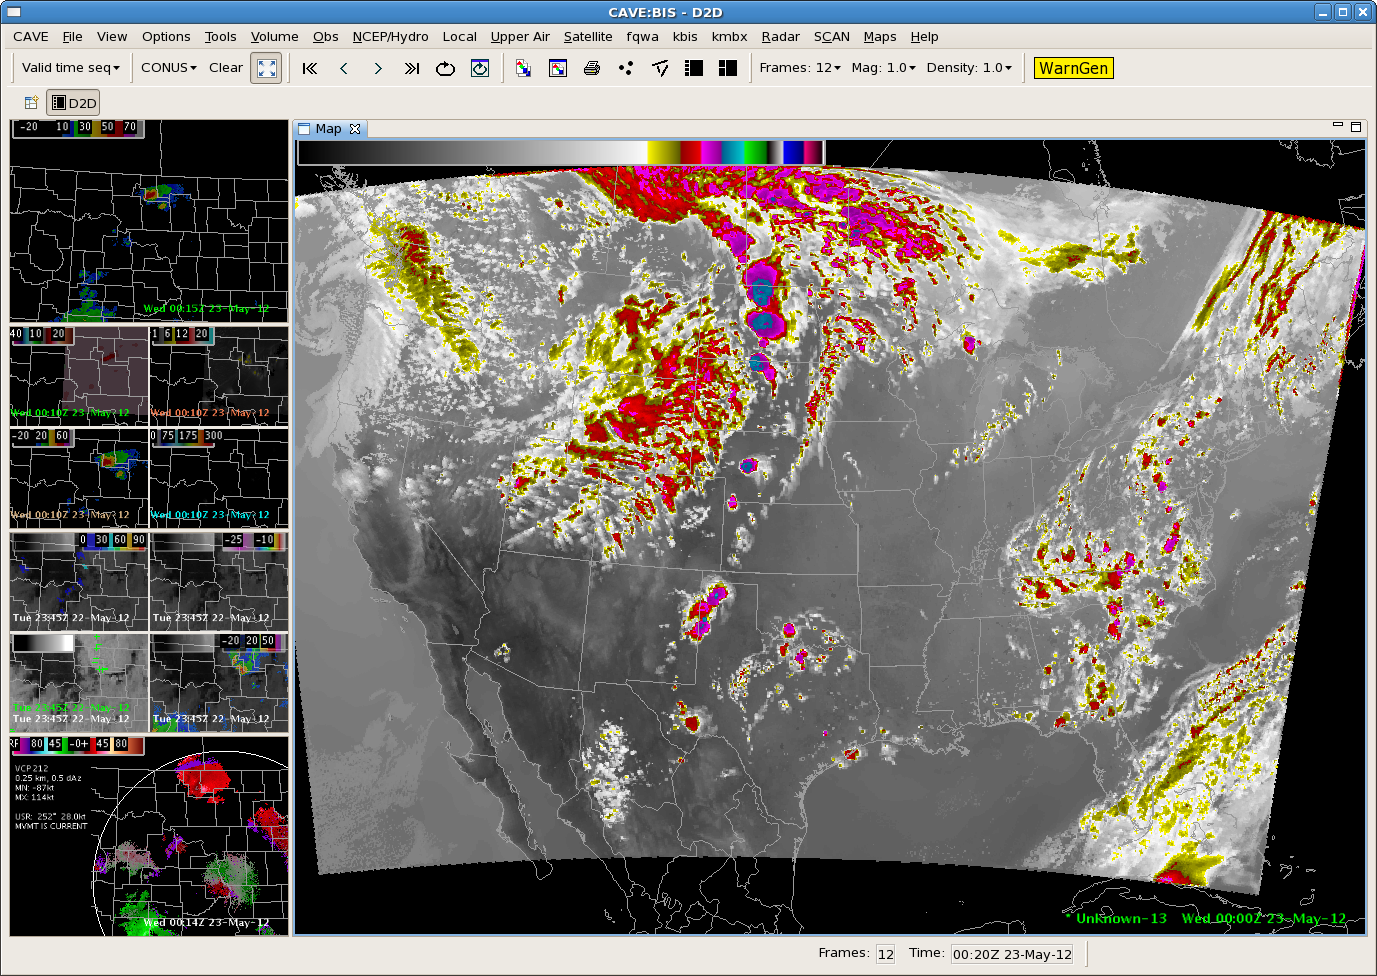
As would be expected, 3D-VAR struggles at greater distances from the radar.  A fairly large supercell thunderstorm that had a history of producing brief tornadoes was at 12-15kft AGL on BIS 88-D’s lowest slice.  It could be implied from base radar products that this storm had a powerful updraft, modest to strong mid-level rotation and strong storm-top divergence.  However, since the storm was too far from the radar, 3D-VAR products such as max updraft composite, updraft helicity, updraft vorticity and max convergence above 8km appeared much weaker than what was likely reality.

KBIS 5/22 2320 UTC 0.5 deg base reflectivity (upper left), max divergence above 8km (upper right), max updraft composite (lower right), 5km updraft helicity (lower left)

WFO-ABR Max Updraft and Vorticity Composites

Several severe hail-producing supercells formed early this evening across northern South Dakota.  Reports of up to golfball size hail were received.  Here, we will focus on some 3DVAR products.

-10C Isothermal Reflectivity (top left), -20C (top right), Composite Updraft Maximum (lower left) and Composite Maximum Vorticity (lower right).

We want to draw your attention to the lower panels (the image was at 00Z).  The panel on the left clearly shows three distinct updrafts associated with each of the supercells.  The panel on the right shows the magnitude of the vorticity associated with each updraft very distinctly.  Let’s look at the next image, 0015Z:

Same as above image, for 0015Z.

Look at the bottom panels again.  You can clearly see the middle and southern storms have merged into one homogenous cell, especially in the updraft image on the left.–Gordon Strassberg for WFO ABR.

ABR-Awaiting Possible Development

There has been little action so far along the dryline across South Dakota so far this afternoon, despite MLCAPE peaking at 2500-3000J/kg and good convergence along the dryline and a possible dryline bulge per the SPC Mesoscale Analysis at 22Z:

22Z SPC Mesoscale Analysis for WFO ABR and vicinity.

Last night’s 00Z NSSL-WRF SimSat product indeed shows some isolated development along the dryline across northern South Dakota close to 00Z:

00Z NSSL-WRF SimSat valid 00Z this evening.

As of 23Z, a few showers have developed across central South Dakota, near the small dryline bulge, but no lightning has been observed yet.

Tags: None

BIS: Another UAH CI Victory

A severe thunderstorm developed over northeast MT and straddled the Canada/ND border.  The cirrus had finally cleared south/southeast of the storm, so we were waiting for one or both of the GOES CI products to kick in.  Sure enough by 22z, the UAH-CI product indicated about 50% strength of signal along developing cumulus to the south of the severe storm.  By 2224z, KMBX radar indicated convection certainly did “zipper down” the cold front/dryline as the UAH-CI product indictated at 22z, giving us a 24 minute lead time for the developing convection.

2202 UTC
2225 UTC

ABQ: UAH CI and UW CTC Victory, 5/22

1745z image indicates developing cumulus over extreme northeast NM.  In the 1830z image, UAH-CI product indicates a cluster of cumulus with a high confidence of convectively initiating.  UW-CTC product also indicates rapid cloud-top cooling with the eastern-most convective element.  Given the deeply mixed airmass with minimal cap, this would lend confidence to convective initiation soon.  Sure enough, by 1915z the 15-minute lightning plot indicates some CG strikes with the eastern-most convective element, with a lead time to convective initiation of over one hour.

1745 UTC

1830 UTC
1910 UTC

BIS: Will Convection Initiate by 22z?

5/22 00z NSSL WRF simulated IR & WV imagery (upper two panels) indicate deep moist convection initiating by 22z over west-central ND, along a strong cold front and ahead of shortwave energy approaching from the west/southwest.  This may be a tad optimistic given dense cirrus over the region, although the moderate/strong forcing may be able to compensate for this.  Additionally, despite some subtle differences, 20z simulated satellite (20 hour forecast) is very representative of realtime GOES IR/WV (bottom two panels), with regard to shortwave placement and magnitude, and overall spirit of dense high level clouds over the region.  

Tags: None

CTC – Hot or cold

Here’s a comparison of the UW-CTC product using the default AWIPS 2 color table (bottom right) vs. a warm to cold color table (upper right). In the upper right image the stronger cloud top cooling rates are displayed as a warmer color, similar to IR satellite color table enhancements that display the colder cloud top temperatures with warmer colors. This has the benefit of drawing the attention of forecasters who are conditions to associate warmer colors with more extreme values (ie, radar data).

Tags: None

West Texas CI

Small area of cumulus developing over higher terrain in west Texas shows high strength of signal value on the UAH CI product at 1730z:

This area continued to develop into a mature CB, with the first cloud to ground lightning detected by NLDN at 1945z – a 2 hour lead time from the first CI signal to the initial cloud to ground lighting activity.

Tags: None