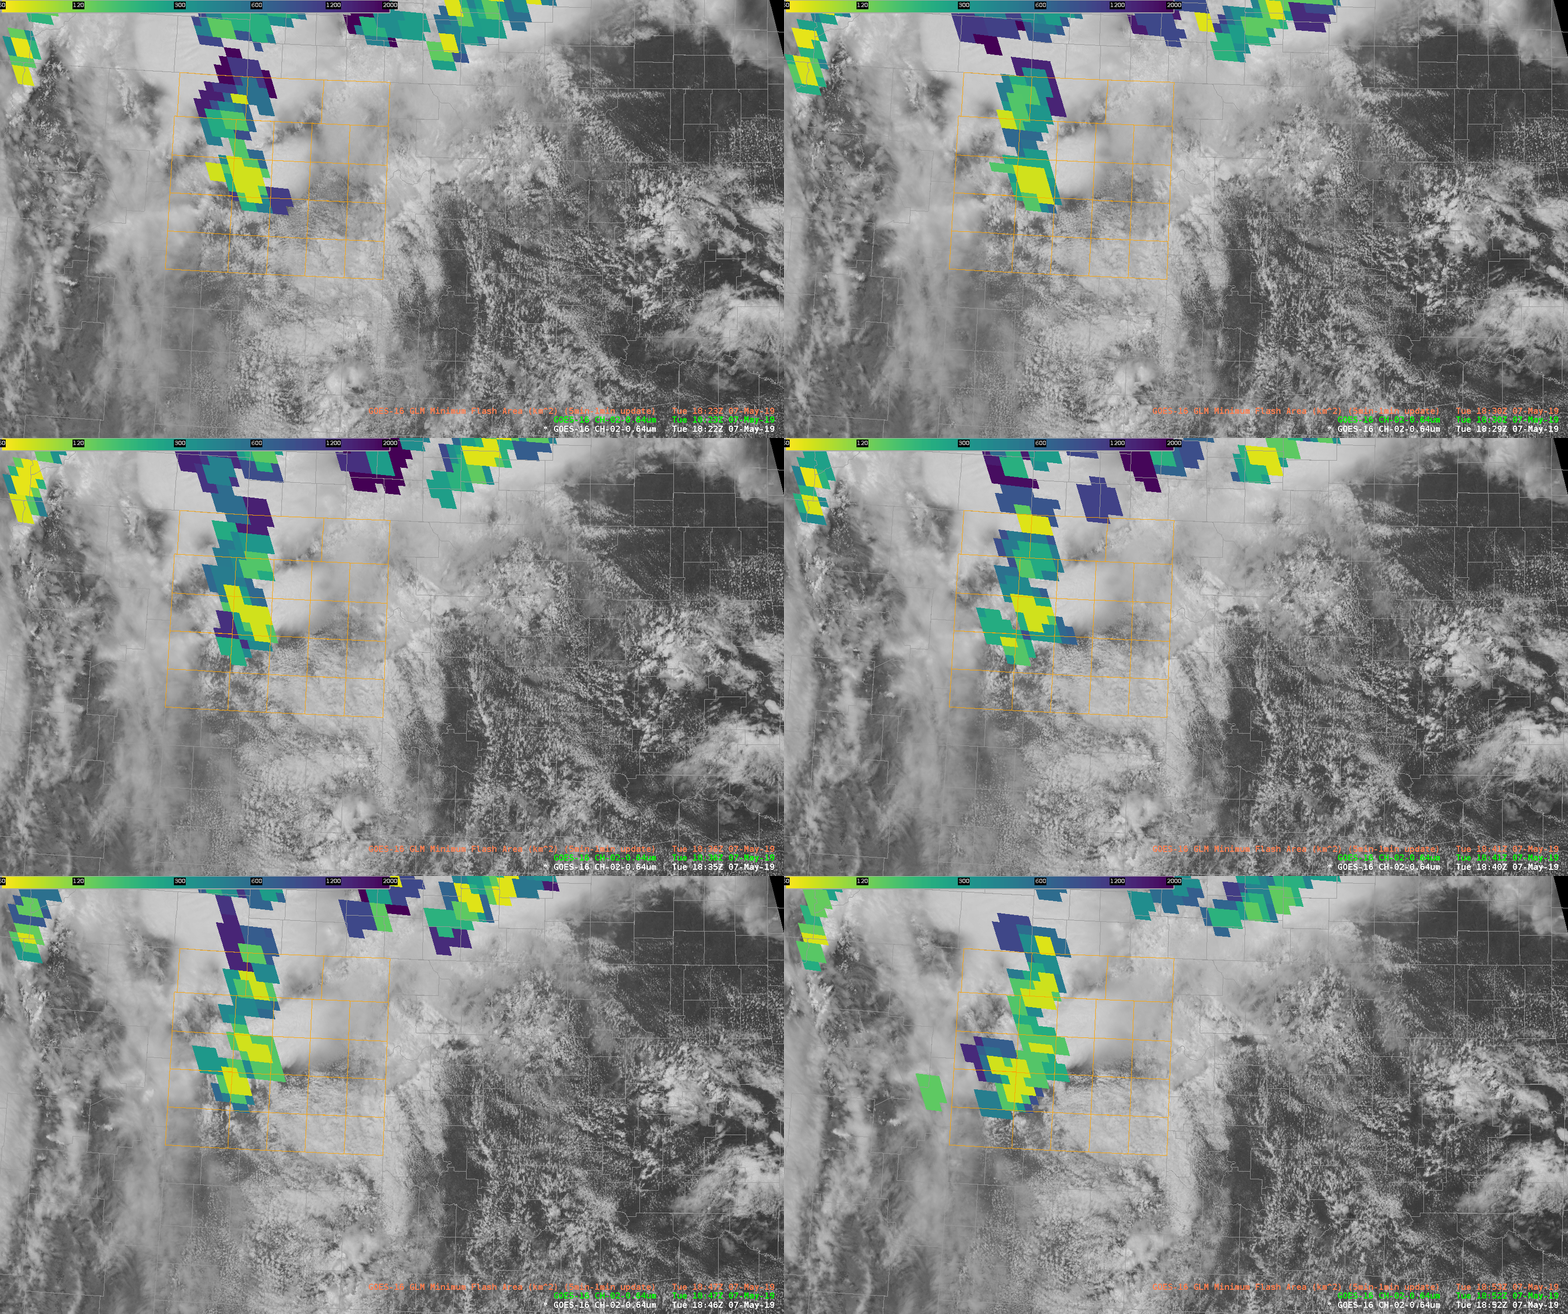
5-Minute with 1-Minute vs. 1-Minute GLM Min Flash Area

So, the first thing looking at today is the best way to display Minimum Flash Area.  This is a nice addition to the Flash Area products and seems to have some utility in displaying the state of convective growth.  As a reminder, smaller flashes are usually indicative of new or strengthening convection while larger flashes are mature/decaying/sustaining stages of convection.  This will come in handy with a lot of convection to see which cores may be the strongest in any given area.

The problem is the best way to view this information; the 5-minute with 1-minute updates seems to have worked well in the past for most of the GLM data but seems to cause some problems with the Minimum Flash Area.  Case in point, here is a 4-panel with the 5-minute/1-minute update from the Texas Panhandle north of Amarillo (TL – Flash Extent Density, TR – Minimum Flash Area, BL – Total Optical Energy, BR – empty; note, non-default color tables on the top row!):
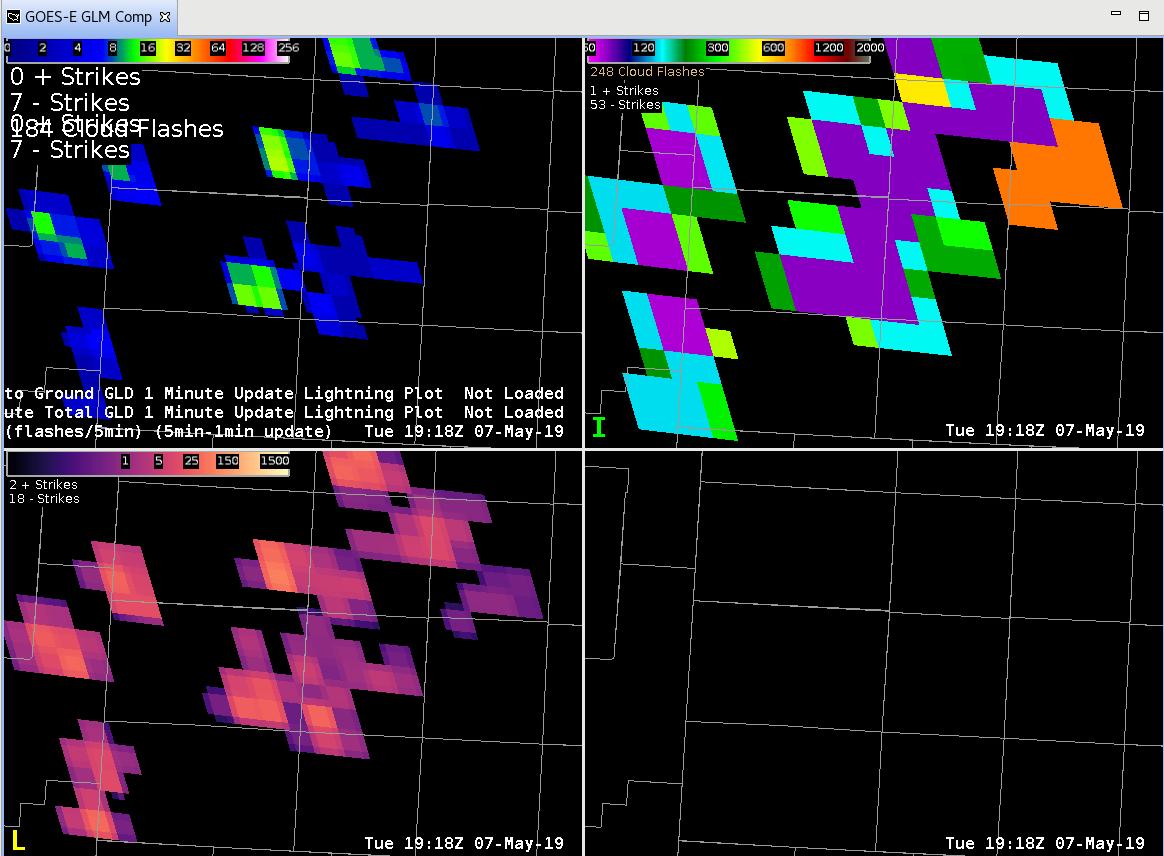
Wow!  That’s a pretty large area of small flashes (purple).  BUT, it’s a total from the last 5-minutes so storms could have moved, strengthened, weakened, dissipated, etc. in that time.  What does the “regular” 1-minute plot look like?
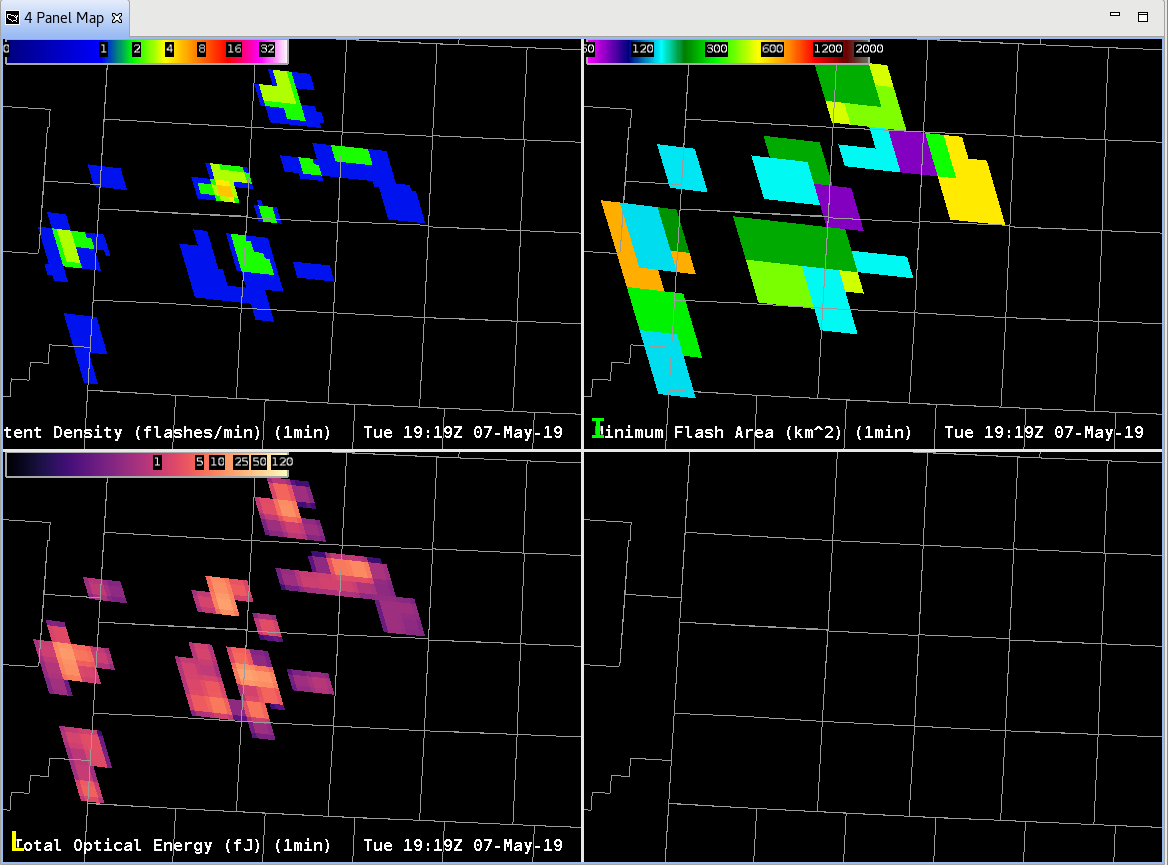
Huh?  Where did all the small flashes go?  Well, the small flashes (purple) in this case are likely where the GLM is seeing the strongest updates in the last minute, not the last 5 minutes.

Something to consider when looking at rapidly developing convection, storms that are moving fast, or storms that are pulsing with rapid time intervals; the 5-min with 1-min update can mask important details when it comes to storm electrification!

-Dusty
 

Early Detection from different radar

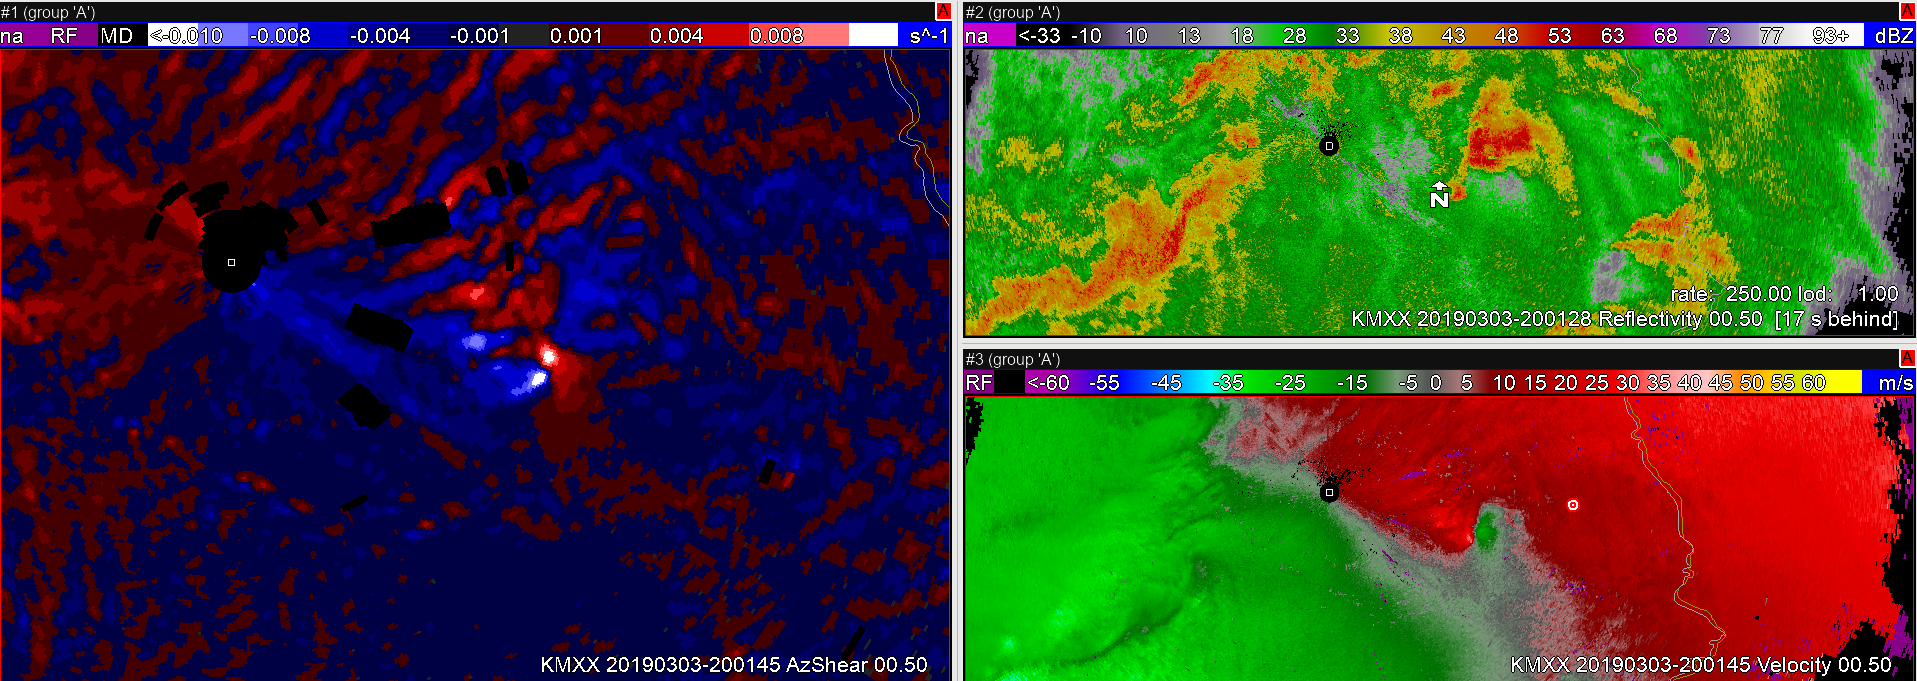
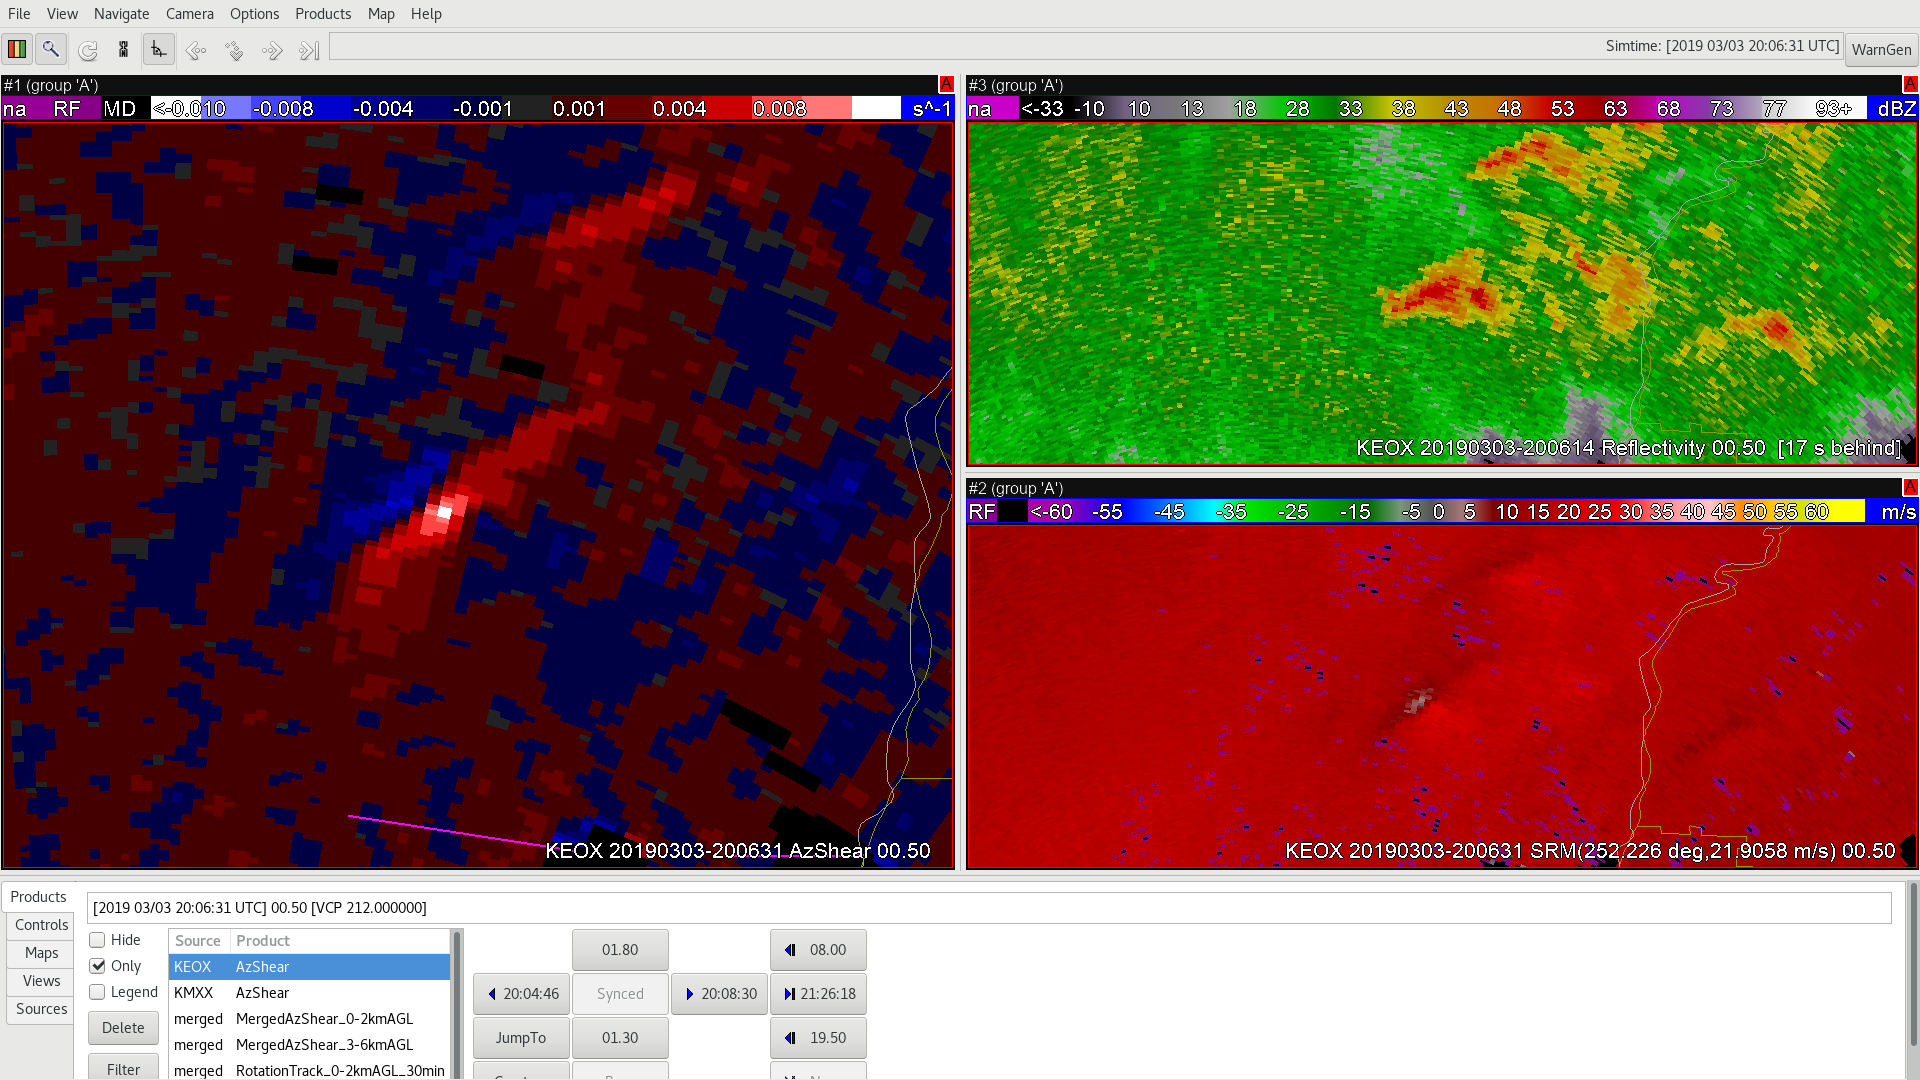
Here’s a case for loading data from a different radar, if possible. Over an hour before this seemingly innocuous cell produced a tornado, KEOX AzShear picked up on this, whereas there was not much to look at with KMXX shear. Also not that SRM was not as helpful in early detection as AzShear as well from KEOX.

ZDR_Arcophile


GOES All Sky LAP TPW and CIRA Merged TPW Cloud Mask Differences

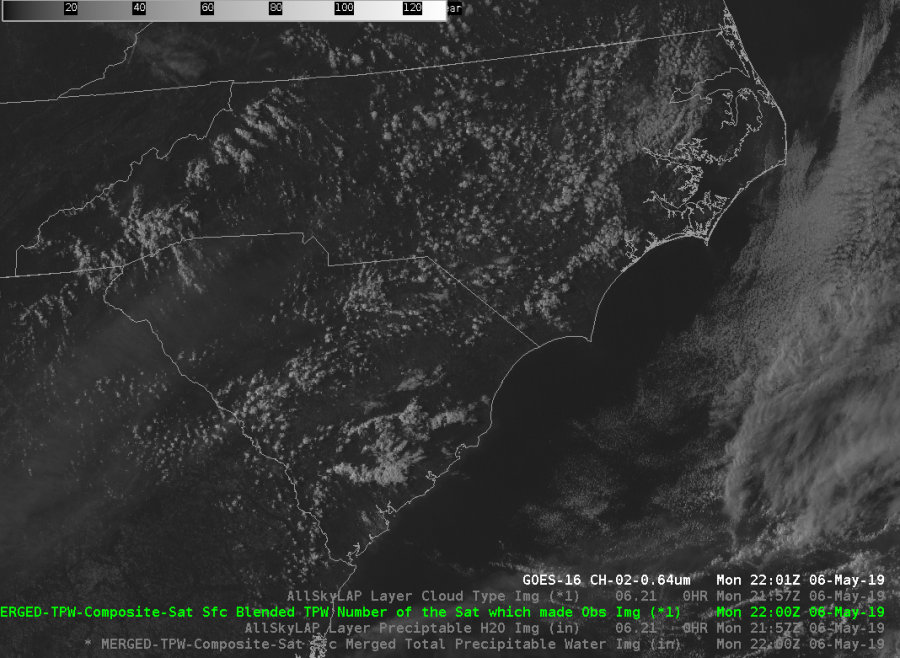
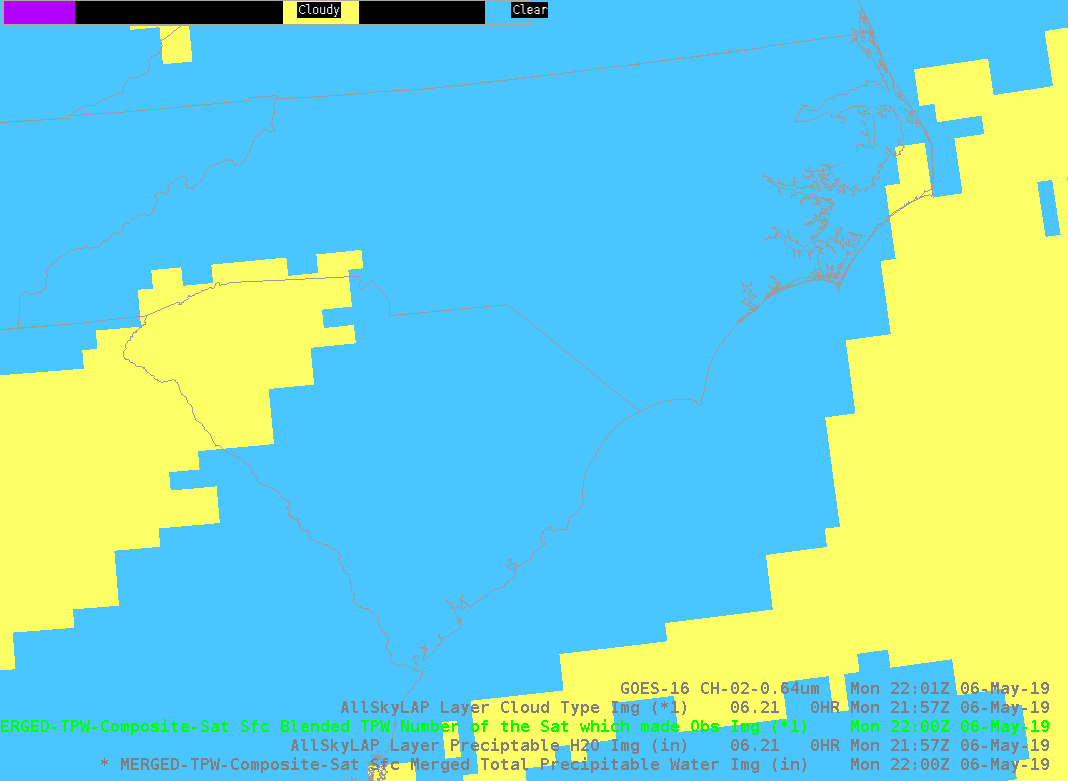
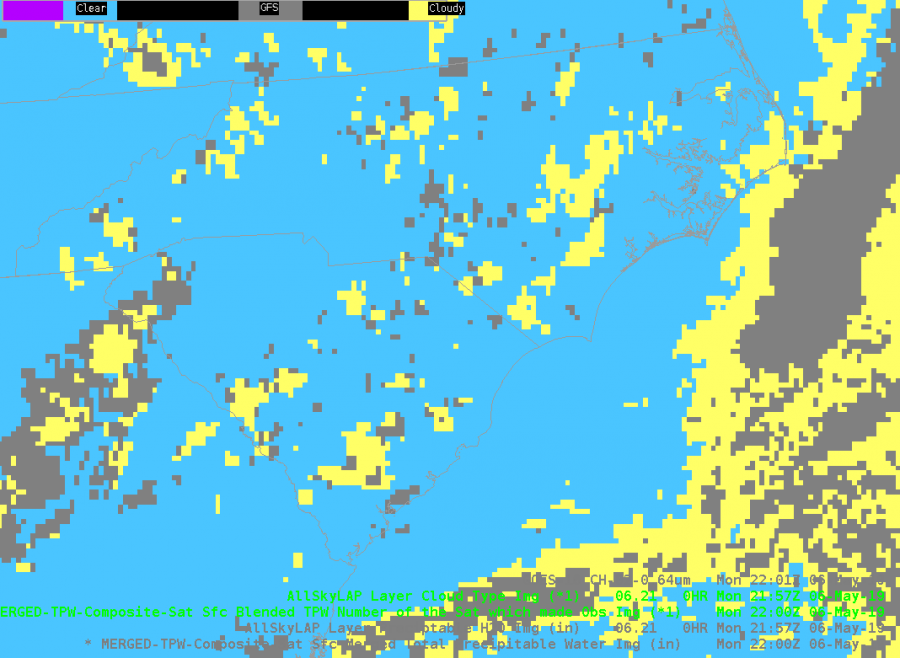
At 22 UTC on 6 May 2019, the All Sky LAP and CIRA Merged TPW Data type products show differences in the cloud mask.  A shallow Cu field over NC / SC is indicated in GOES visible imagery,.  The data type masks of the two products (blue = clear; yellow / gray = clouds) show some clouds in the All Sky LAP mask, while the CIRA Merged TPW mask does not have these Cu detected.  This is likely due to the lower resolution (~ 15 km) of the GOES-16 TPW data used in Merged TPW versus the All Sky LAP resolution.

GOES-R TPW has a nominal resolution of 10 km.

JohnF


Usefulness of AzShear at the Beginning of a Shift

As a forecaster in the Pacific Northwest, where severe weather tends to be limited, I have had to adjust my perspective of what is/isn’t a strong storm. Most of our tornadic storms tend to be cold core funnels that dissipate as quickly as they develop. I can see AzShear being used as a powerful situational tool for forecasters, especially when storms that have weak rotational signatures.

The image below is relatively close in time to when the simulation started and my eyes immediately went to the “hot spots” in the single-radar AzShear product. It took me all of a couple of seconds to realize that I needed to pay attention to this storm and as soon as I looked at the Z/R products I immediately started thinking that we need to issue a TOR if one wasn’t already issued. This storm is probably a “No Duh!” TOR for almost all forecasters, but being able to see the AzShear product and quickly orient yourself is extremely useful and  when used with other base products can save time in spinning up at the start of a shift.

Quick MDA, DMDA, NMDA Comparison

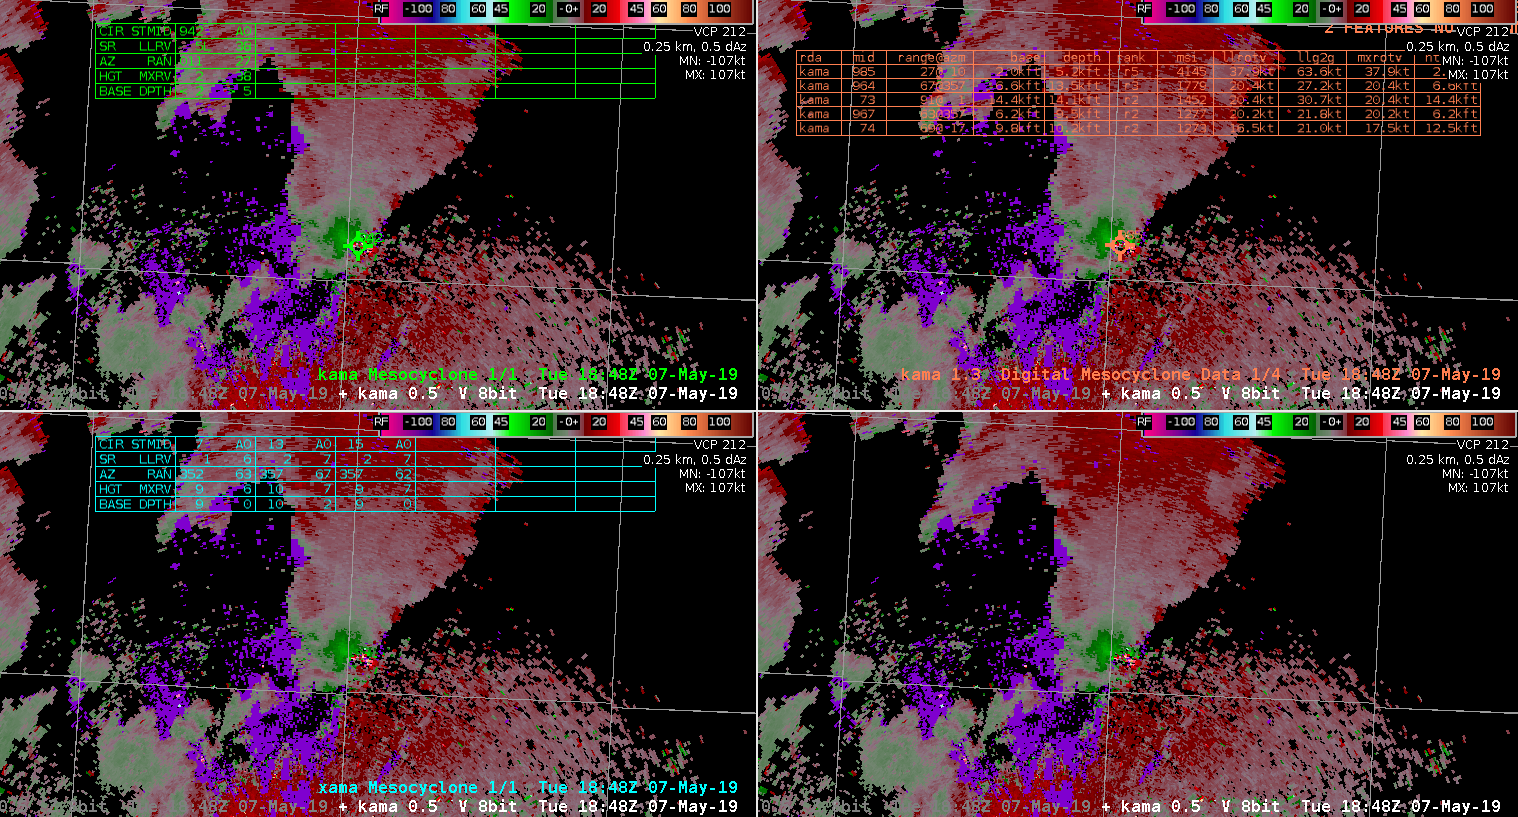
Quick comparison between the MDA, DMDA, and NMDA showing that the MDA and DMDA had marked an area in AMA’s CWA, yet the NDMA did not. However, two minutes later the NDMA finally caught on and highlighted the same area.

AzShear useful for short-lived tornado

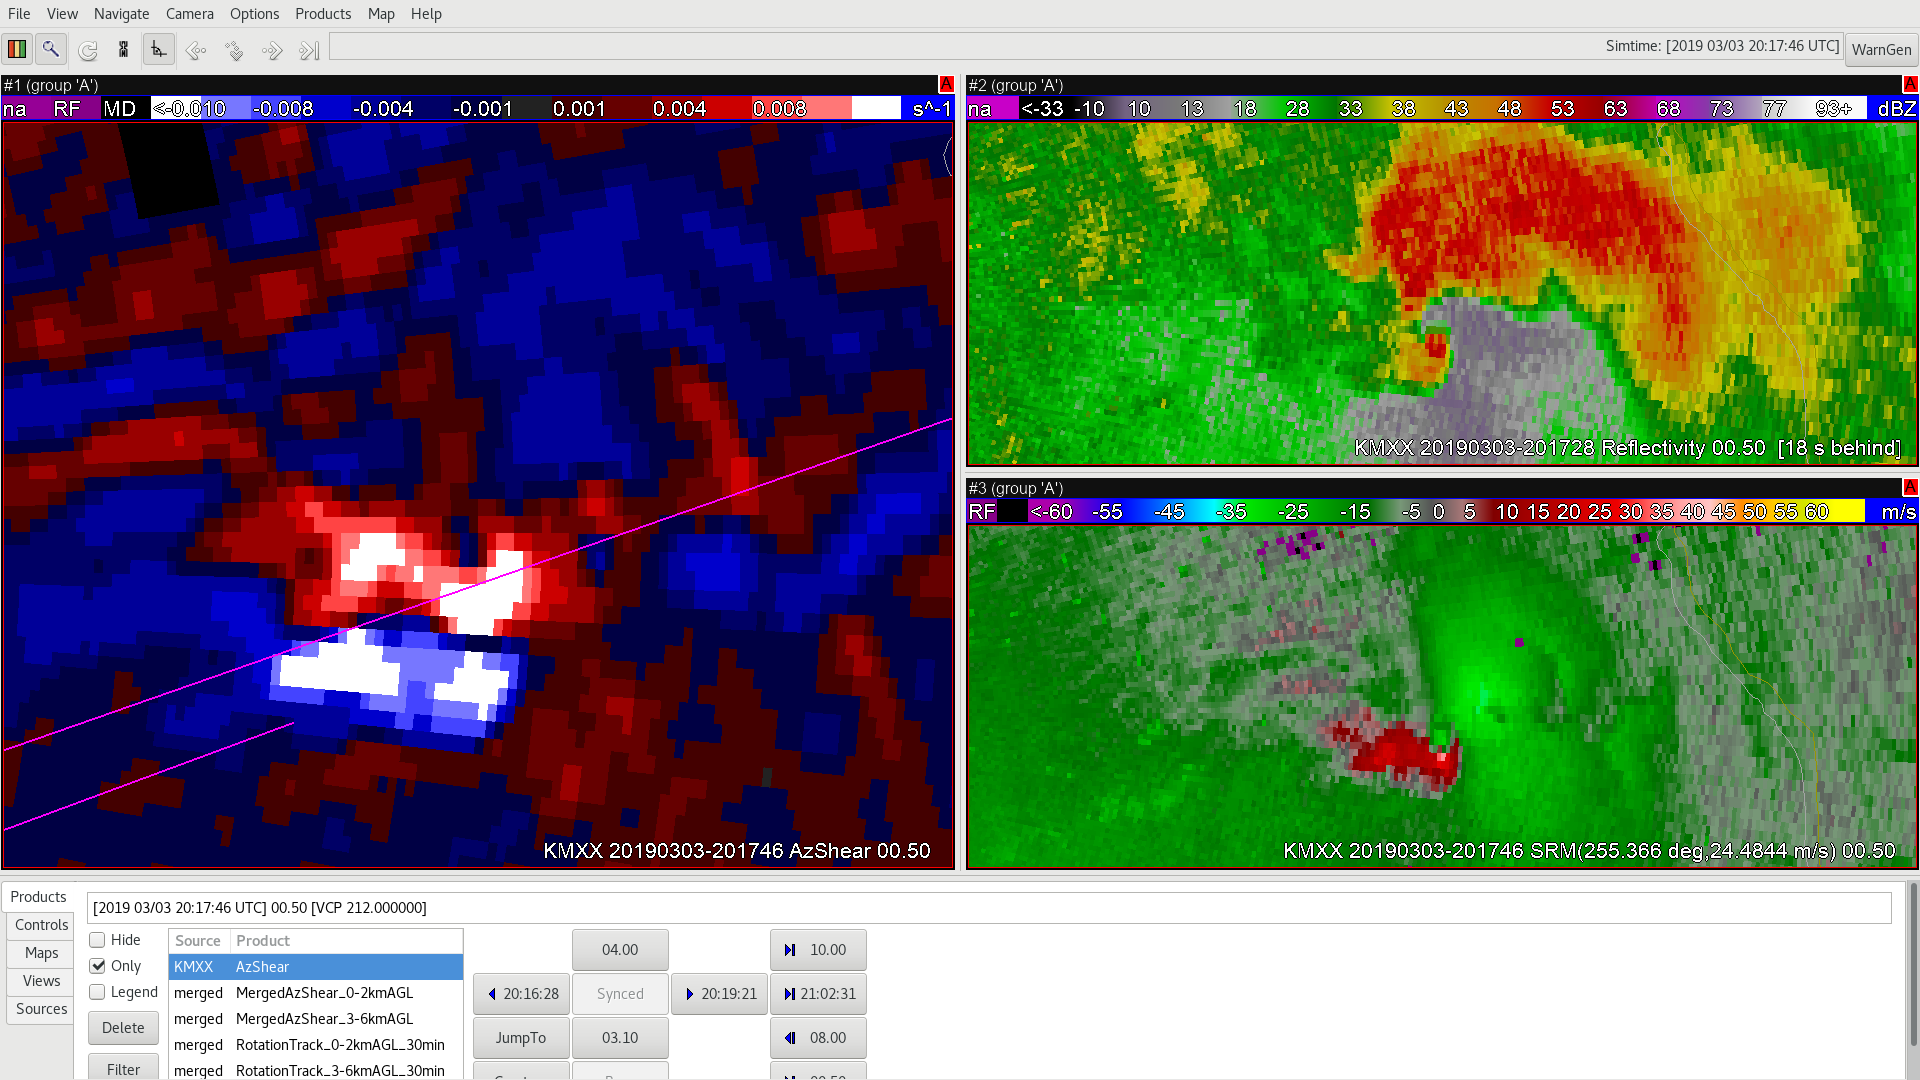
An example of AzShear for picking up on a weak circulation that later produced a short-lived tornado. This looks quite messy in reflectivity, with a weak circulation showing up on SRM. AzShear directs my attention here, and rightly so.

ZDR_Arcophile

Early Detection of Convection w/GLM

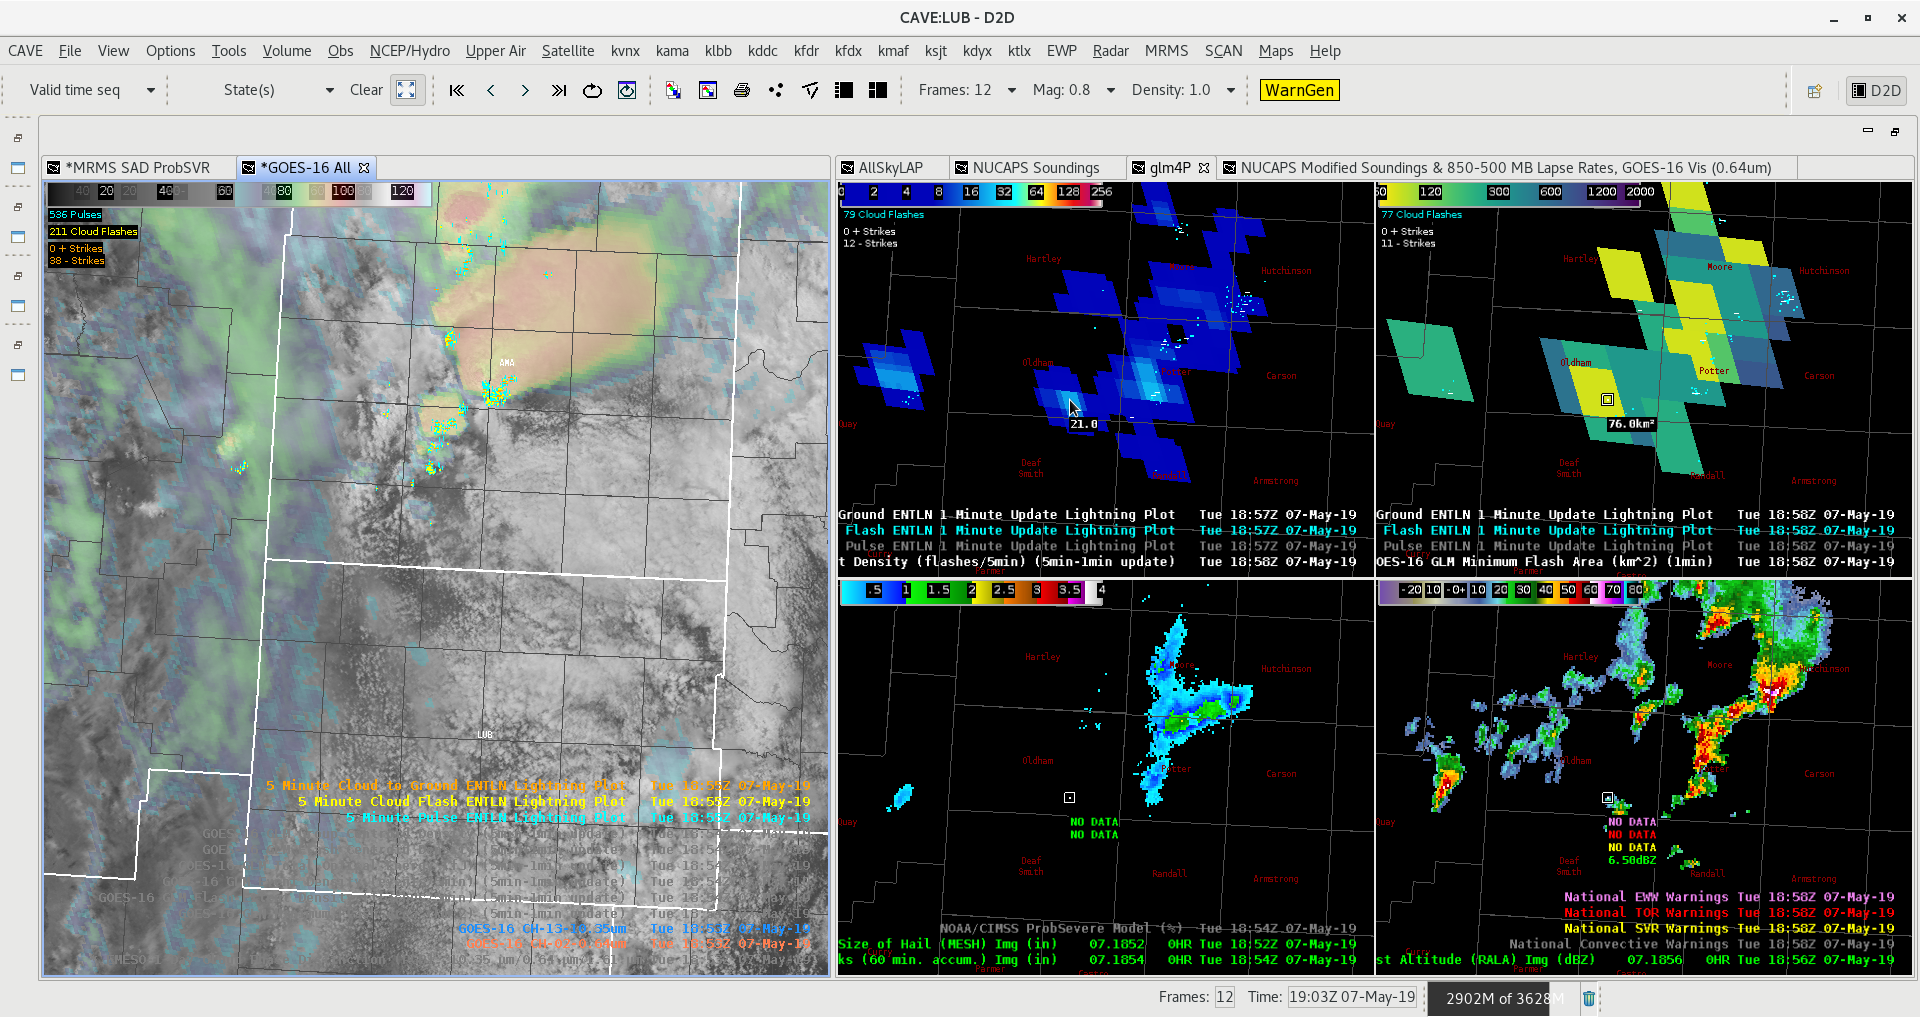
Impressed by the early convective detection by GLM in this case. The image below was in real time and you can see the GLM Minimum Flash Area and Flash Extent Density is already lighting up in Oldham County in the AMA CWA. However, the 1-minute MESO GOES-16 data barely had cooling cloud tops being detected and there was no detection of precip at that location on MRMS yet (actual first time of detection was 2-minutes sooner than picture below where MRMS has no detection of radar echoes).

#ProtectAndDissipate