19Z NUCAPS Comparison with METAR at LUB

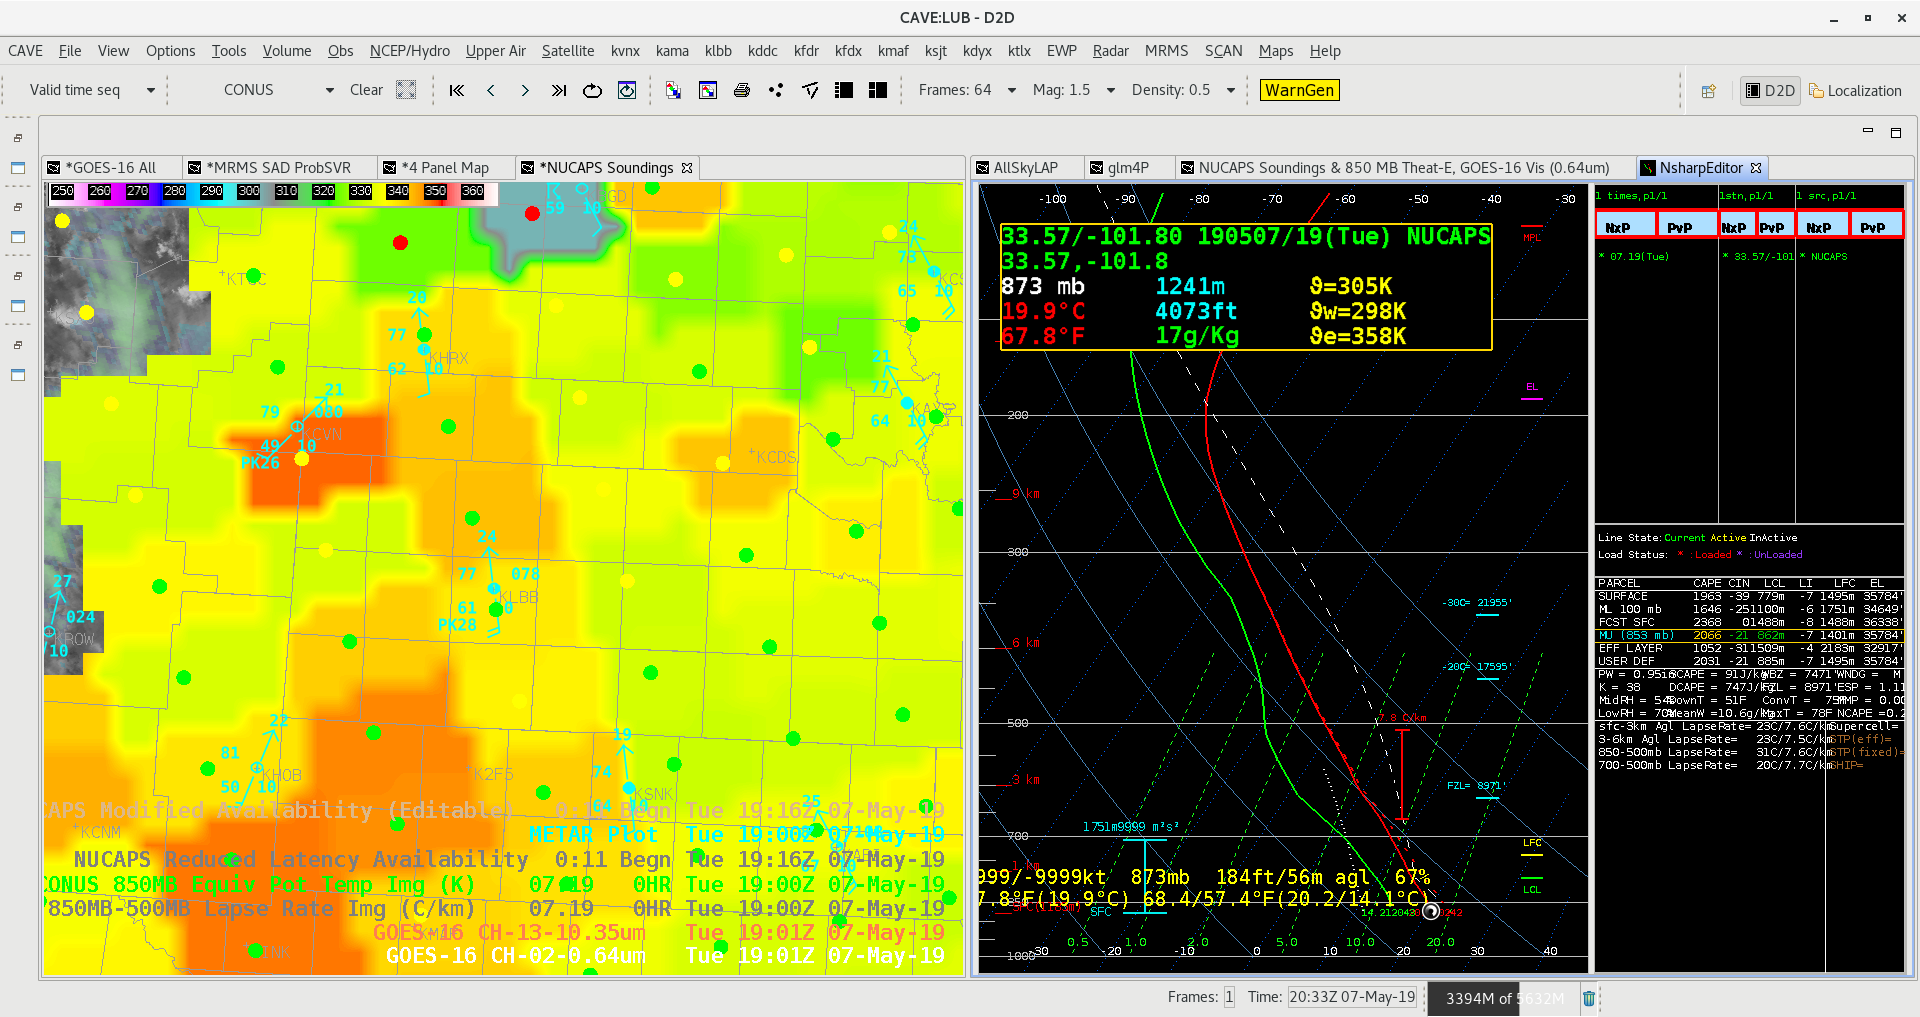
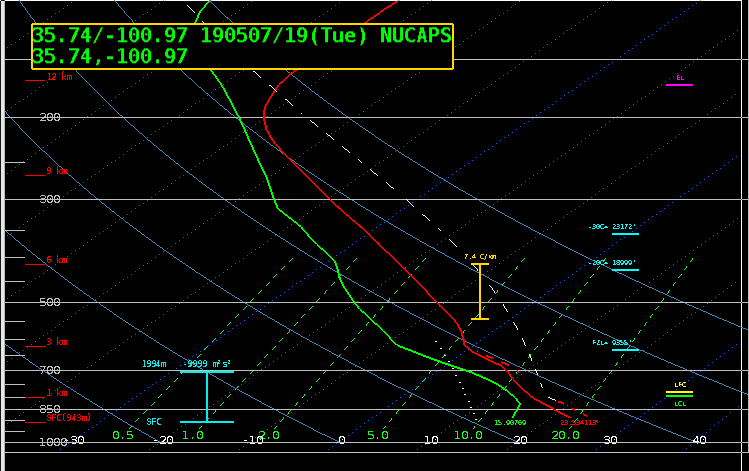
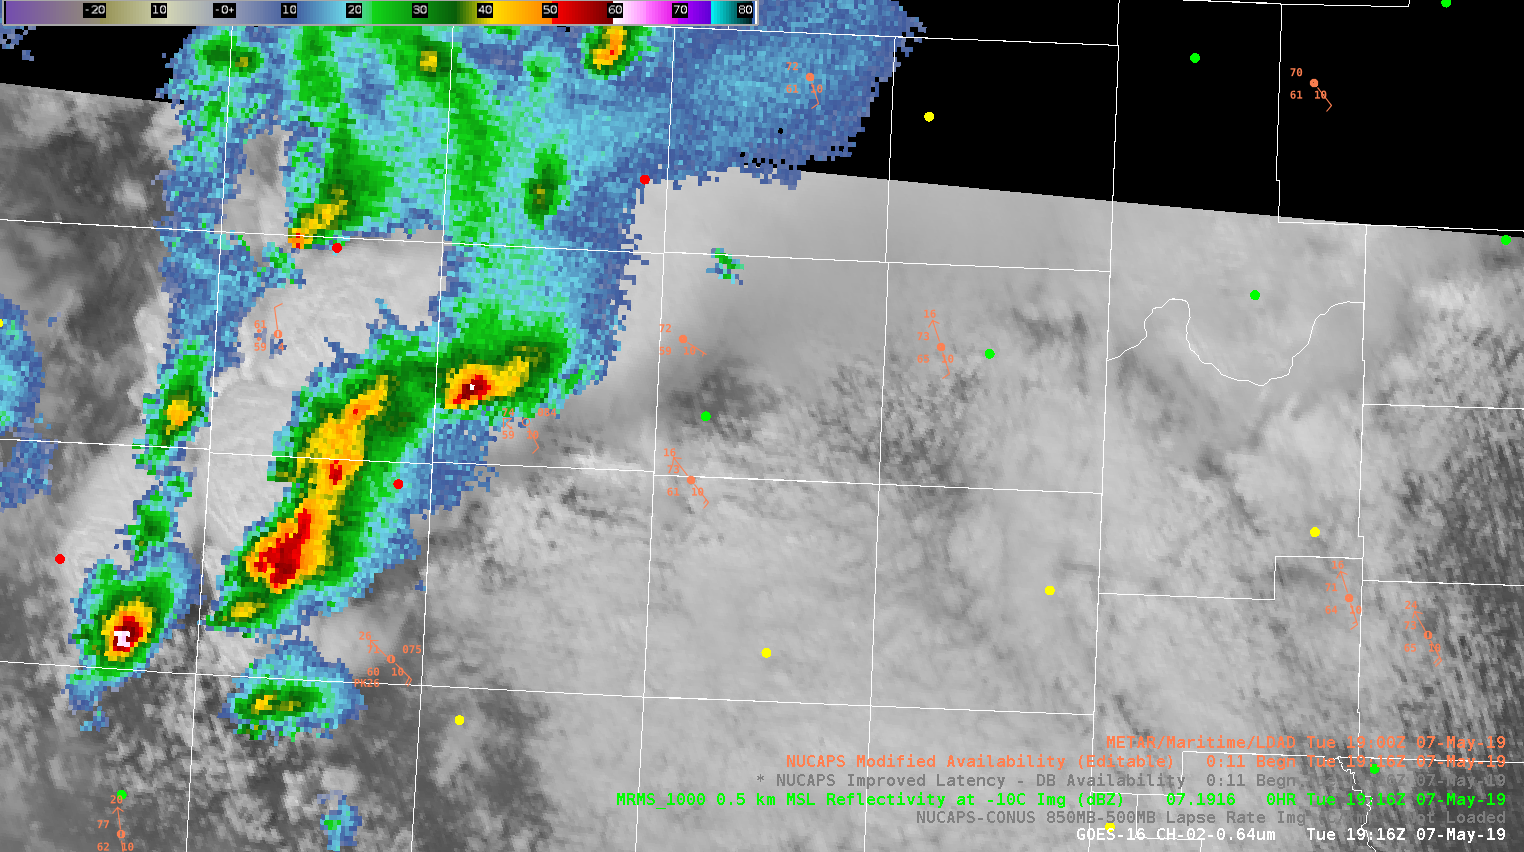
Modified NUCAPS soundings taken at 19Z became available in AWIPS and was noticed around 2030 UTC. The One taken near Lubbock was flagged as a Successful. I wanted to compare the NUCAPS sounding withe the nearby 19Z METAR observation and found the METAR measured temp/dew observations of 77/61 where the NUCAPS sounding at the same time had surface measurement of 69/58. The difference between the surface temperature observations for a modified sounding was concerning.

#ProtectAndDissipate

Big, Bad, Flash or Bad Big Flash

Everything was chugging along great with the GLM and the storms around Amarillo this afternoon as this image from 19:54 shows (TL – Flash Extent Density 5-minute w/ 1-minute update with Vaisala GLD Data overlayed, TR – Minimum Flash Area with ENI Total Lightning overlayed, BL – Total Optical Energy with Vaisala NLDN overlayed, BR – IR/VIS Sandwich):
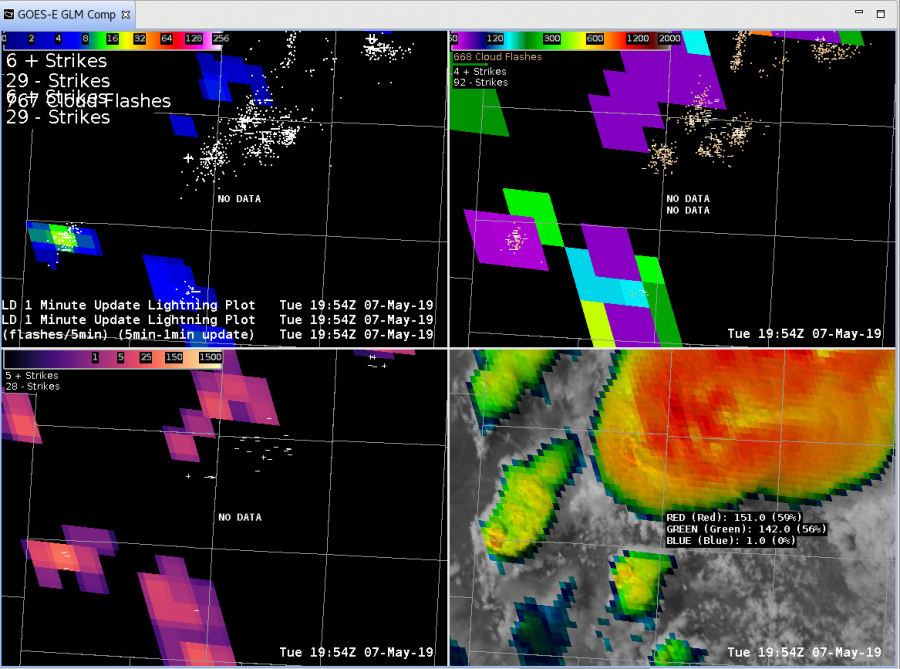
But then the next set of data arrives at 19:55:
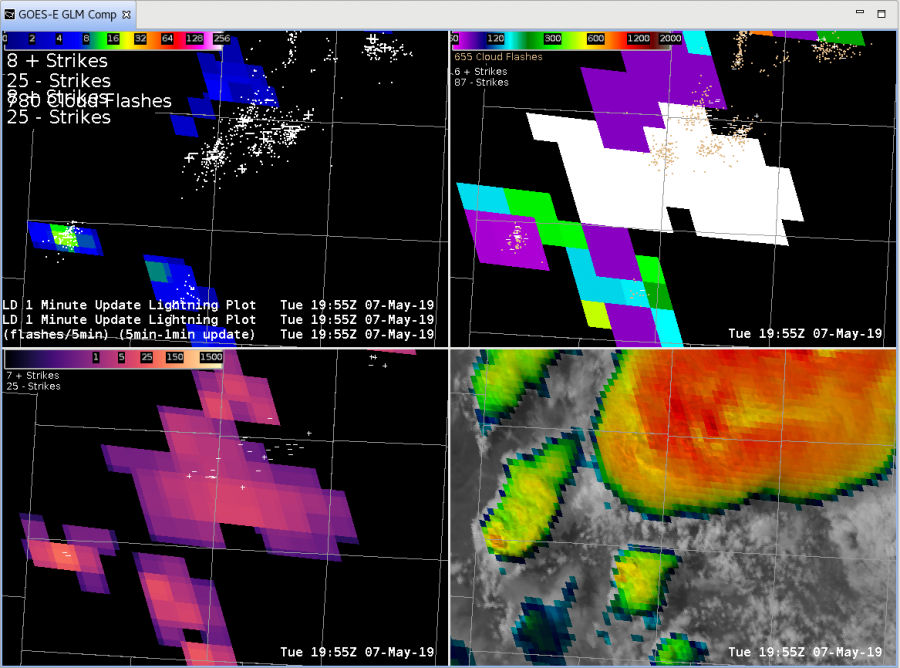
So, that big white area showed up which is a 2918 km2 area flash.  WOW.  THAT. IS. HUGE.  But the question now becomes is that correct or not?  Taking into account parallax and the data from the ground-based networks shows that there was electrical activity in the general area.  However, it isn’t in the area that would line up with the parallax; the ground-based network data should be closer to the southeastern area of the flash.  Also of interest is that there is no Flash Extent Density associated with the large flash but there is an associated area of Total Optical Energy.

One thing we are tossing around here is the possibility of a cloud reflection; here is the 1-minute visible mesoscale scan with the big flashes overlayed:
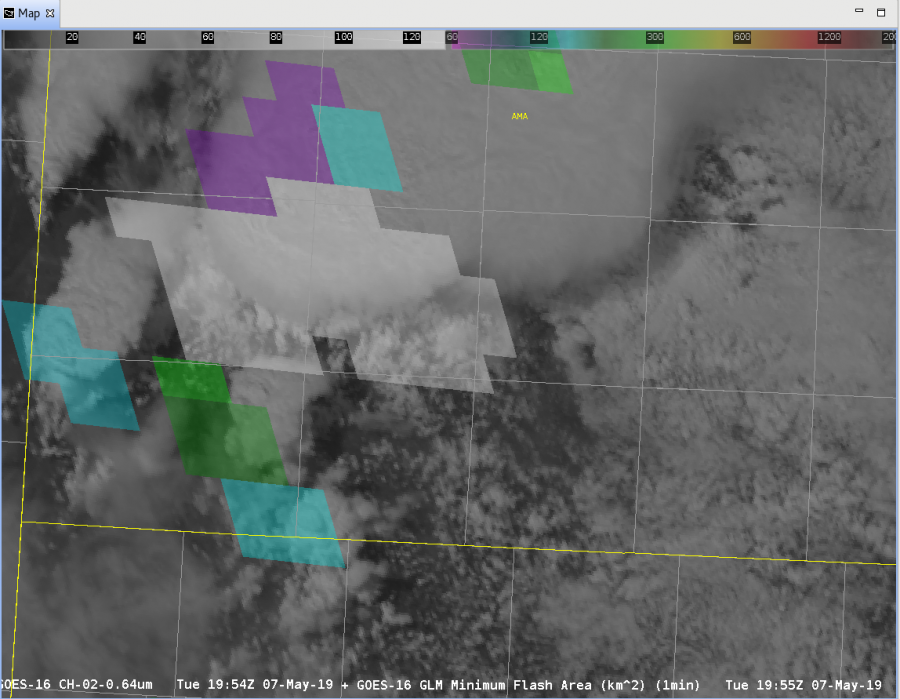
If there was indeed a flash at this time, the optical energy could have reflected from the originating area off the anvil, and then reflected back off the low clouds around the updraft to the GLM instrument.  However, the fact that there isn’t any data associated with this flash in Flash Extent Density is concerning.  Needless to say, the lightning scientists here are all going “Hmmmmmmm….”

-Dusty

GOES 17 May Have Better Angle of TX S Plains Storms

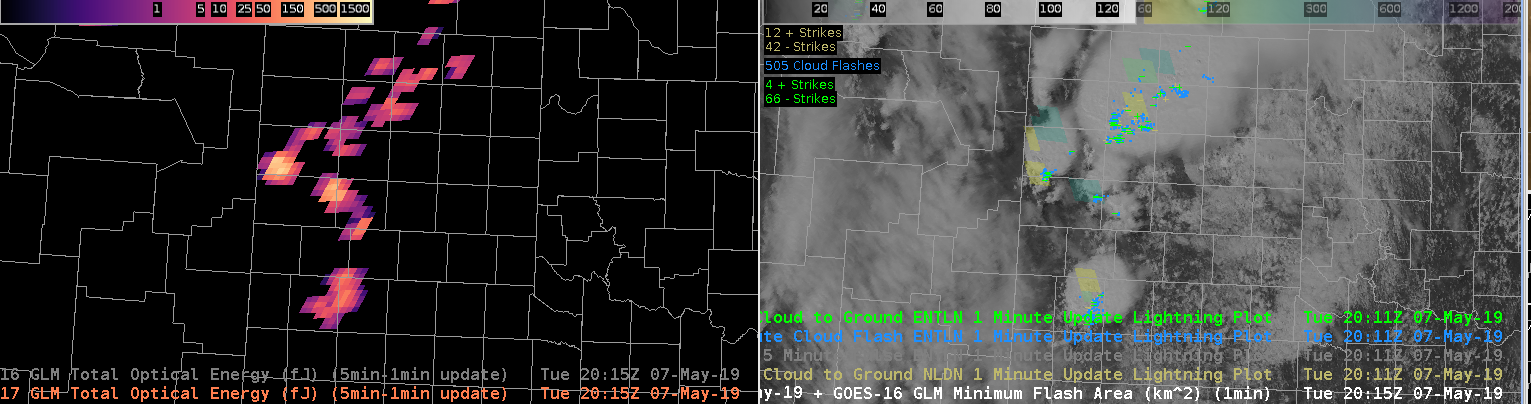
Due to the location of GOES 17 and GOES 16 , forecasters may want to consider the satellite’s angle of view for convection. In this example, GOES 17 has a better “viewing angle” into developing convection across west Texas.  Optical brightness has been brighter than GOES 16 and a better output of Extent Density.

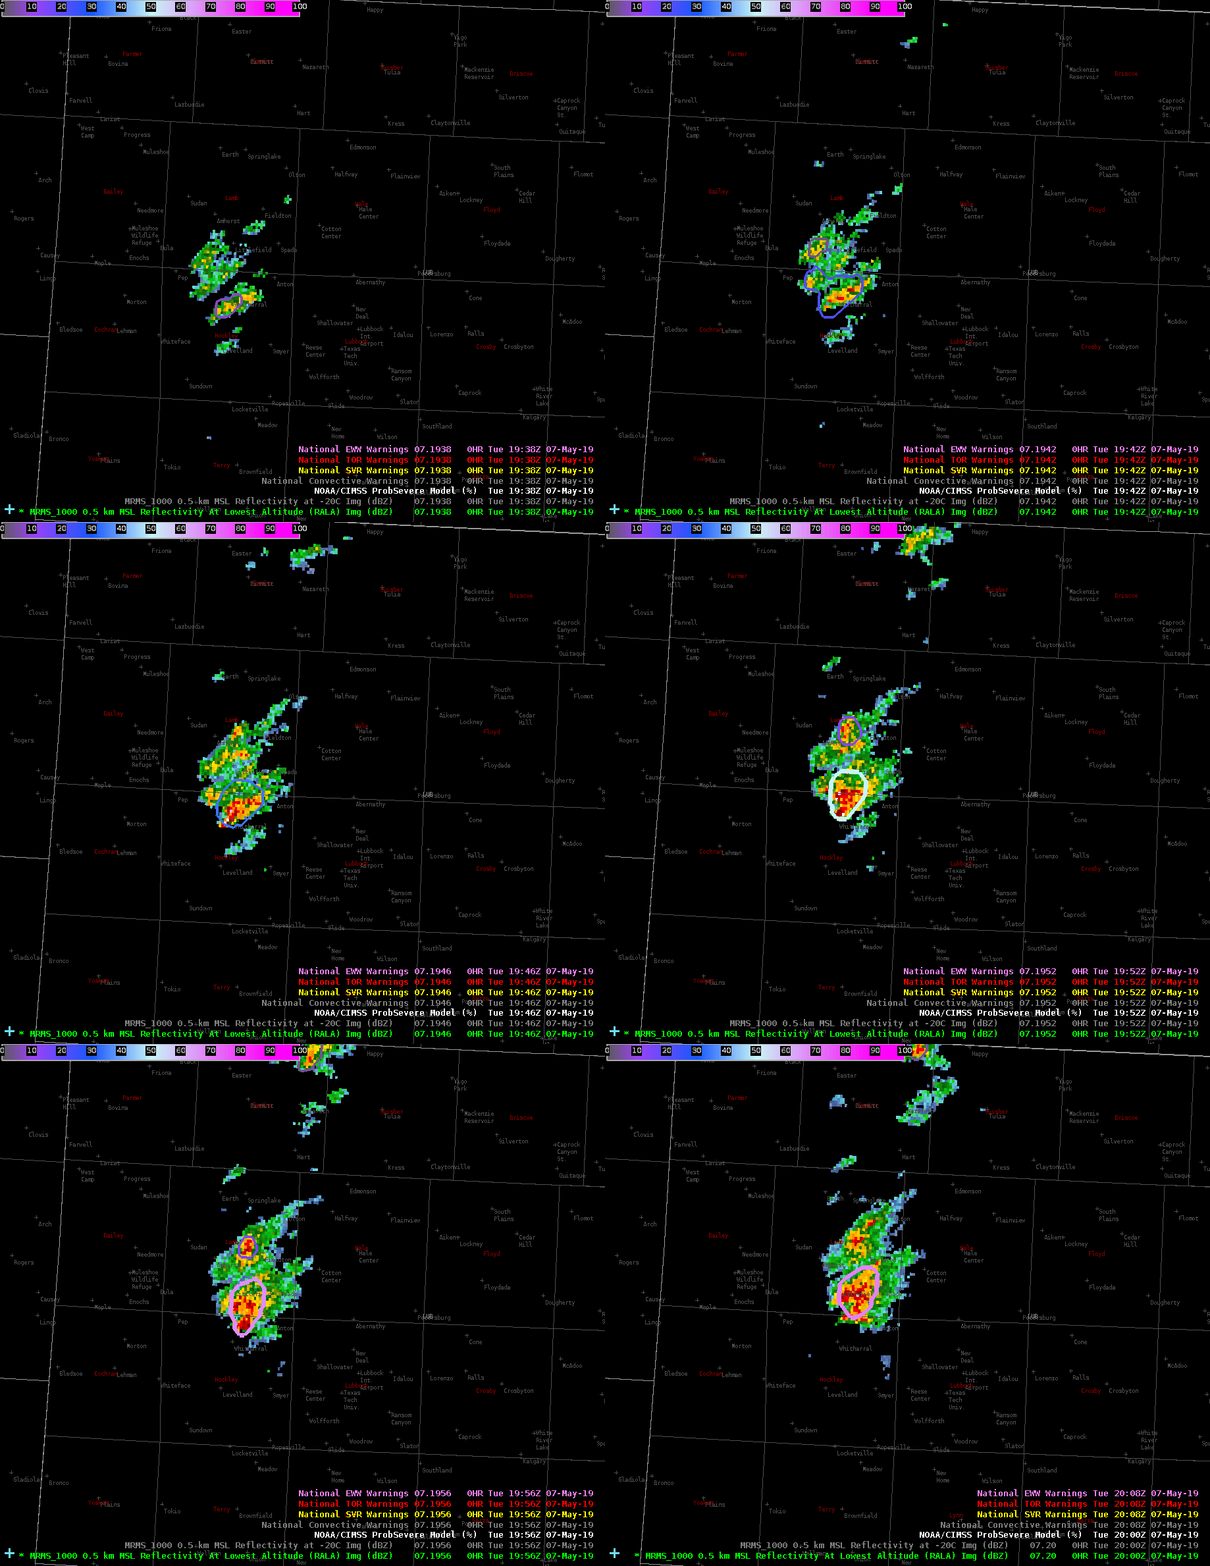
ProbSevere Progression with intensifying storm

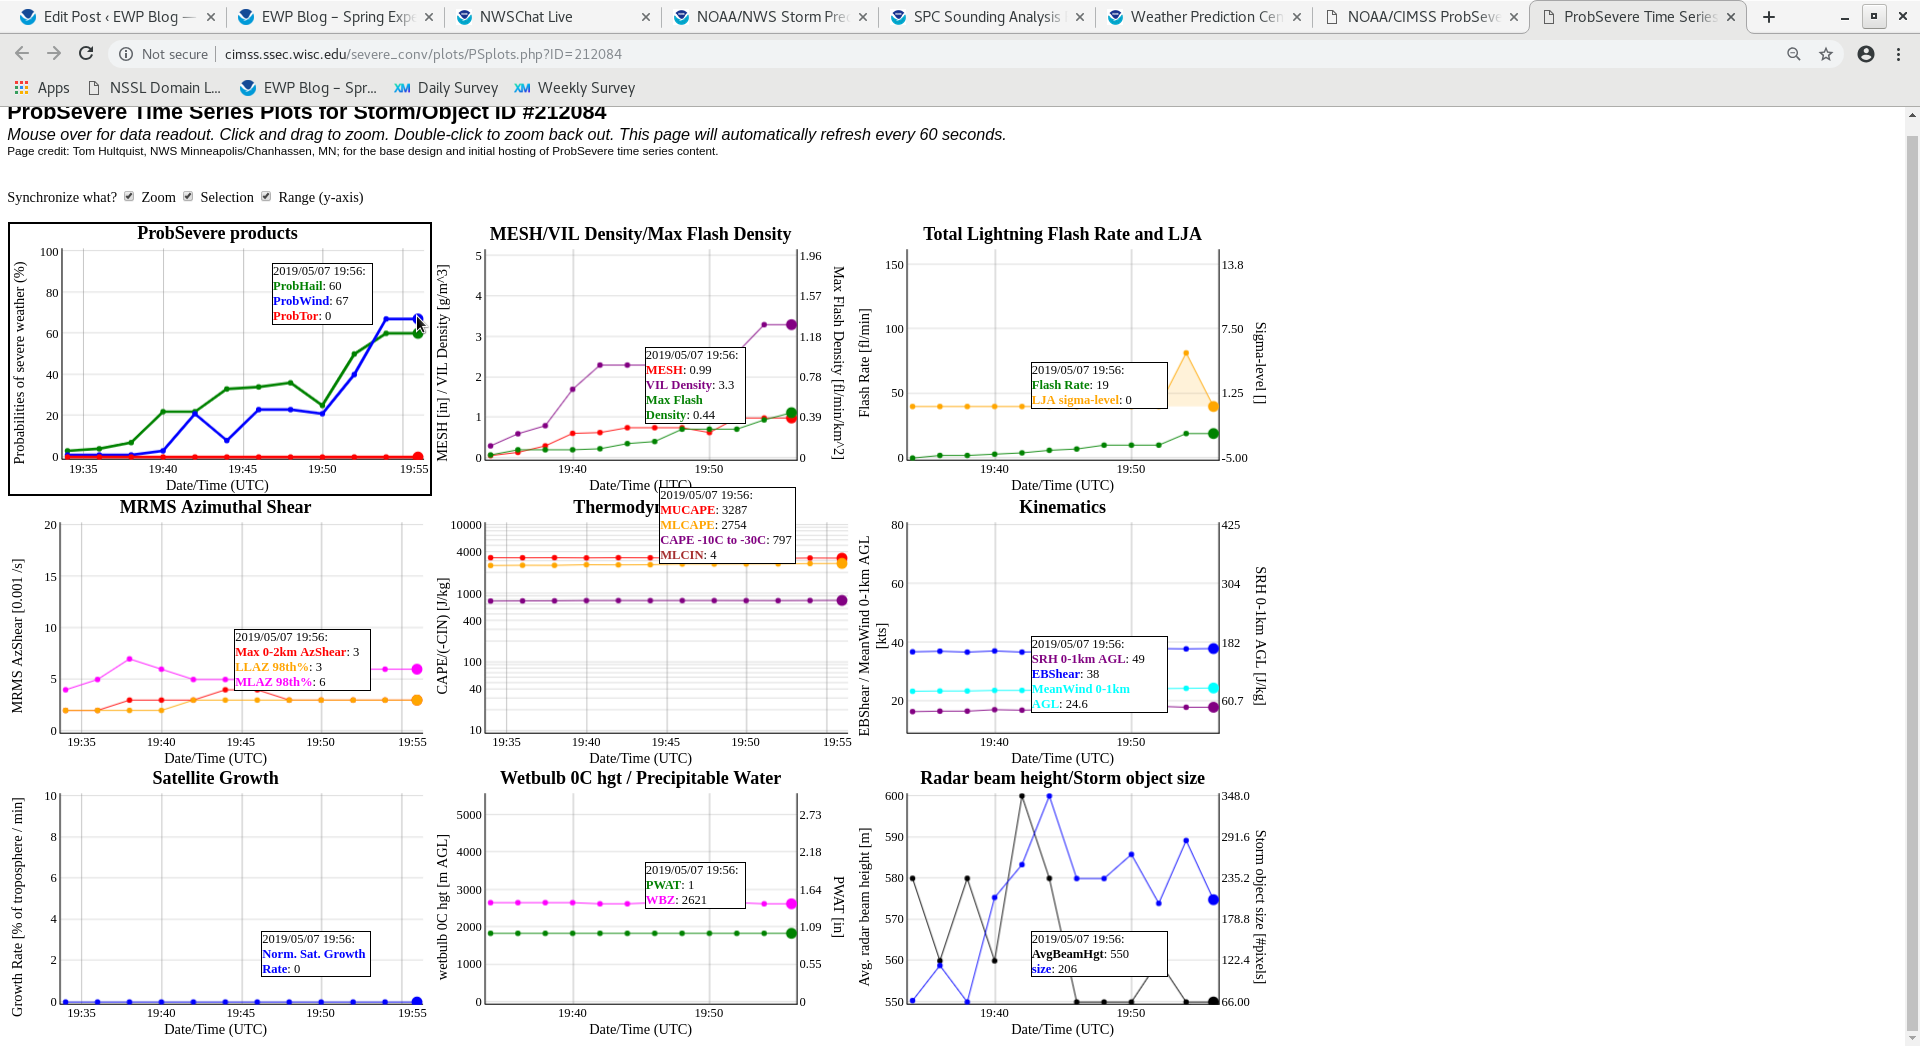
I like seeing the progression of the storm on the ProbSevere page, showing the trends of developing convection. You can see how the increases of ProbHail and ProbWind parallel certain parameters like MESH, VIL, and Flash Rate parameters.  It’s also interesting to see what’s not being utilized or loaded into the page such as Sat Growth Rate.

With some MRMS data being loaded into the ProbSVR model, one possible addition to the parameters could be Vertically Integrated Ice (VII) vs VIL. Have found in operations to be a very good indication for strong updrafts above the FZL. Hail and Wet Downbursts have been correlated with very high values of VII (above 25-50 kg*m^-2).

#ProtectAndDissipate

High AzShear Values Near Areas of Range Folding

When using AzShear forecasters need to watch out for high values near areas of range folding. You can’t just assume that the high values mean something. This is an example to show that you still need to do basic storm interrogation and can’t purely rely on AzShear to issue warnings.

Displacement from damage path

KEOX AzShear shows displacement to the north from the given damage path. This shows up with KMXX AzShear as well. This displacement is also occurring with SRM data, but even more so with AzShear. Circulation is so small that AzShear is quite helpul here, as this could almost be missed with SRM data, and reflectivity looks completely innocuous. Detection of this short-lived tornado would be picked up much better with the use of AzShear.

ZDR_Arcophile

Single-Radar vs Merged AzShear

The 0-2km merged Azshear product showed multiple “hot spots” at the beginning of this particular storm. But which one is more important? Below is what the  merged AzShear looked like at 2023Z…

Without looking at velocity data you can’t really tell where the center of the storm is using the merged product. However, here is what the single-radar AzShear looked like around 2023Z…

The single-radar AzShear clearly indicates that the southern couplet in the merged product was where center of the rotation was located. This clearly shows how single-radar can provide additional information in a warning situation.

Dryline Progression with AllSkyLAP

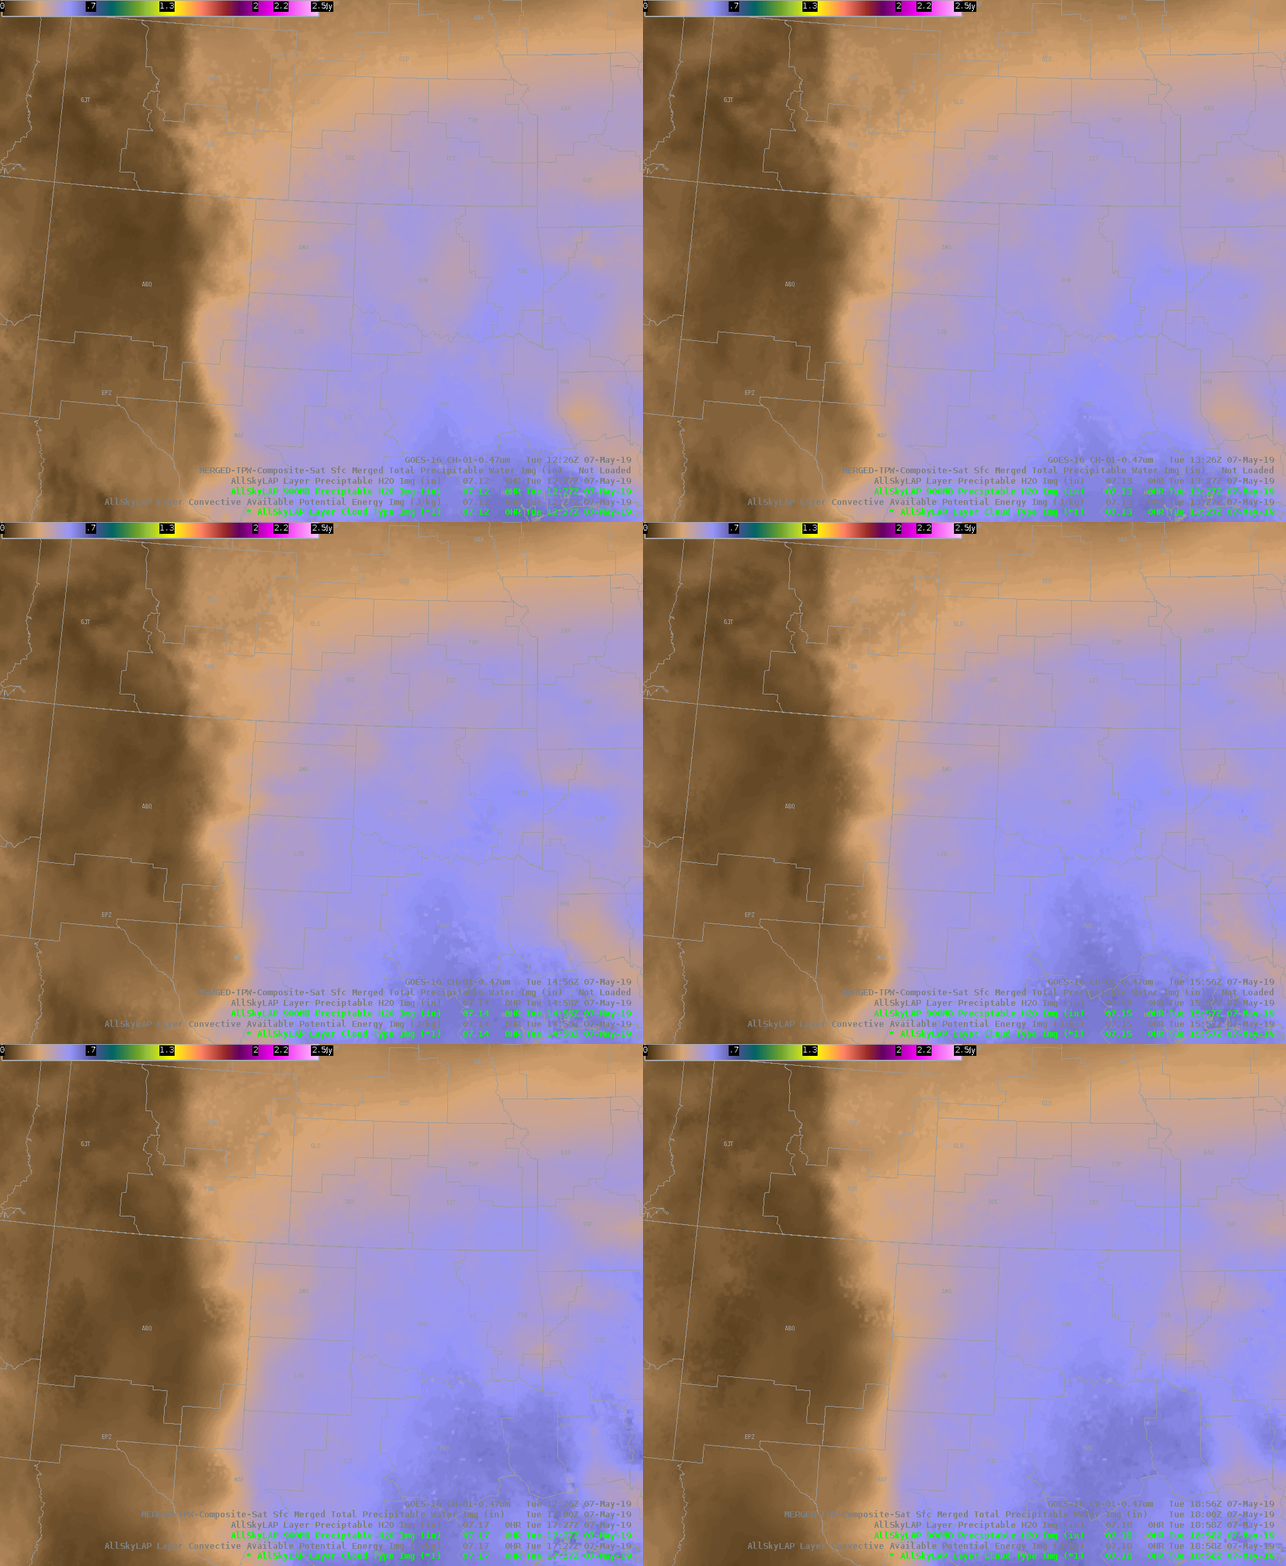
Noticed a glitchy progression in the AllSkyLAPs 900mb PWATs. Believe this might be from an updating GFS guidance, but this also occurred at a time when the areas west of the LUB CWA were transitioning from about half Cloudy, half GFS to mostly GFS. However, the updated location of the dryline was a closer approximation of the location of the dryline at the given time.

#ProtectAndDissipate

AzShear False Alarm

Here’s a case of a false alarm situation where a tornado was not produced. KEOX AzShear radar draws attention to this circulation that eventually fizzled. Still, it is nice to be able to see the trends later on with AzShear that clearly shows that it would be safe to take my eyes off of this storm as far as tornadic activity is concerned.

ZDR_Arcophile