HSDA Detections within non-uniform beam filling

Some HCA detections in the east (right most storm) are occurring within areas of non-uniform beam filling from the first storm (and most likely the second storm).  Forecasters should be wary of identifications within these regions and shows the need for investigation of the base variables in addition to using the algorithms for diagnosis of storm severity.

nubf_hca nubf_base


–KO

Tags: None

EWP Mesoscale Discussion May 23 2220 UTC

A complicated convective scenario continues to evolve over western Texas in an area of weak mid level flow where mesoscale features have been the primary driver for storm motion, storm type, and severe weather type.

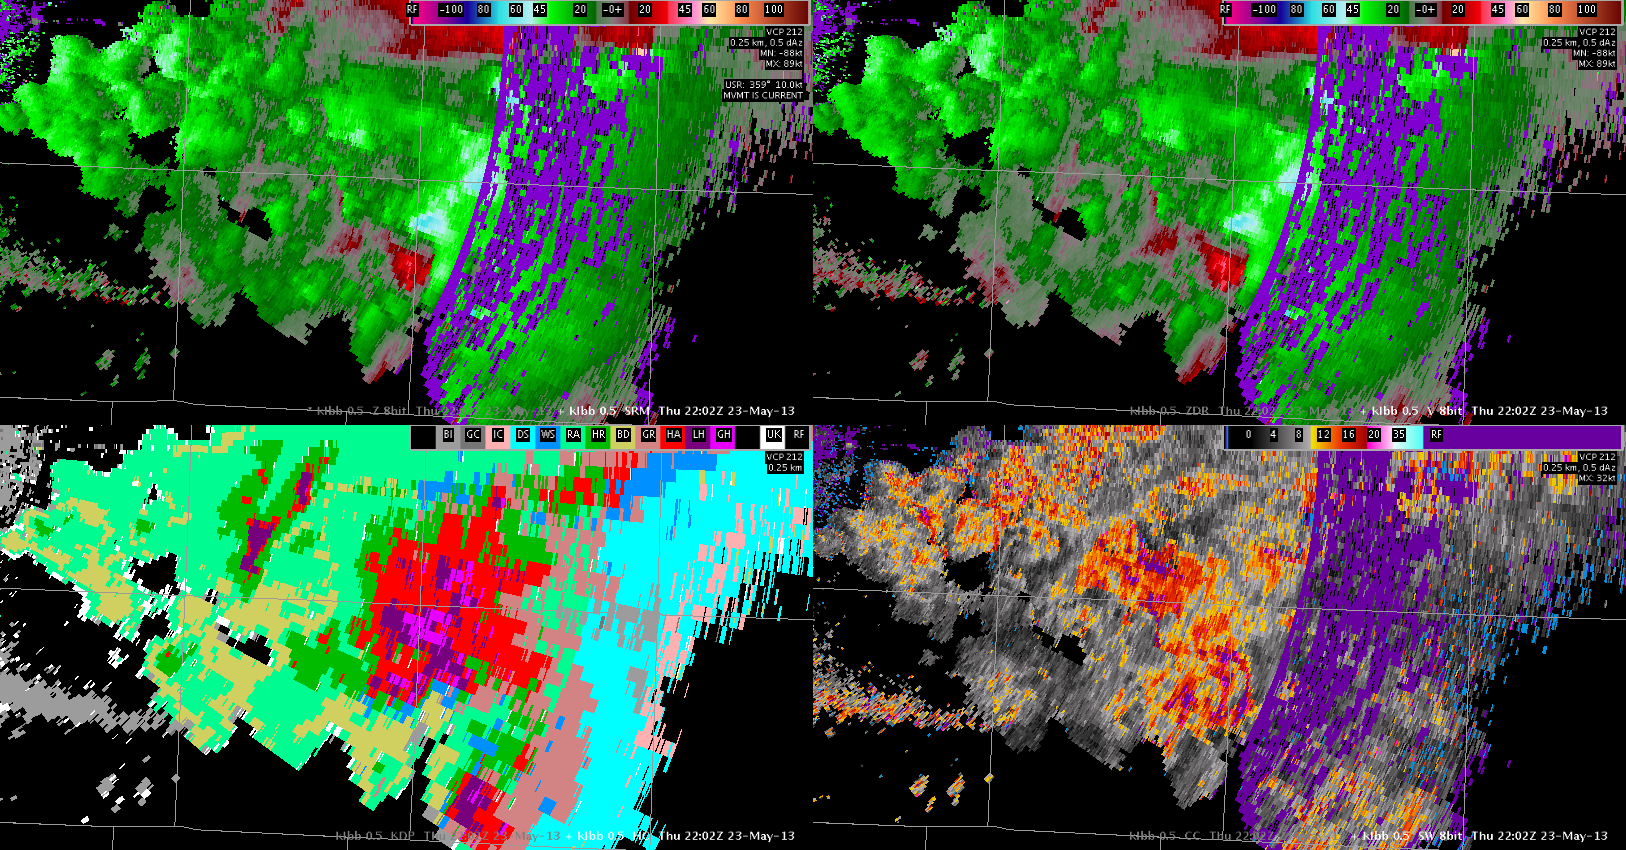
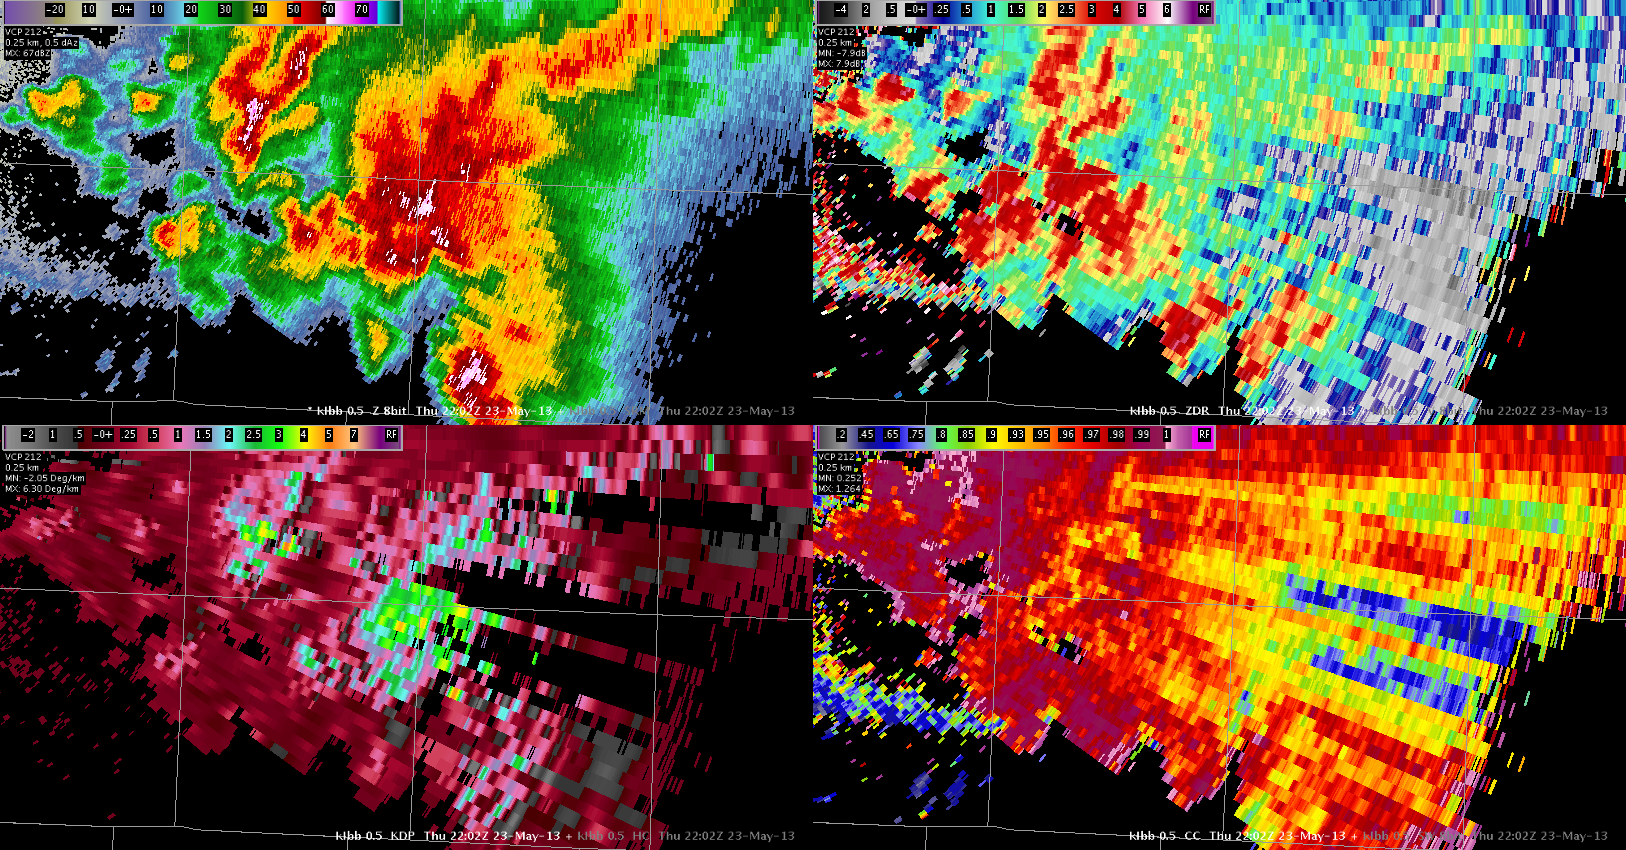
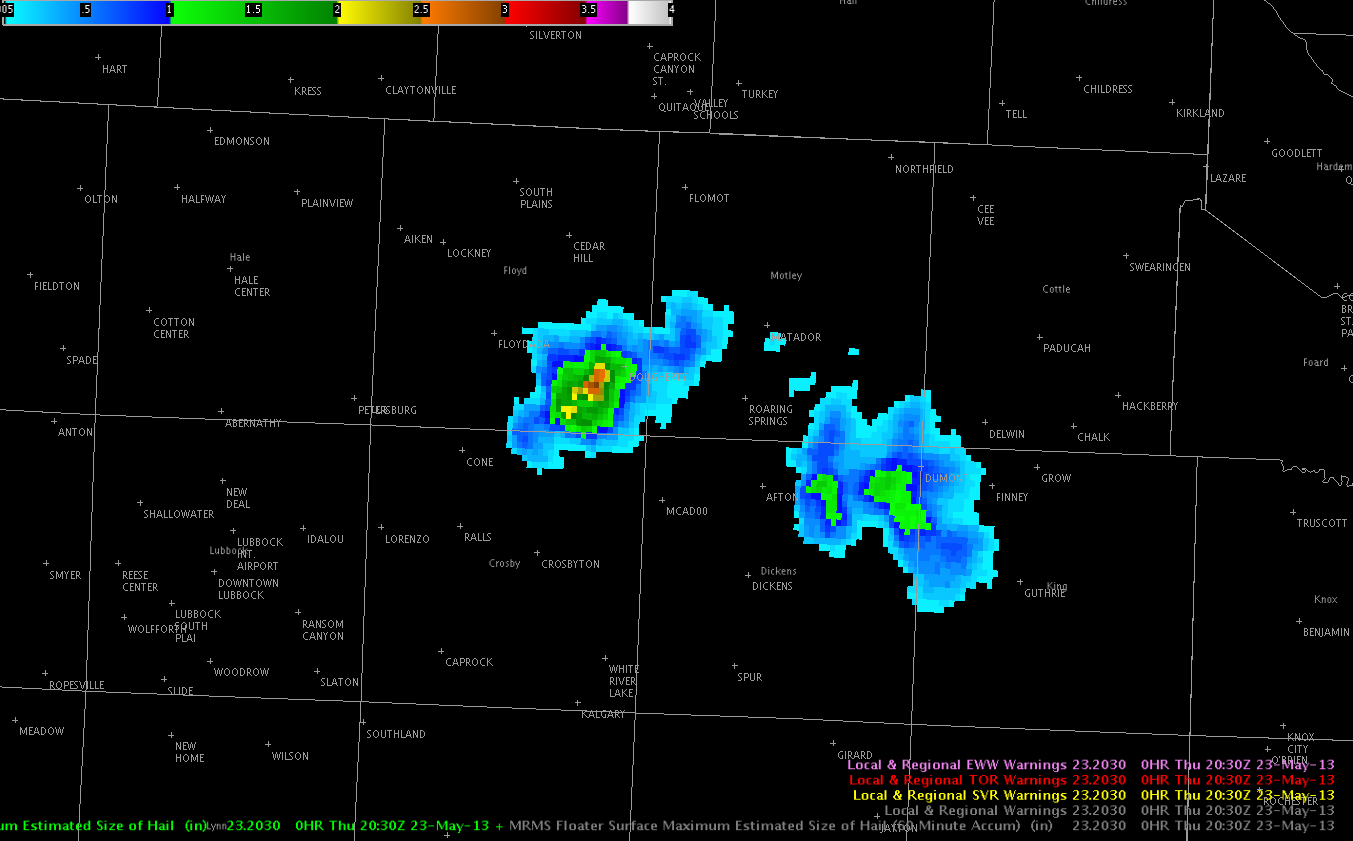
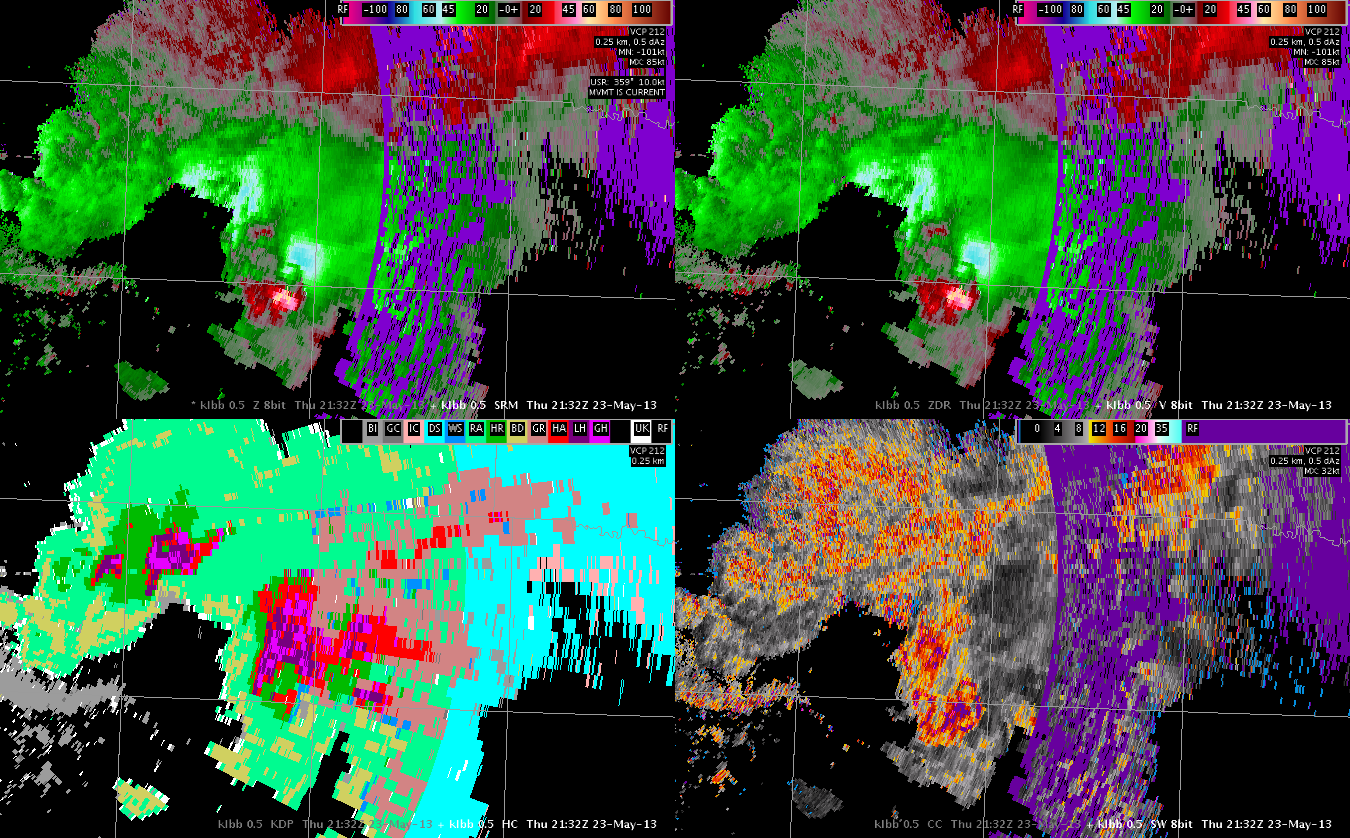
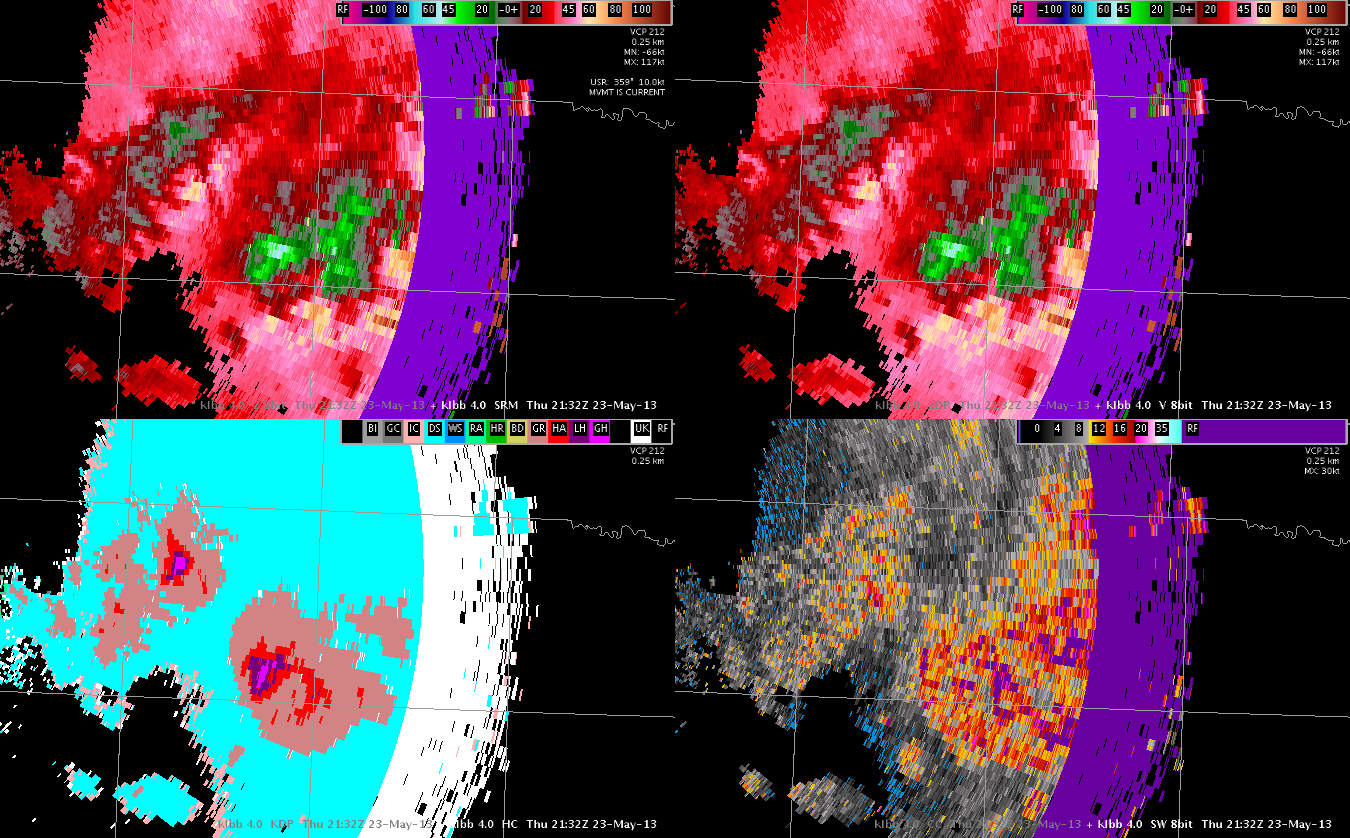
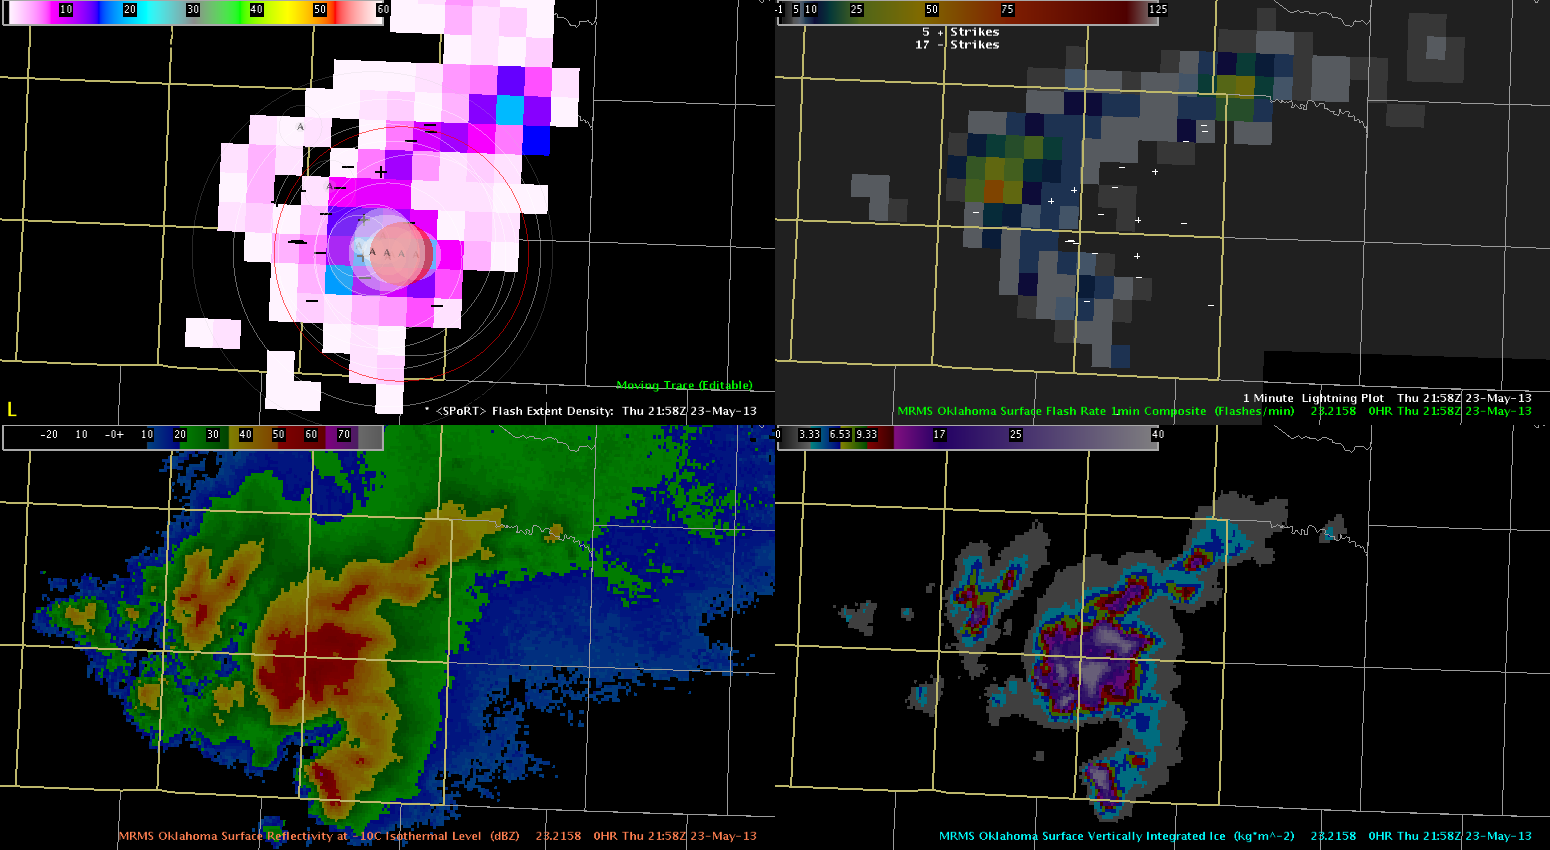
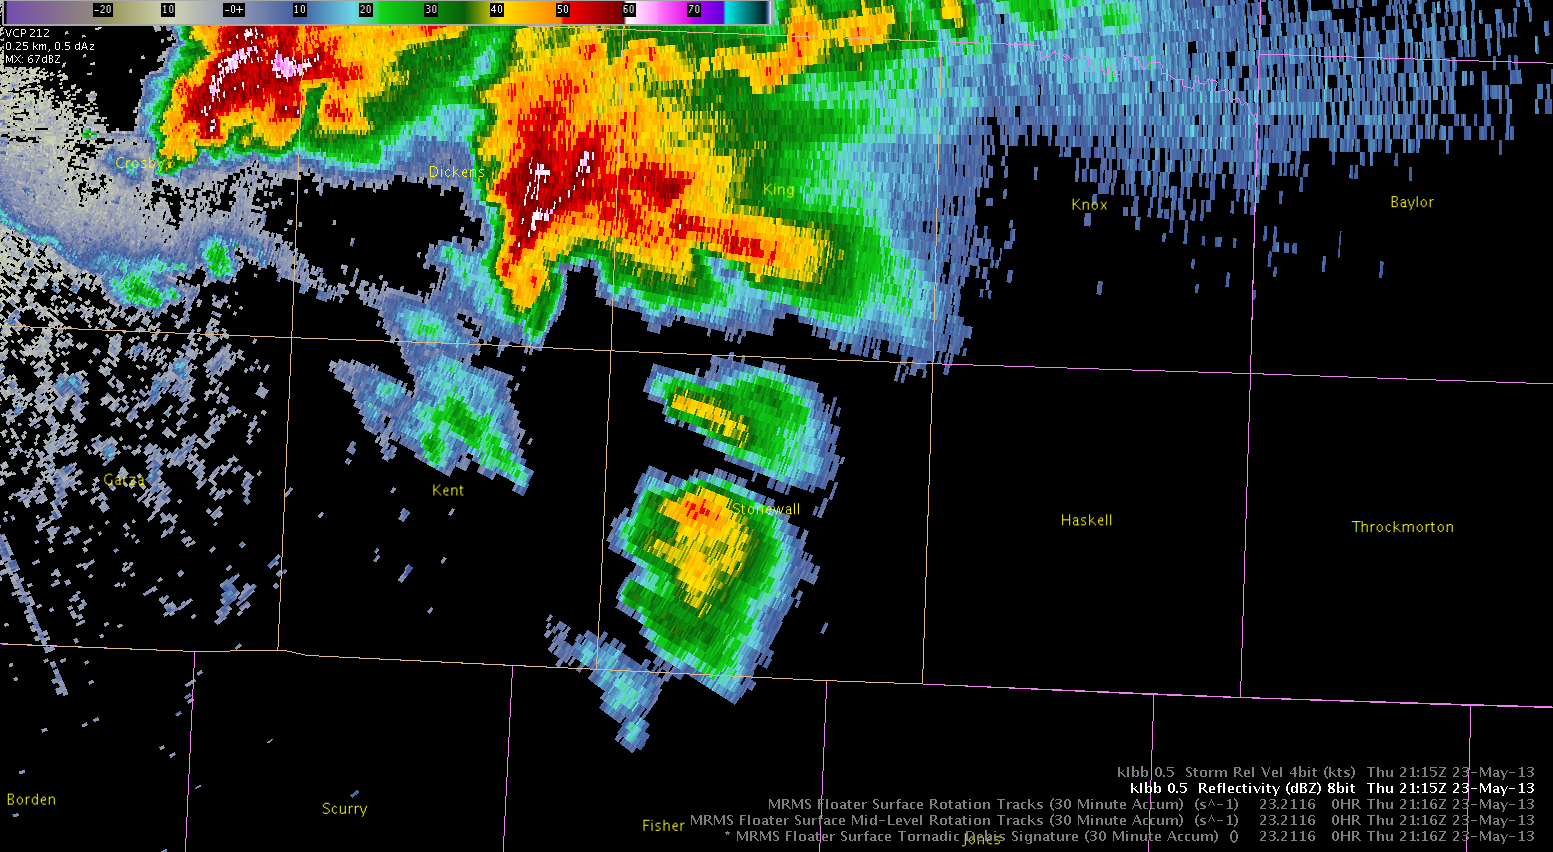
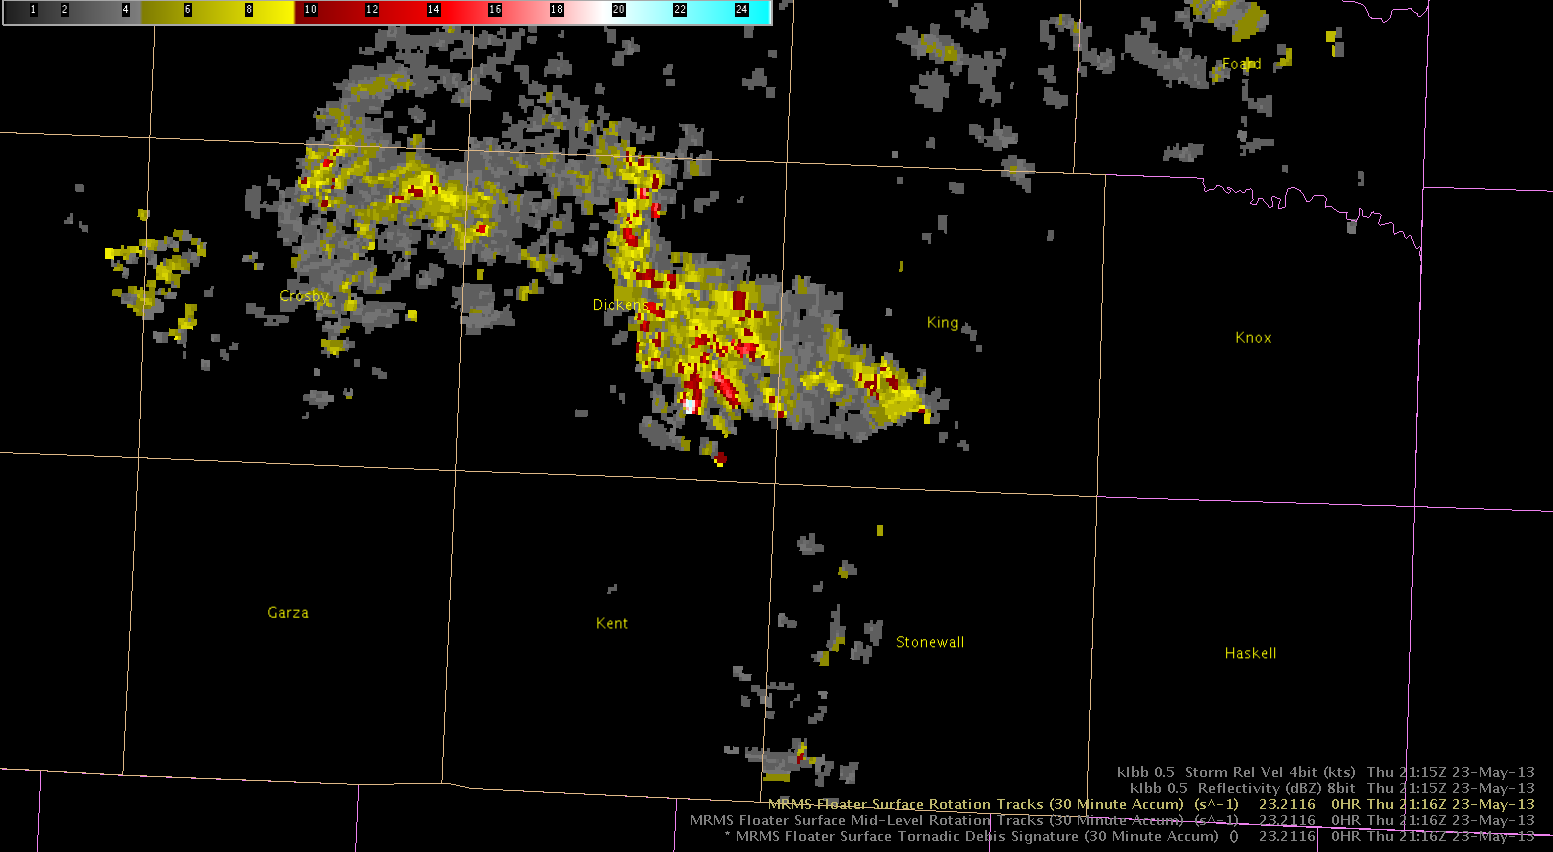
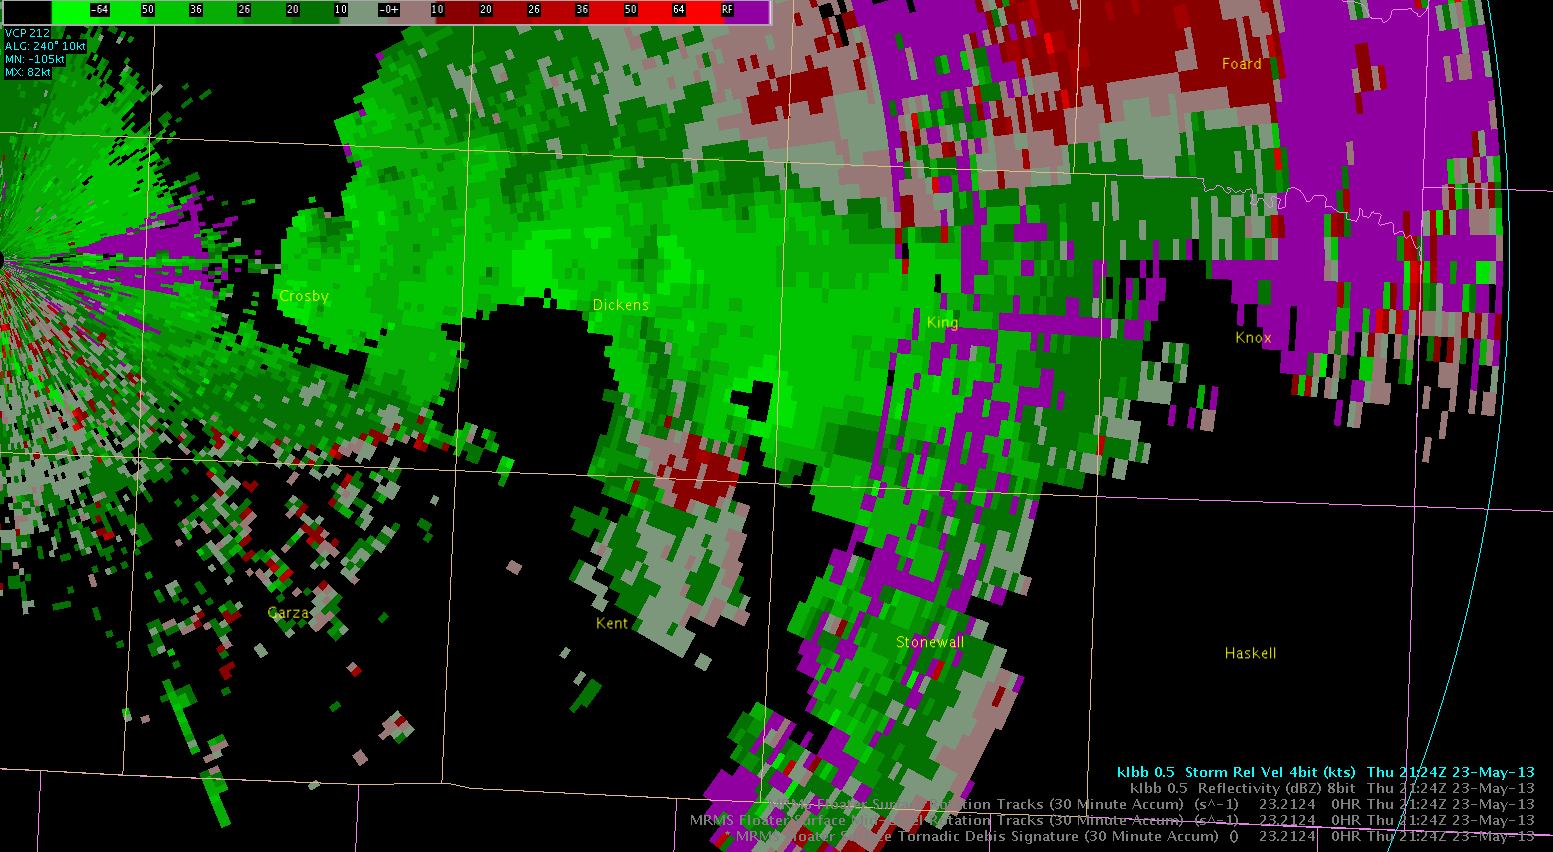
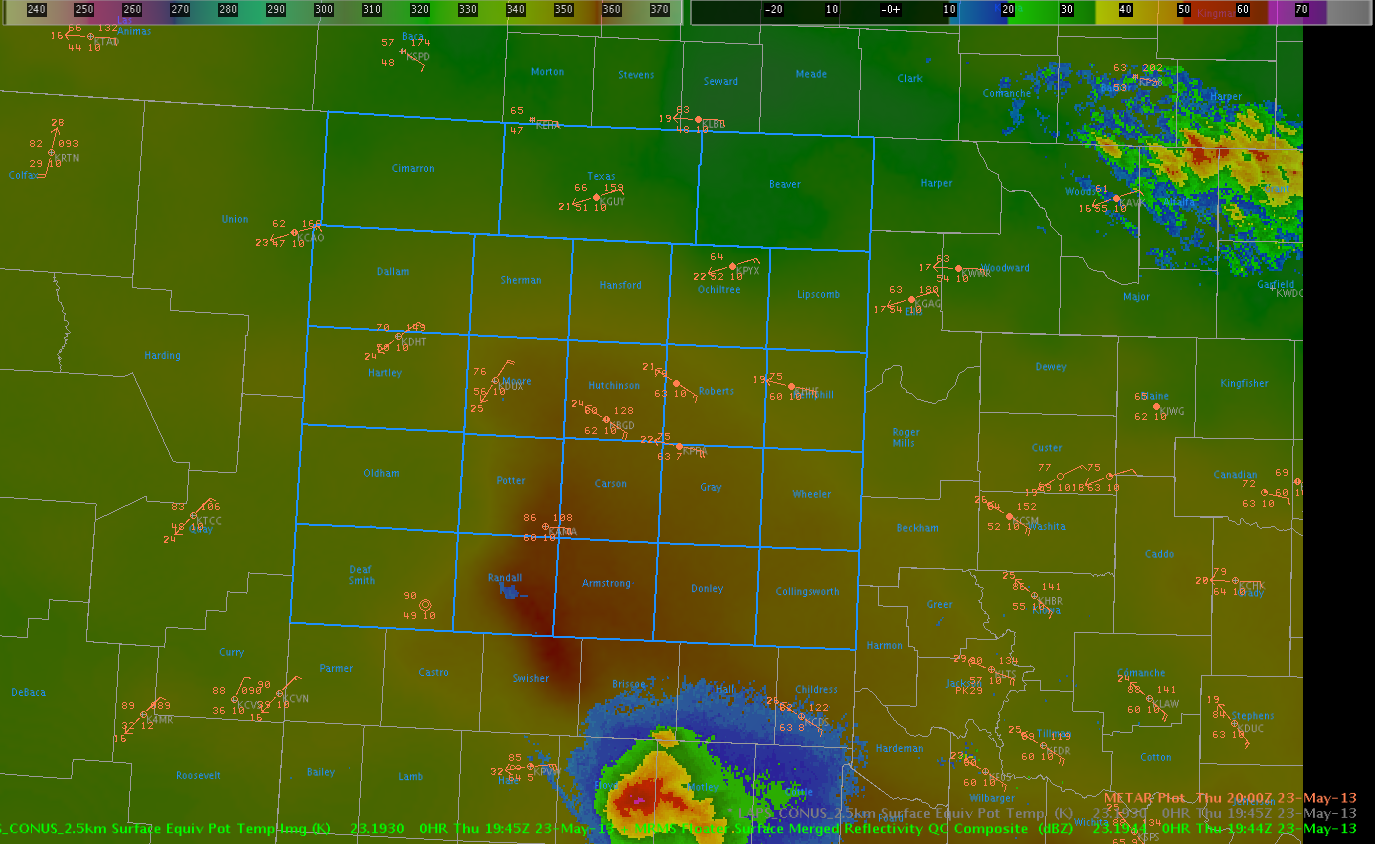
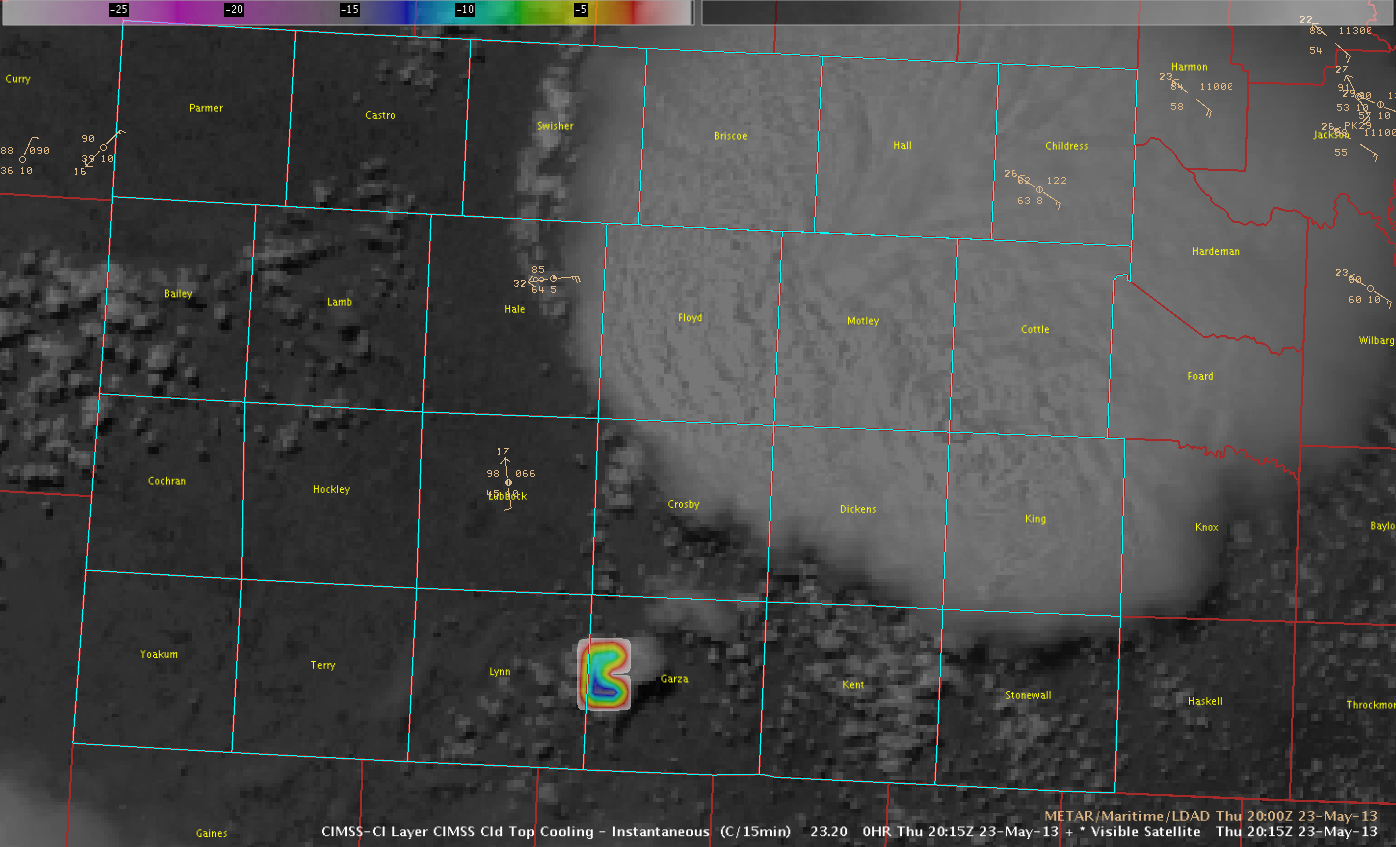
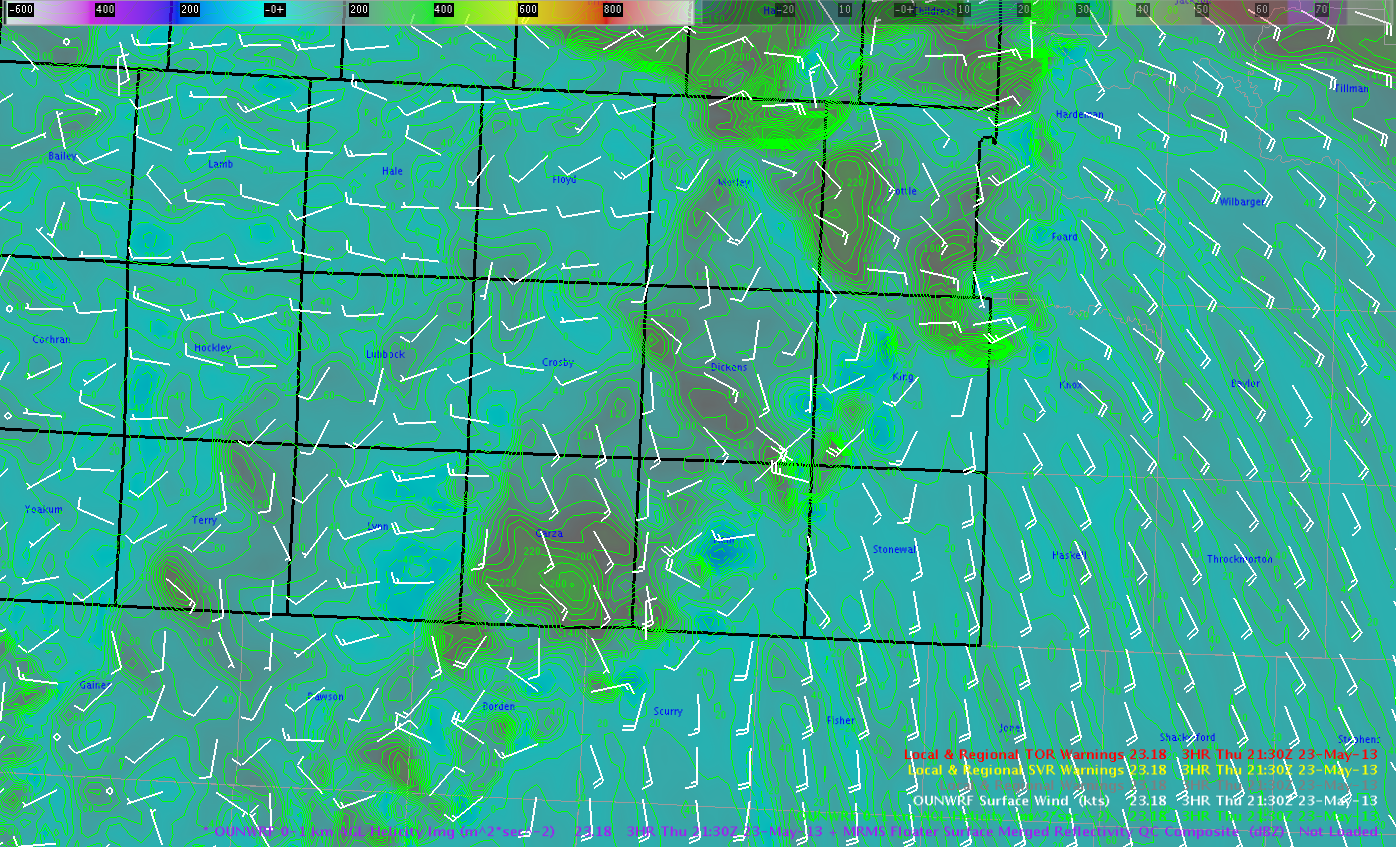
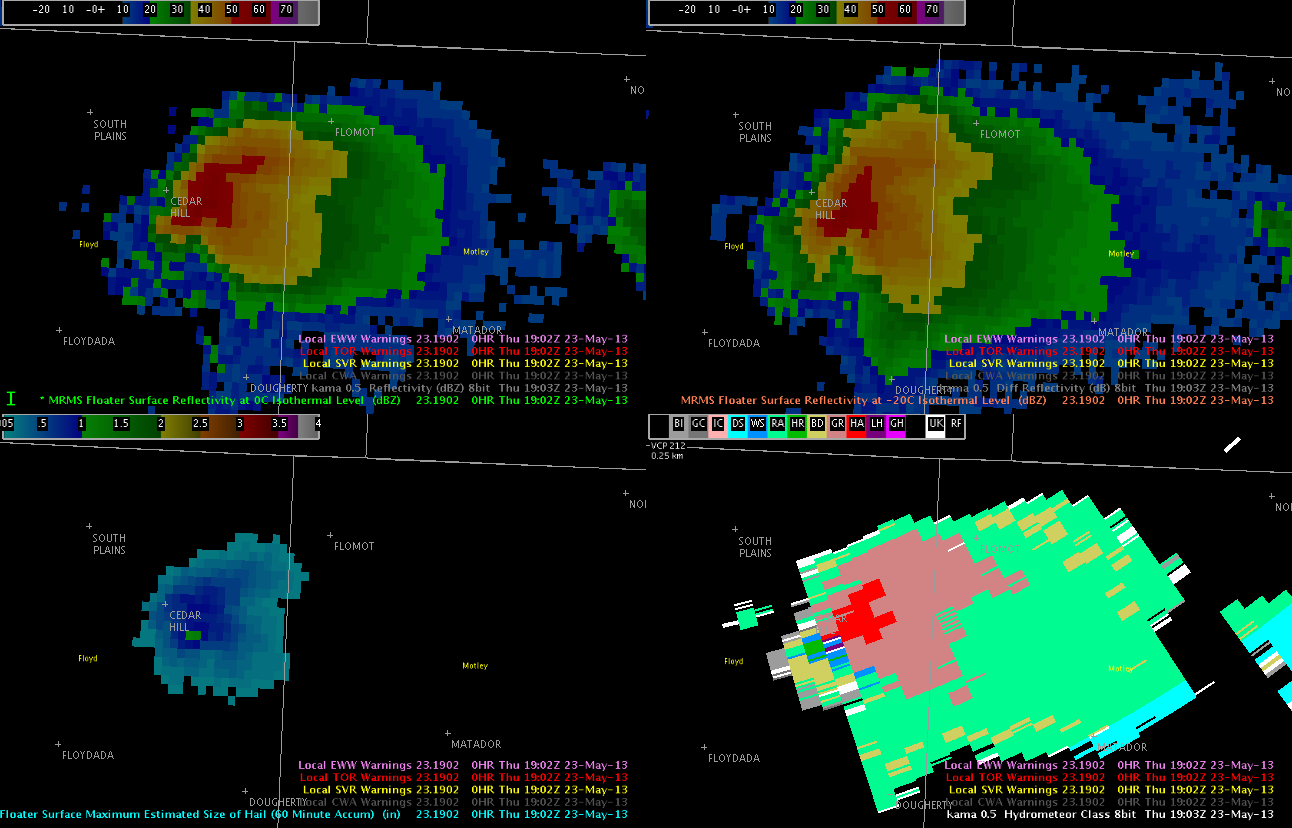
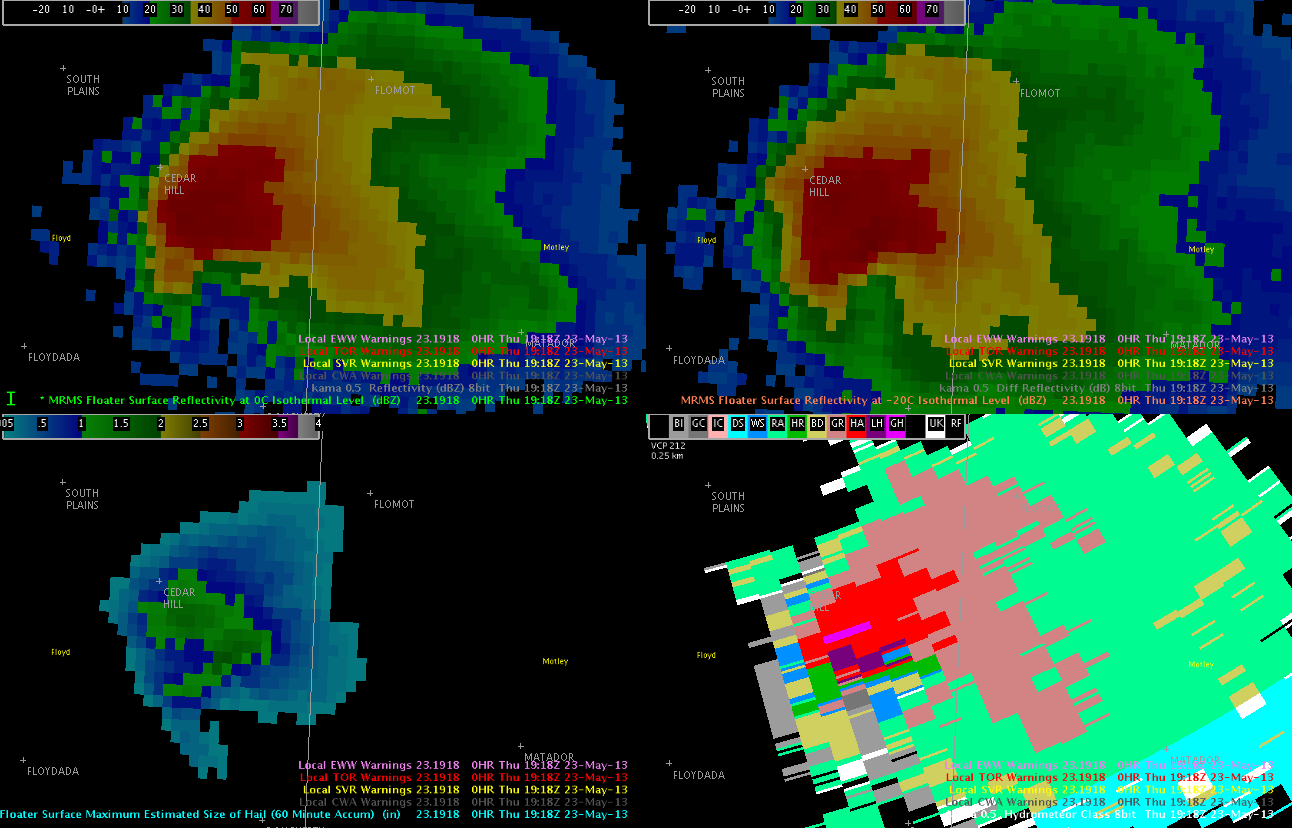
Severe supercell storms with all severe weather threats continue to move south southeastward across King and Dickens Counties into Kent and Stonewall Counties.  These storms have a history of tornadoes, golfball sized hail, and 80 MPH winds.  This severe threat is expect to persist as these storms move slowly along a region of high theta-E air with dew points in the low to mid 60s.

2030ZDewPointTempsLAPS

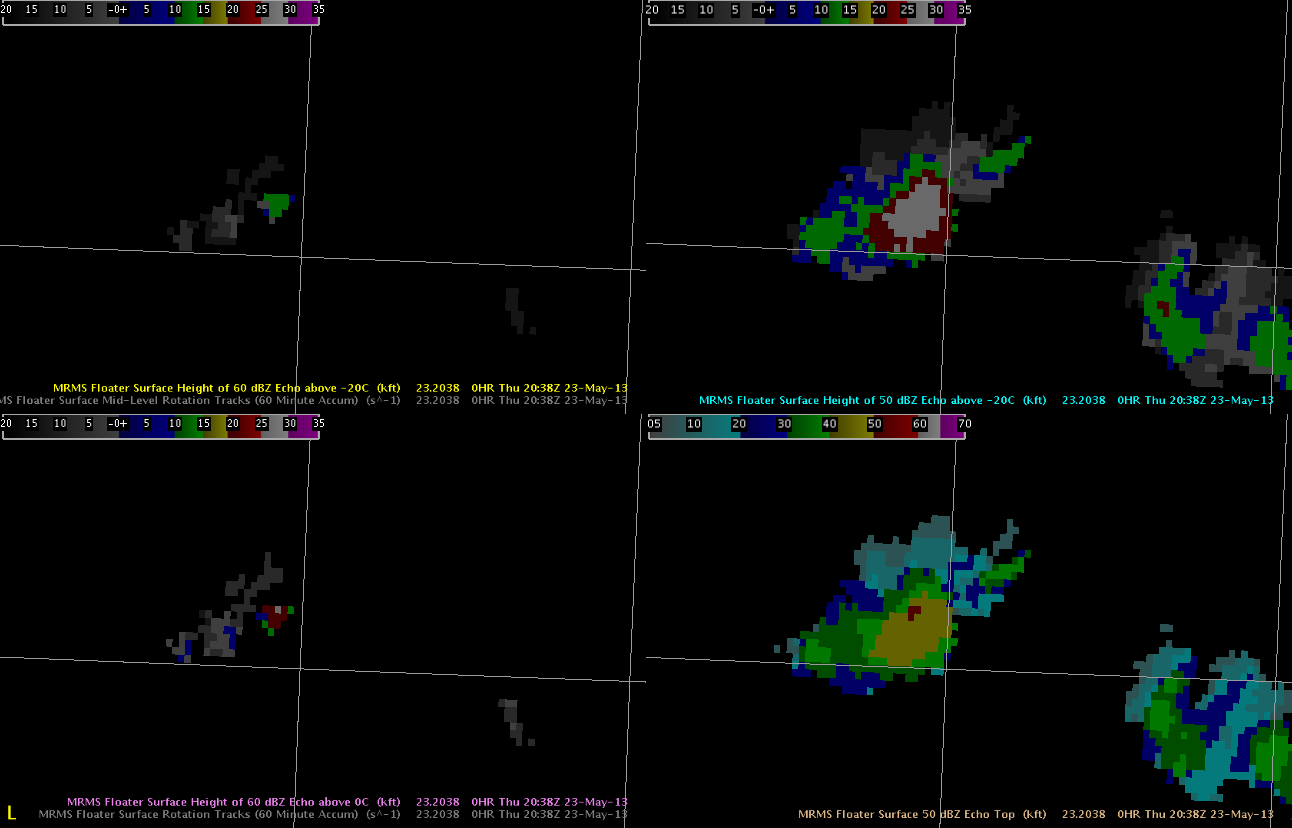
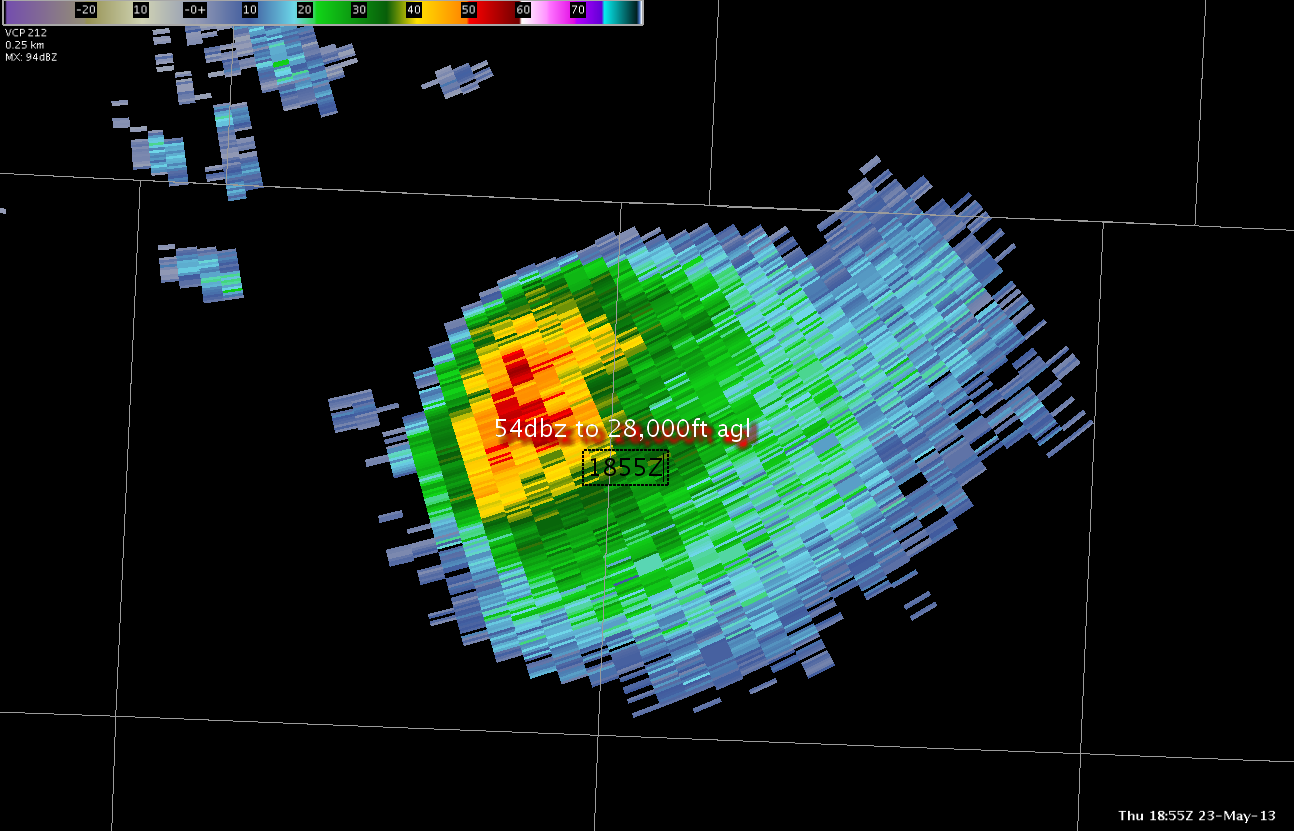
Recent radar trends show strong mid level rotation continuing in King County…and there is no current reason to believe that this storm will weaken at any point soon.

2148ZThursMidLevelRotationTrack

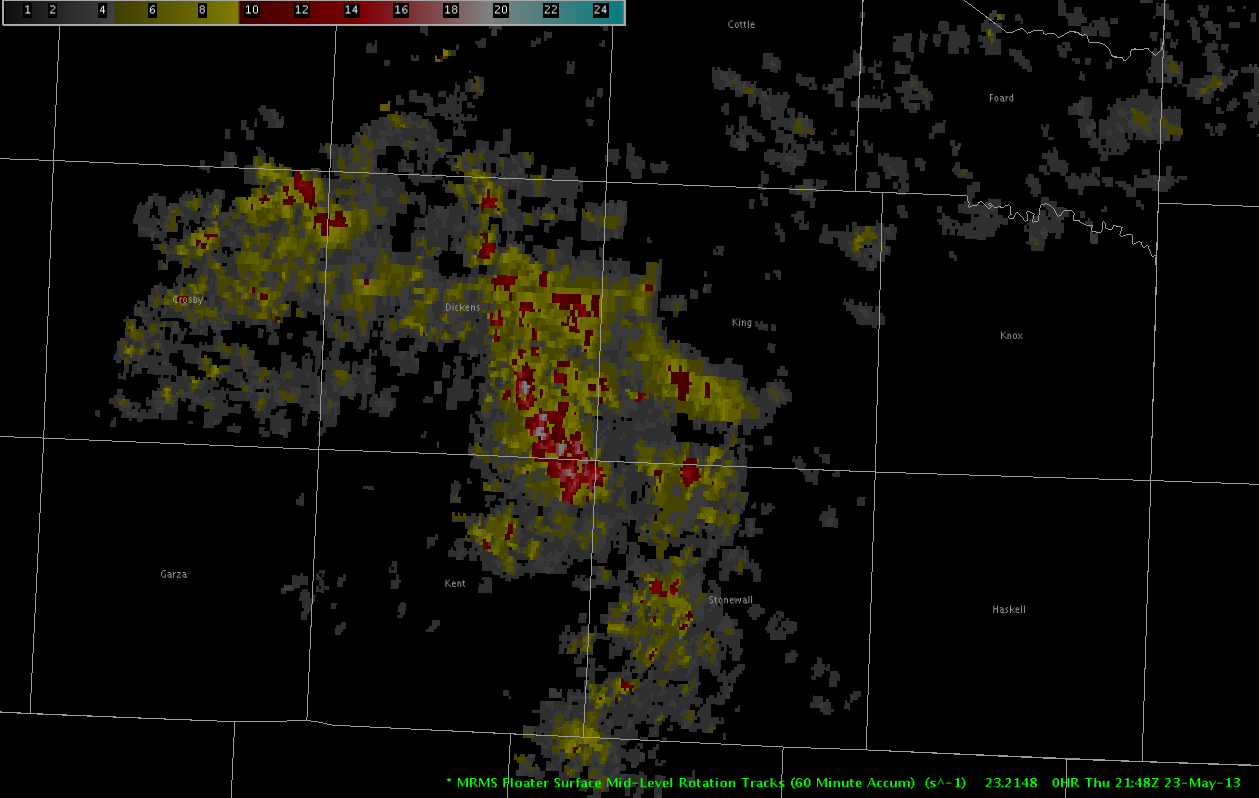
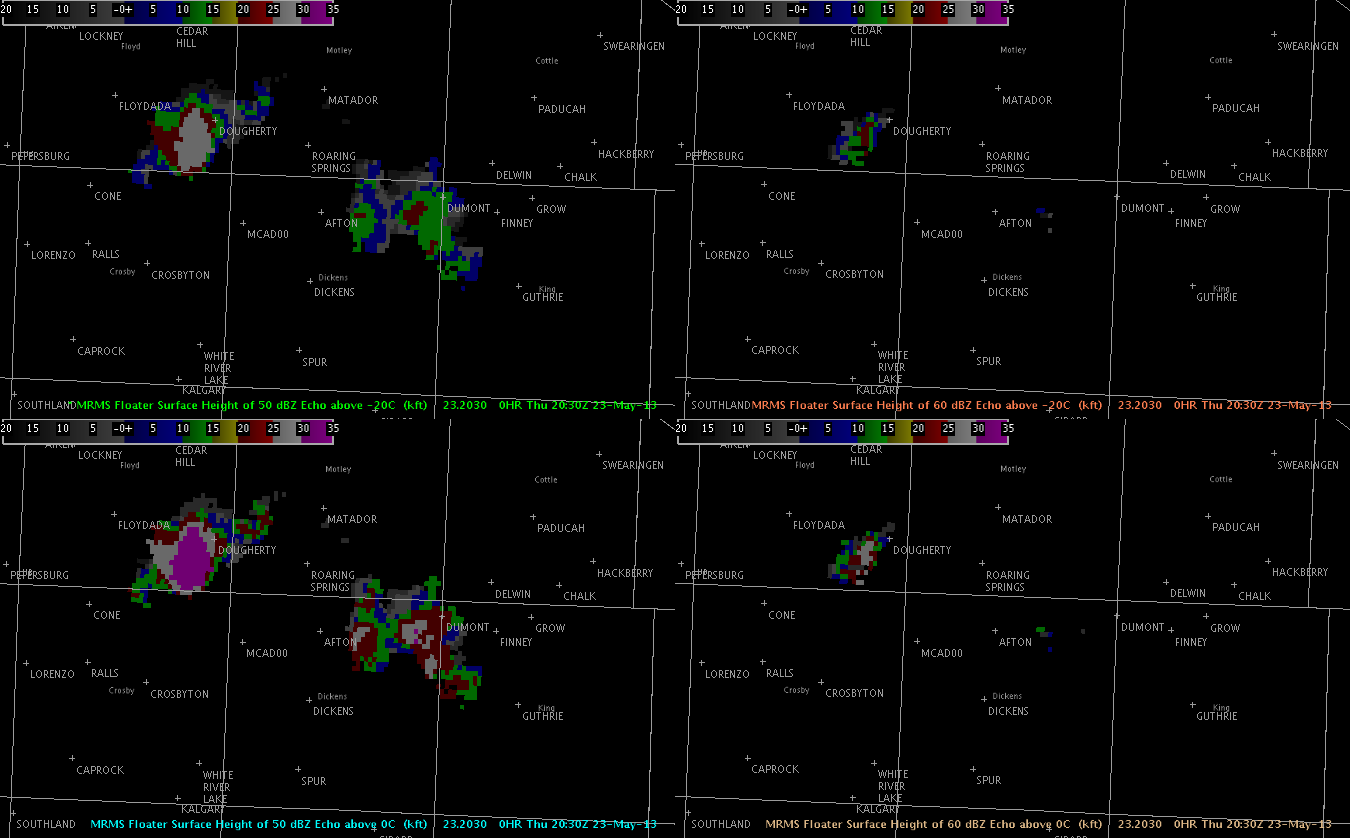
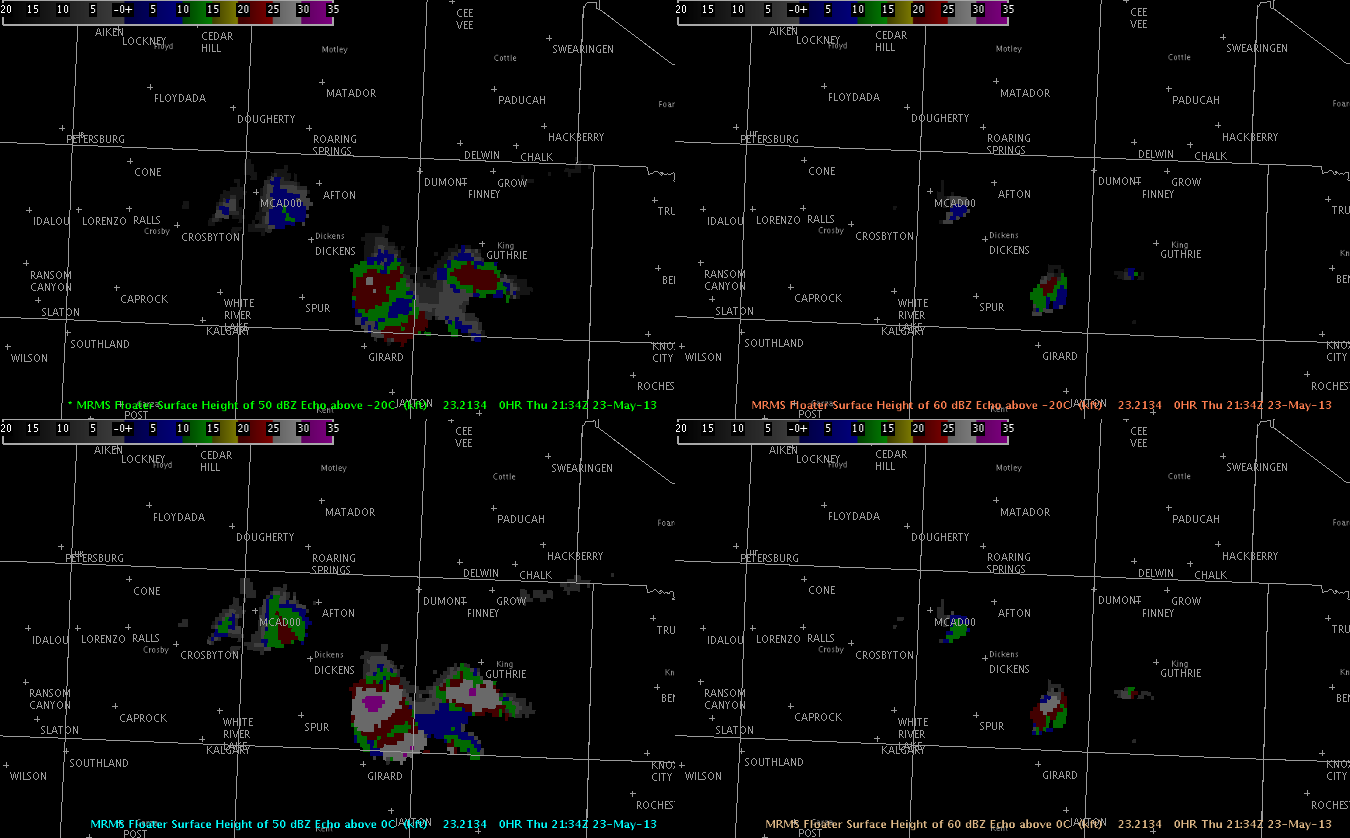
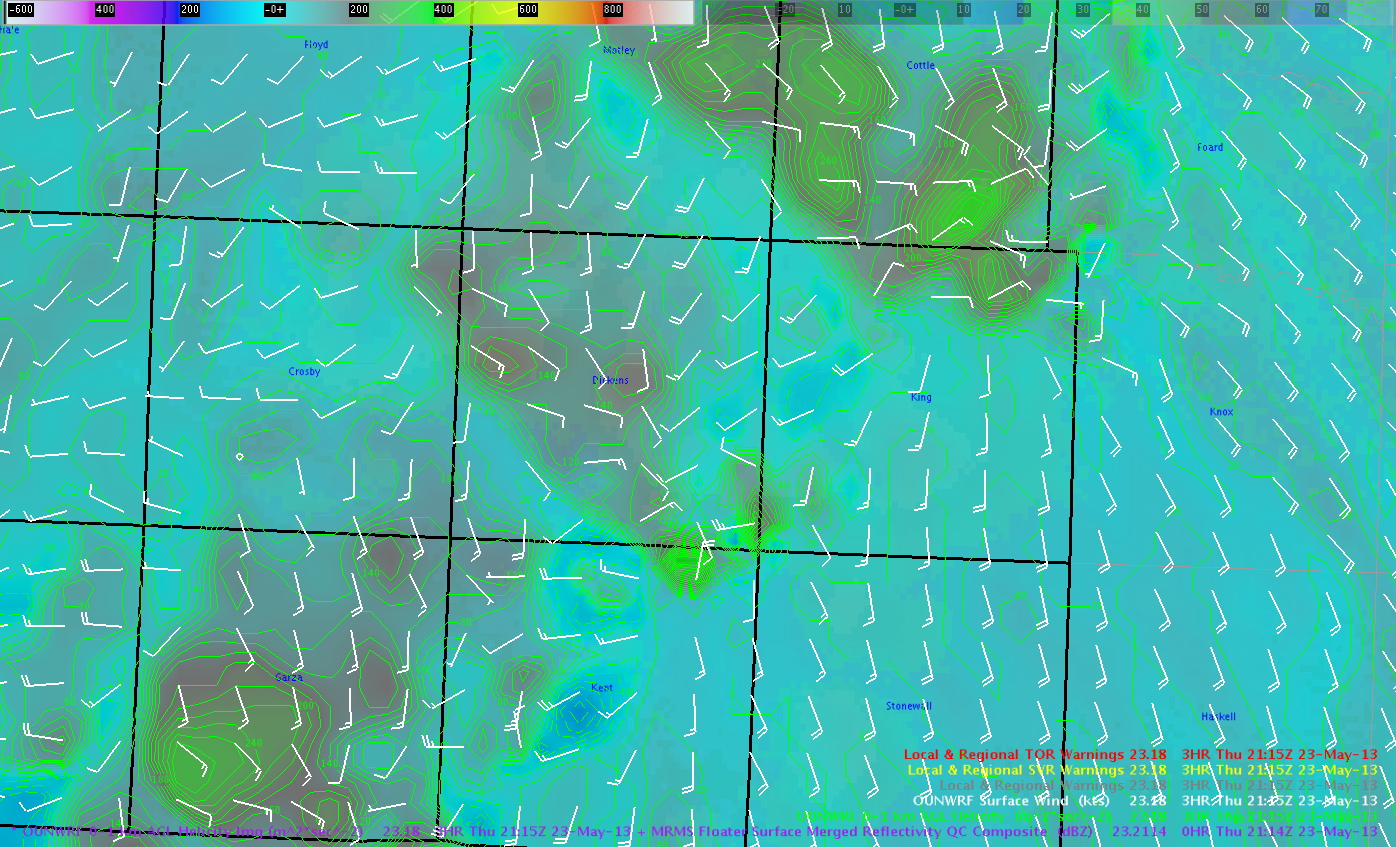
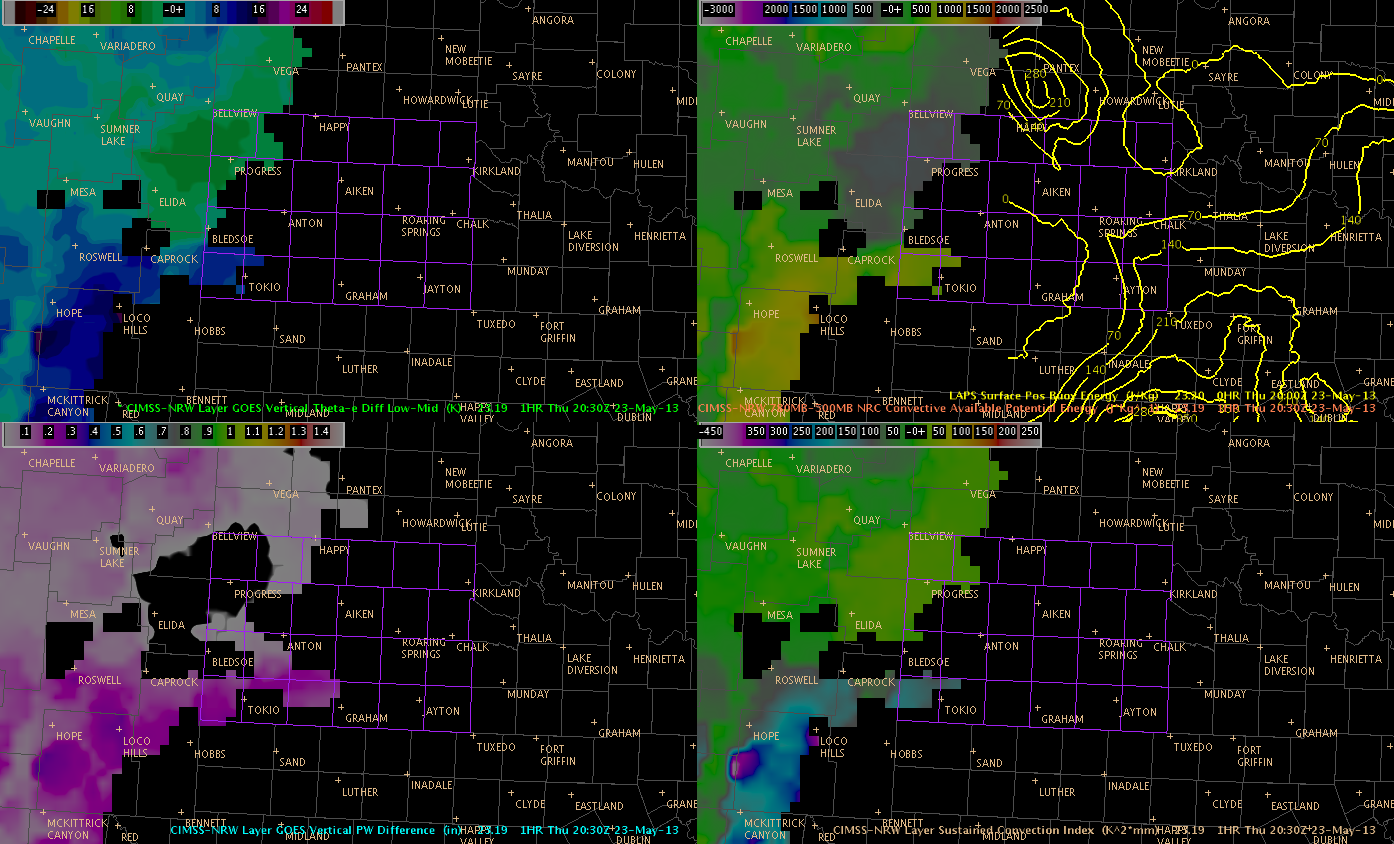
Because storm mode is expected to be supercellular for at least the next couple of hours and possibly longer…significant severe threats of all modes should be expected in the path of this storm.  In addition to continuing to travel along this boundary of rich theta-E air…NEARCAST products indicate a region of substantial destabilization in the path of this storm.

Thurs22ZVerticalThetaEDifference

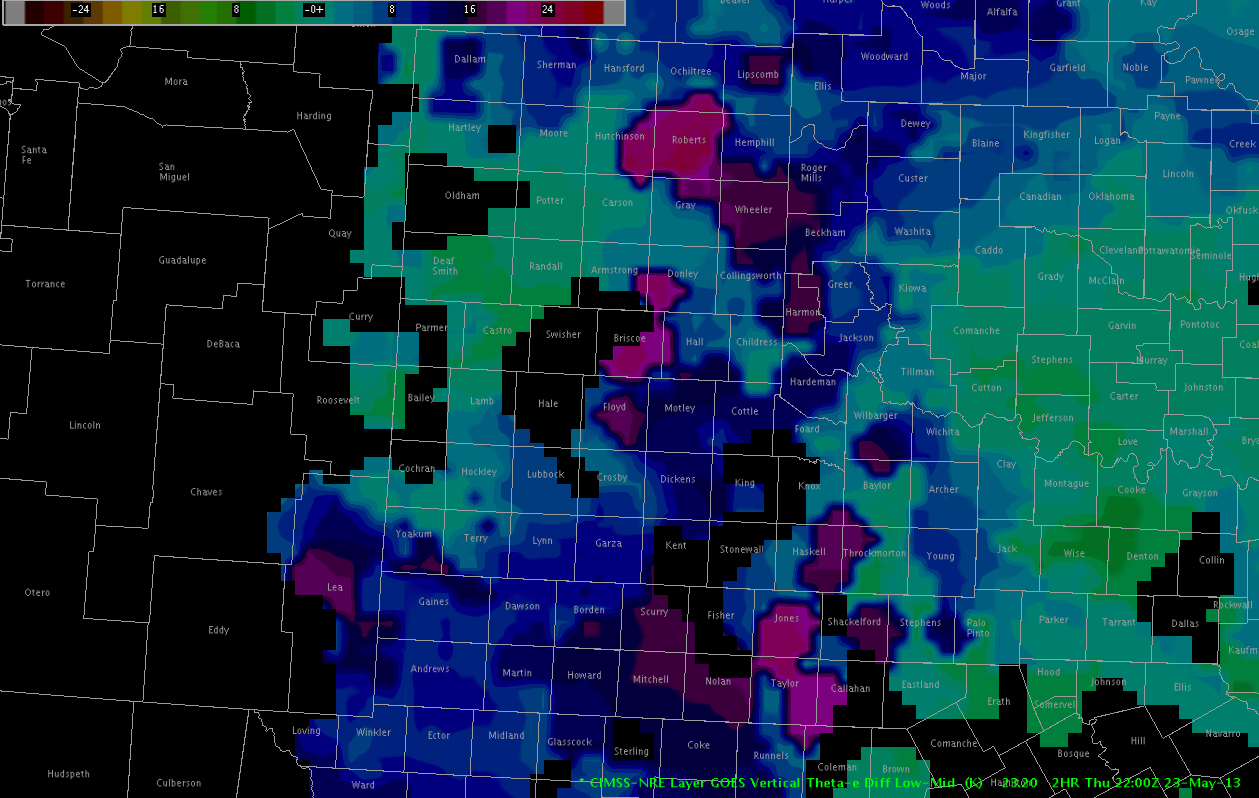
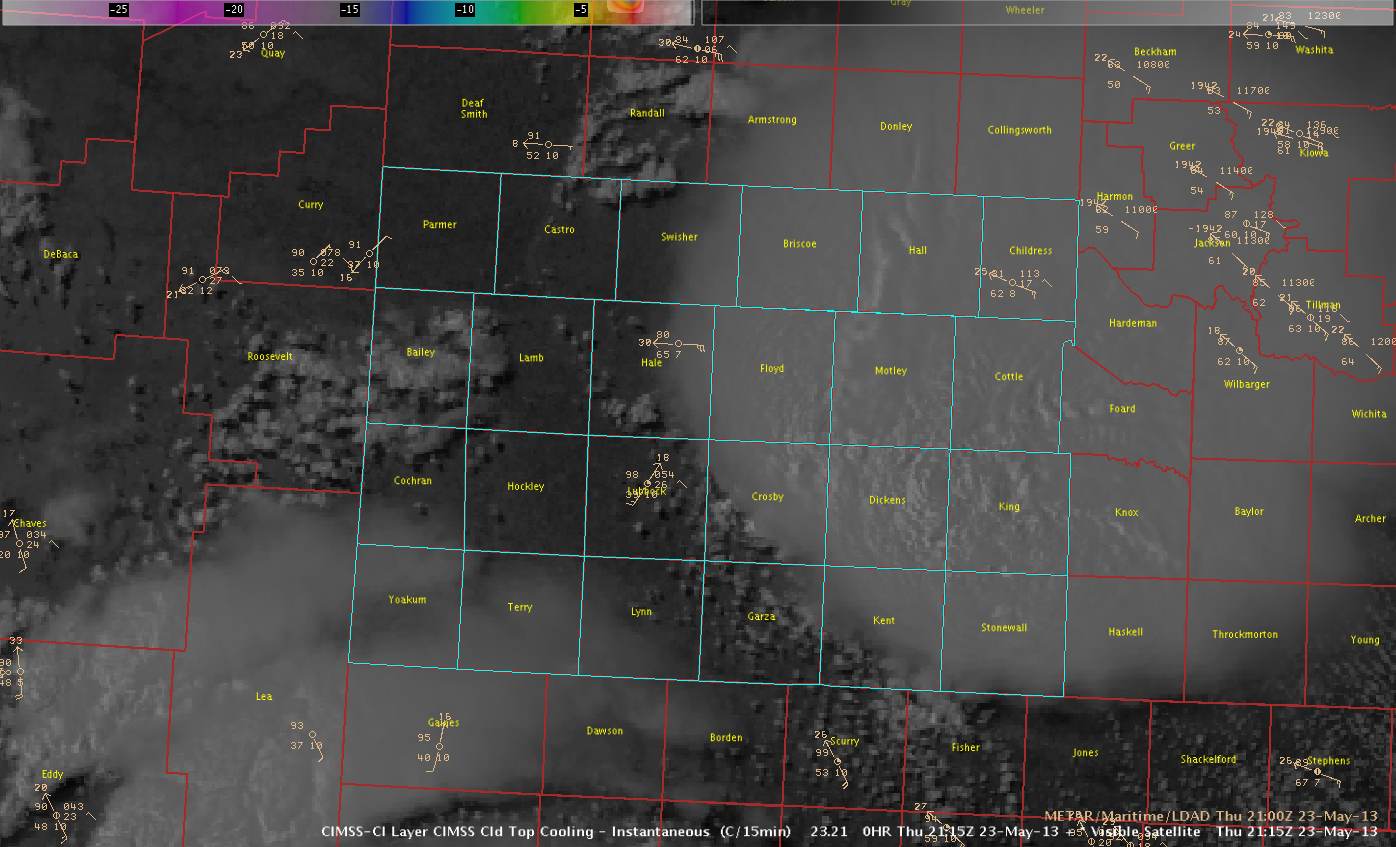
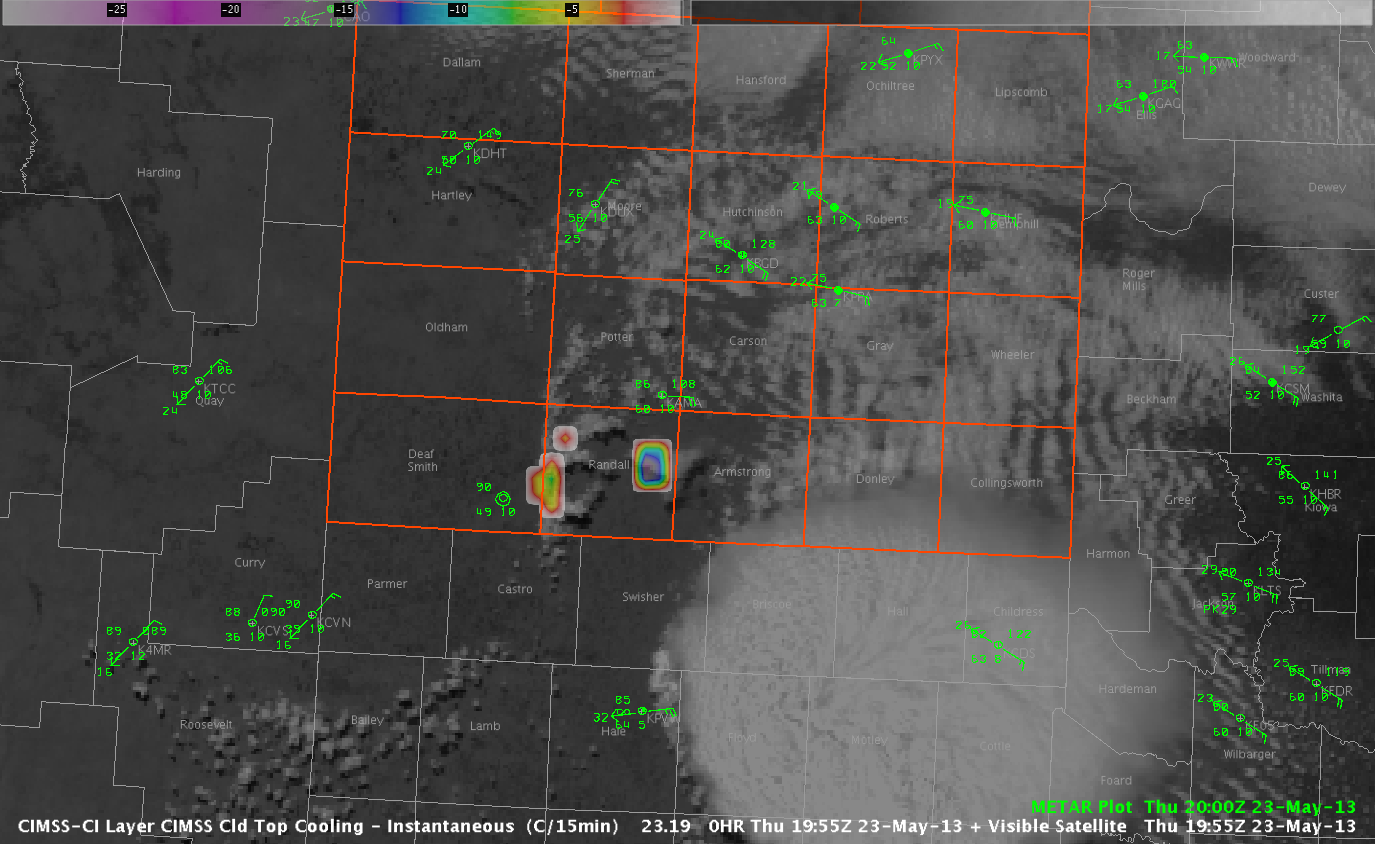
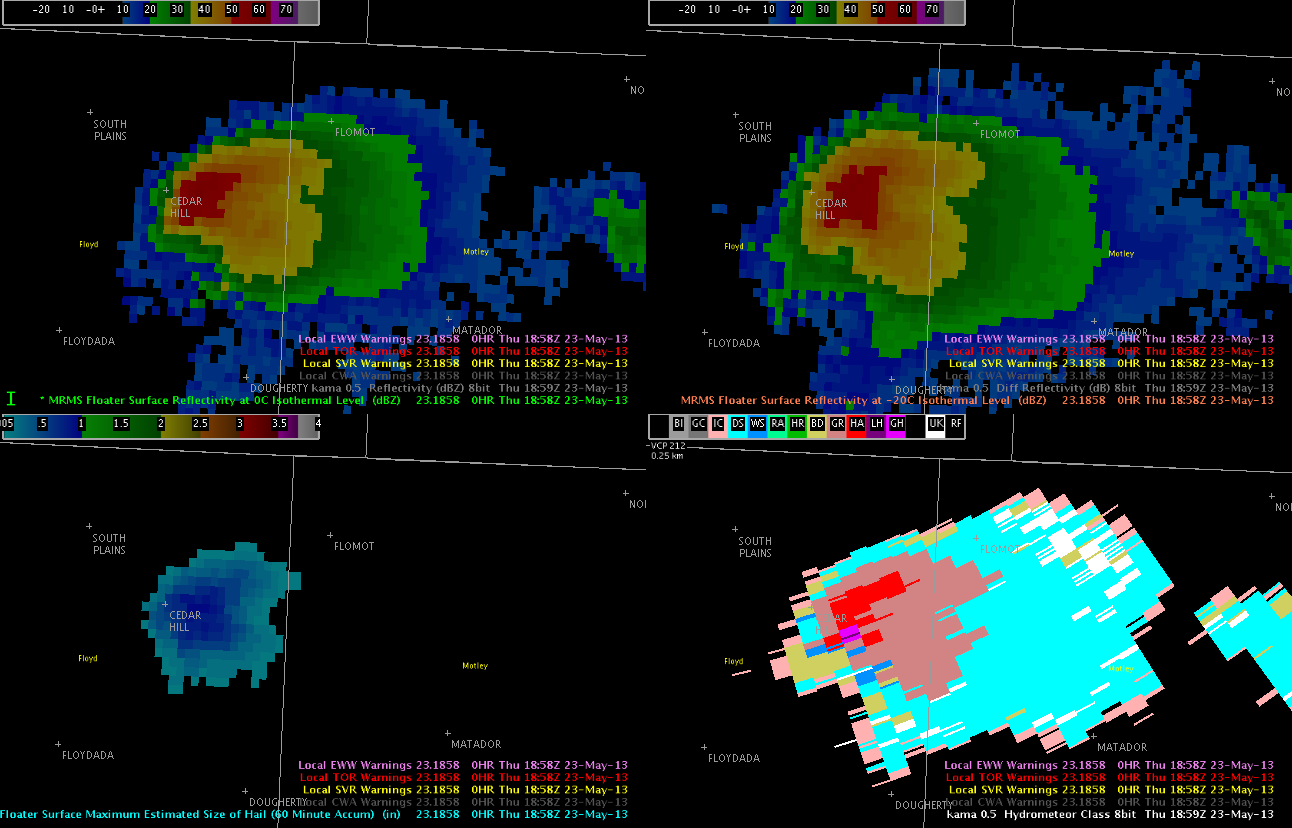
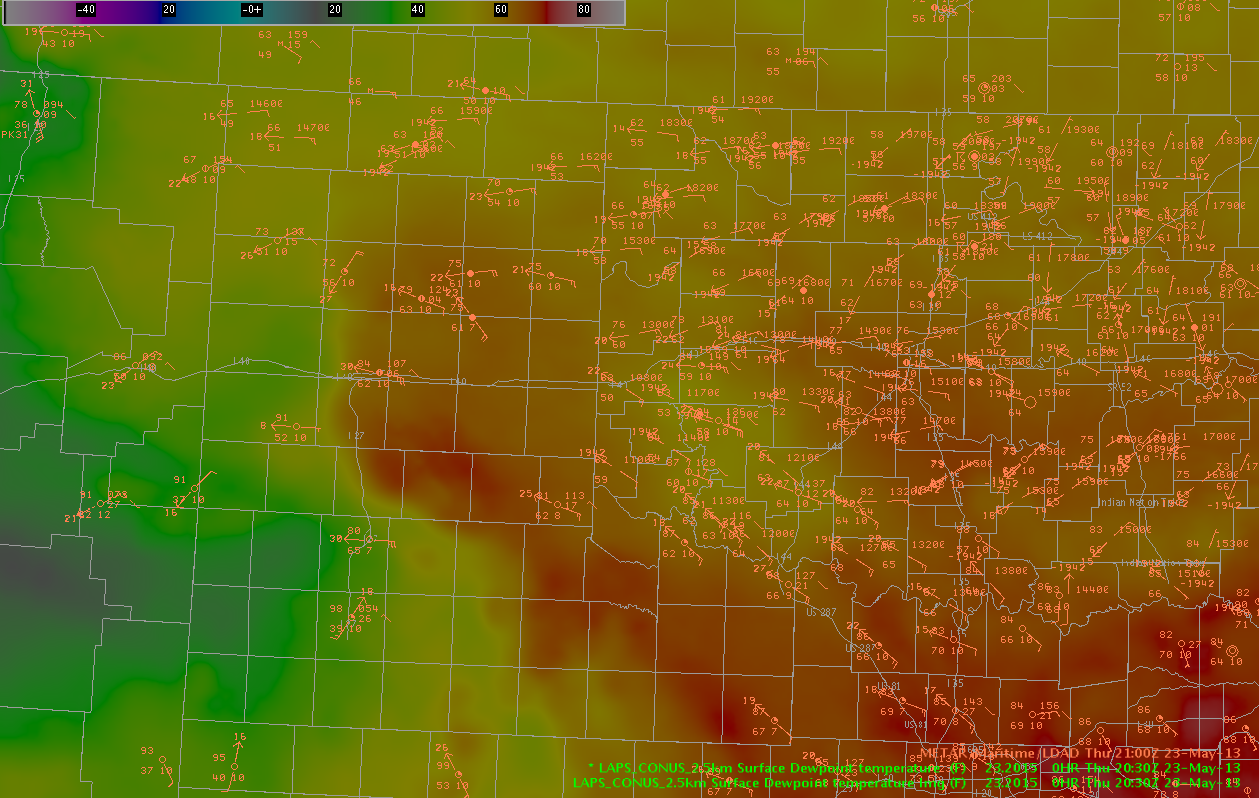
To the north, in the AMA area, potential for convection continues to be monitored to the north where considerable destabilization is forecast by GOES-Nearcast vertical theta-E difference.  A strong outflow boundary has pushed to the north and west of the LBB area storms… which continues to complicate the convective scenario.  Originally…  deeper convection was noted on the Cloud Top Cooling product…  and though the echo has struggled to develop…  lightning and a severe MESH indicator are now noted within an echo in Potter County.  Convection may continue to increase along the outflow boundary in the next couple of hours…  with hail and wind being the main threats.

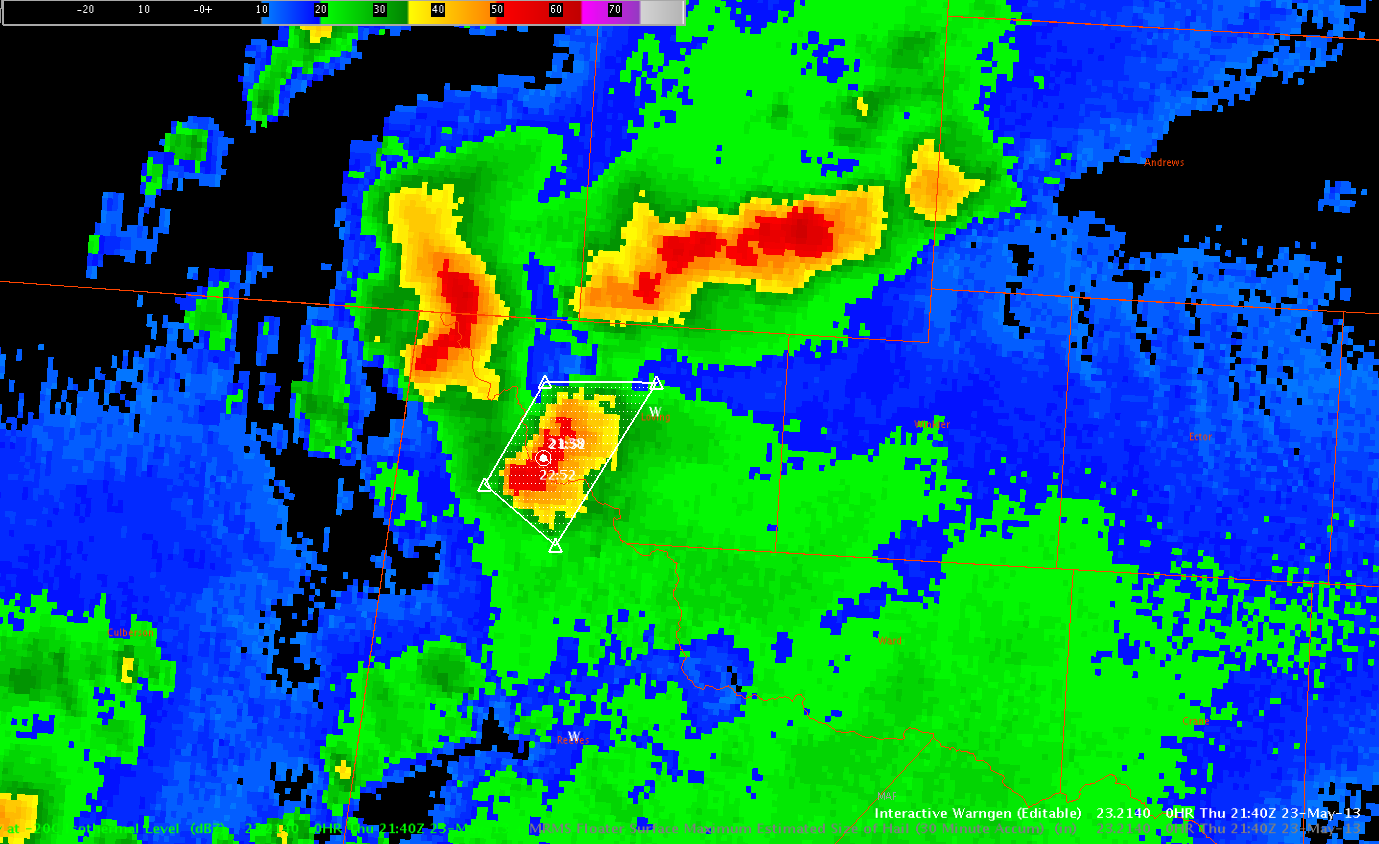
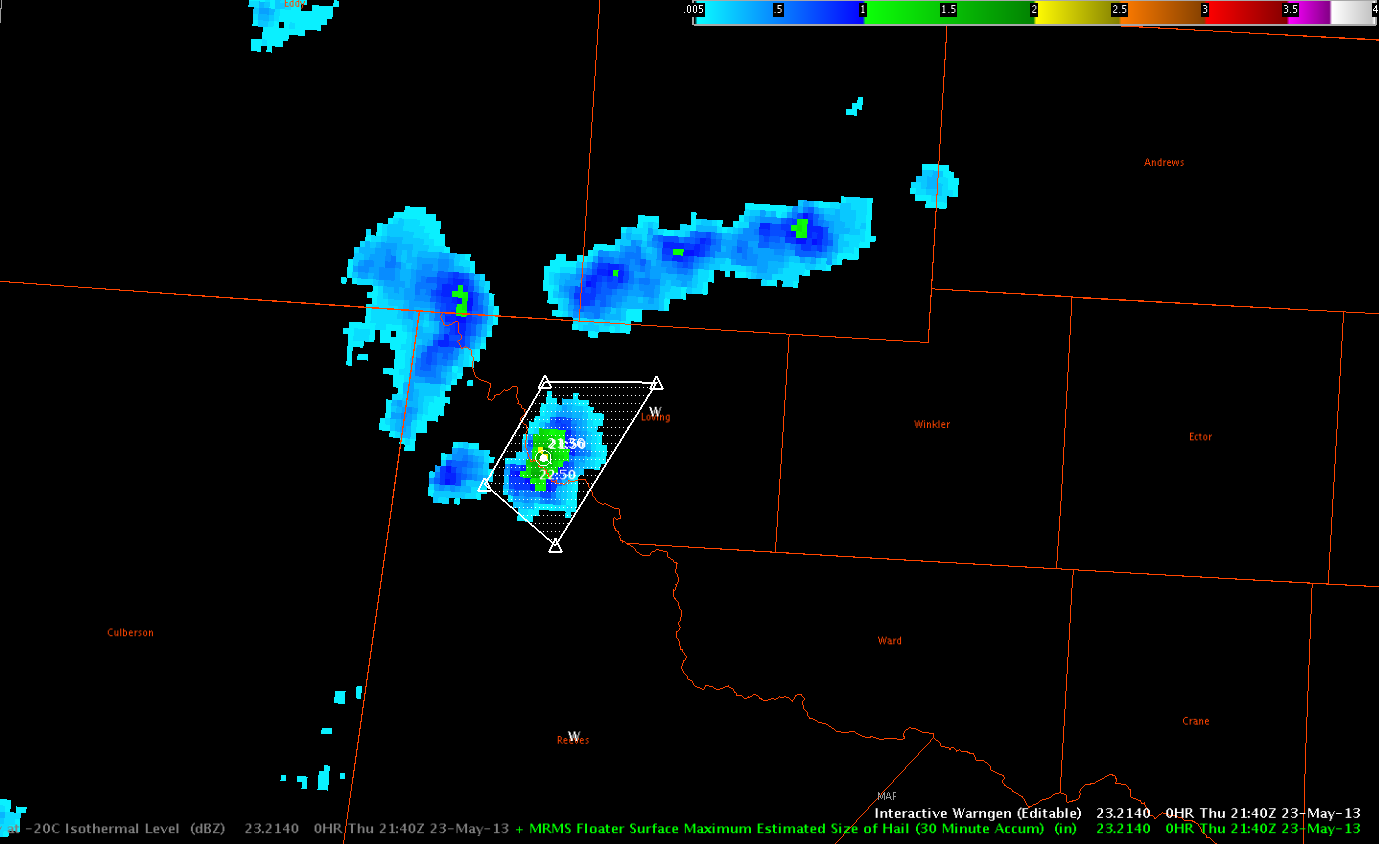
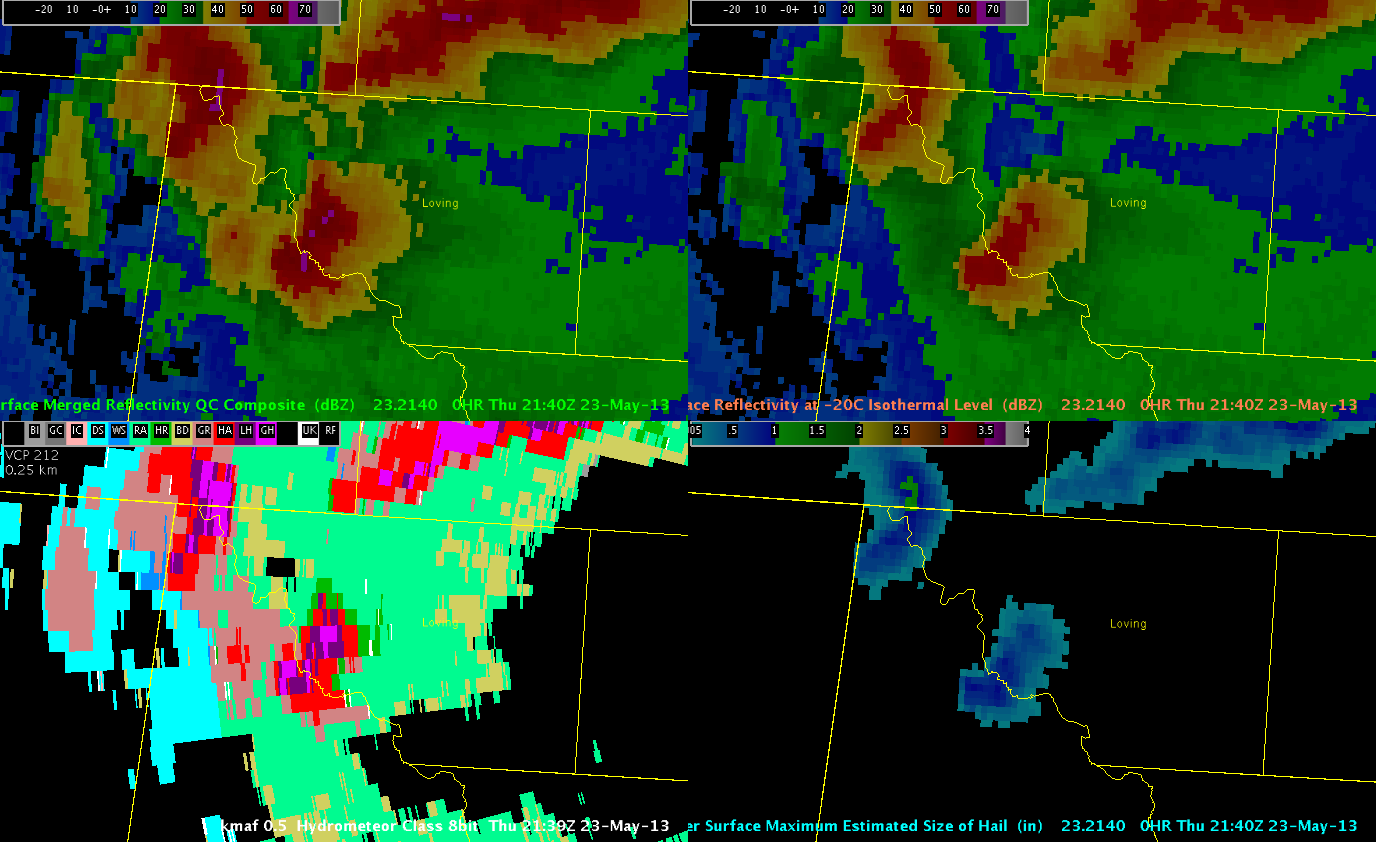
To the south, in the Midland CWA, convection developed in areas of higher terrain and drifted slowly to the north-northeast.  The strongest storm at this time is moving into Andrews County.  These storms have been moving slowly to the north over an atmosphere characterized by dry air…and though the MESH product continues to indicate a threat of hail in the strongest storms…a threat of damaging wind will likely be the primary threat until the storms reach higher moisture.

– Sears/McCormick

Tags: None

Supercells over LUBs CWA (MRMS and HSDA analysis)

The images below show a 4-panel display of the height of the 50dBZ echo above -20C (top left) and above 0C (bottom) right, and the height of the 60dBZ echo above -20C (top right) and above 0C (bottom right).  This time represents the time of the highest MESH values (~3.0in) and indicates the 50dBZ core was over 26k ft above the -20C isotherm and the 60dBZ core was nearly 20k ft above the -20C isotherm.  About an hour later this storm began to collapse with the eastern storm becoming dominant.

2030z_heightabove_4panel2131z_heightabove_4panel

This is the corresponding MESH image corresponding to the top image.

MESH_2030z

At 2132 UTC the HSDA on the eastern storm showed a hail core (indicating giant hail) from the 0.5 degree slice up through the 4.0 degree slice (~30k ft).  This corresponded well with the rotating updraft.  The MESH at this time (not shown) showed 2.83in.

HSDA_05_2132z HSDA_40_2132z

Tags: None

SPORT Flash and Trace Tool Kent Co Texas

Just for you, Kristin! See? I was paying attention. 🙂

On a 4-panel with MRMS Sfc Z, Sfc Vil, and others.

Trace tool was used on upper-left panel and indicated how the flashes increased quickly with severe storm over Dickens, Kent, and Stonewall counties in SE LUB’s CWA.

SPORT_FlashTraceTool

Admittingly, the latter 5 min occurred while I was creating the image, etc, so didn’t redo my centroid there, just the zig-zag bad data.

Martello

Tags: None

Okay…a Quick Change to Midland…

So, with ongoing and potentially severe thunderstorms in the Midland area, I decided to move to Midland!  Well, not really, but virtually.  =)  So, we’ll see how well the MRMS, HSDA and other products work here, and if the pattern recognition I developed on the previous two days will work well here.  Now, I am expecting a dearth of reports way out here in west Texas, unless they have some cameras strapped to a rattlesnake or a jackrabbit.  Anyway, after transferring over, and getting products set up as quick as I could, I quickly issued my first warning based mostly on the MESH and 60 dBZ reflectivity values at -20C.  This warning was issued for the affecting the western portions of Loving and the far northern portions of Reeves Counties.

Image 1.  MRMS -20C Reflectivity, with resulting warning polygon.
Image 1. MRMS -20C Reflectivity, with resulting warning polygon at 2140 UTC.
2140UTC_MRMS_MESH
Image 2. 2140UTC MRMS MESH 30 min accumulation.

Following is a four panel of various MRMS parameters and the 0.5 degree HC.

Image 3.  MRMS data at 2140UTC and KMAF data at 2139 UTC. Upper left - MRMS merged reflectivity QC composite, upper right - reflectivity at -20C, lower right - MRMS MESH, lower left - KMAF 0.5 degree HC
Image 3. MRMS data at 2140UTC and KMAF data at 2139 UTC. Upper left – MRMS merged reflectivity QC composite, upper right – reflectivity at -20C, lower right – MRMS MESH, lower left – KMAF 0.5 degree HC

Notice that the MESH product in the lower left no longer indicates sever hail, however, the 0.5 degree HC algorithm clearly shows some giant hail signals.  This storm had undergone recent weakening and the MESH 30 minute accumulation had indicated severe size hail within the previous 30 minutes.  The severe hail still may had been reaching the ground by the time I was able to load up the data.  So, I went ahead and issued the warning.  We’ll see if we get any reports from this storm…but I’m not too positive.

Kris

Tags: None

TOR Potential Increasing Rapidly Across SE LUB CWA

KLBB radar reflectivity really ramped up 2115Z and MRMS Low-Lvl Rotation Track also indicated increasing in intensity of the low level mesocyclone. See images below. Low-Lvl Rotation Track Prog was used for the TOR warning.

KLBBZ2116Z

LUB_MRMSRotation_TrackLow

Though the low-level circulation was increasing and ramping up, it wasn’t “gate-to-gate” on the SRM just yet at 2115Z on KLBB.  Nevertheless, OUN_WRF indicated high 0-1KM SRH forecast values in the next hour on the order of 300-400 m2/s2 where the dangerous part of the storm was headed, thus went straight to a tornado warning due to the conducive environment. (See below images).

KLBBSRM_2115Z

LUBOUN_WRF21115Z

We still continue to watch our northern counties below the old MCS outflow boundary, as the air is only slightly cooler, shallow, and remains conditionally unstable with extremely backed easterly surface winds.

VIS_Obs_CTC

Wow, what a day.  My favorite (due to being more comfortable and the type of storms) ALL WEEK!!

Martello/Zimmerman

Tags: None

50dbz Echo Top and Height of 50dbz above -20C

I’m pretty excited about the 4 products displayed below. We have displayed below the 50 and 60 dbz echo top products as well as the height above -20C of the 50 and 60 dbz echo. These products allow for quick analysis and use of the Donovan method of determining hail size. Many offices in the central plains look closely at the heights of the 50 and 60 dbz echoes in warning decision making. Therefore, these tools are extremely beneficial for both initial warning decision making on whether to go with a warning or not. They also help to give confidence in increasing the projected hail size as these 50 and 60 dbz cores grow well above previously established basic severe level thresholds of the day.  The storm depicted in the image below had golf ball size hail reported with it.

Wesely50and60dbzheight

Tags: None

Still Watching and Waiting in Amarillo…

Ok, well we’ve gotten some recent cloud-top cooling amounts from clouds in Randall County, TX.  Cloud top cooling rates as low as -17C/15 min were observed in Randall County as the outflow boundary moved across the area, as indicated in the image below.

Image 1.  GOES Visible image and CIMSS Cloud Top Cooling valid 1955 UTC. METAR observations are included.
Image 1. GOES Visible image and CIMSS Cloud Top Cooling valid 1955 UTC. METAR observations are included.

Also, notice the rather distinct theta-e ridge still present and extending into Randall County. per the LAPS data (image 2 below).  We’ll see if these products allow for an appropriate focus and help predict likeliest locations for eventual development.

Image 2.  2014 UTC MRMS Merged Reflectivity QC Composite and 2015 UTC LAPS 2.5km Sfc Theta-e.  METAR observations are included.
Image 2. 2014 UTC MRMS Merged Reflectivity QC Composite and 2015 UTC LAPS 2.5km Sfc Theta-e. METAR observations are included.
Tags: None

For LUB’s CWA, Watch Out Garza and Eastern Lynn Counties (SW of Current Supercells)!

Watching for potential development SSW of current supercells over Floyd, Dickens, and King counties to the NE. CTC shows potential. Cirrus anvil across the NE CWA will likely inhibit any CTC effectiveness. LUBCTC2015Z

Unfortunately, GOES_CIMSS Nearcast (either E or W) data did not extend further enough east across the LUB CWA to be effective with this event. (see 2030 UTC CIMSS W projection below).

LUB_CIMSSNearcast*

If the Garza area was to develop quickly, the OUN_WRF project indicates 0-1KM SRH to 200-260 m2/s2 which mean environment would be favorable for rapid rotation and potential tornadoes like earlier storms to the north.

LUBOUNWRF2130Z

We continue to monitor development closely.l

Martello/Zimmerman


Tags: None

Warning Decision MESH vs HSDA vs Alltilts vs -20C

Slide 1: 1855Z Based on Donovan method we would be issuing a severe thunderstorm warning when the 50 dbz core reached 26,000 to 28,000ft based on a freezing level of around 10,000 to 10,600ft agl. This would have been enough for me to issue a thunderstorm warning at 1855z.

AllTilts

Slide 2: 1858Z HSDA shows large hail for the 1st time.

HSDA1859Z

Slide 3: 1902Z MESH indicates 1″ hail for the 1st time.MESH1902Z

Slide 4: 1918Z The -20C level gets a 60dbz return for the 1st time.

20C1918Z

Summary Verification: Our 1st quarter size severe hail was reported at 1923Z with the first Golf ball size hail report at 2004Z. There was lead time no matter, which method or combination of methods would have been used on warning for this storm. The MRMS products did offer a quicker diagnostic overview of the storm than having to look at multiple height scans as we commonly do with the Donovan method.

Wesely

Tags: None