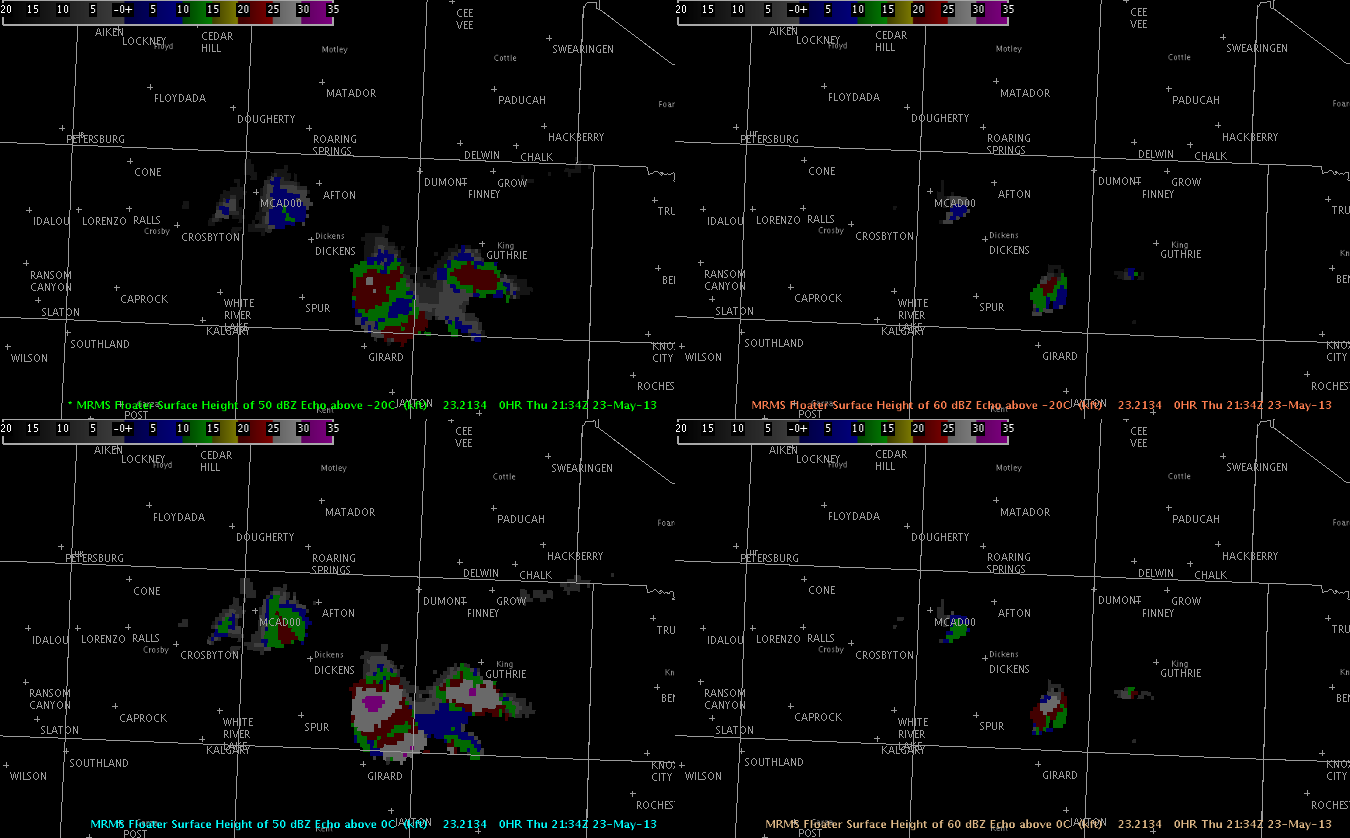
The images below show a 4-panel display of the height of the 50dBZ echo above -20C (top left) and above 0C (bottom) right, and the height of the 60dBZ echo above -20C (top right) and above 0C (bottom right). This time represents the time of the highest MESH values (~3.0in) and indicates the 50dBZ core was over 26k ft above the -20C isotherm and the 60dBZ core was nearly 20k ft above the -20C isotherm. About an hour later this storm began to collapse with the eastern storm becoming dominant.
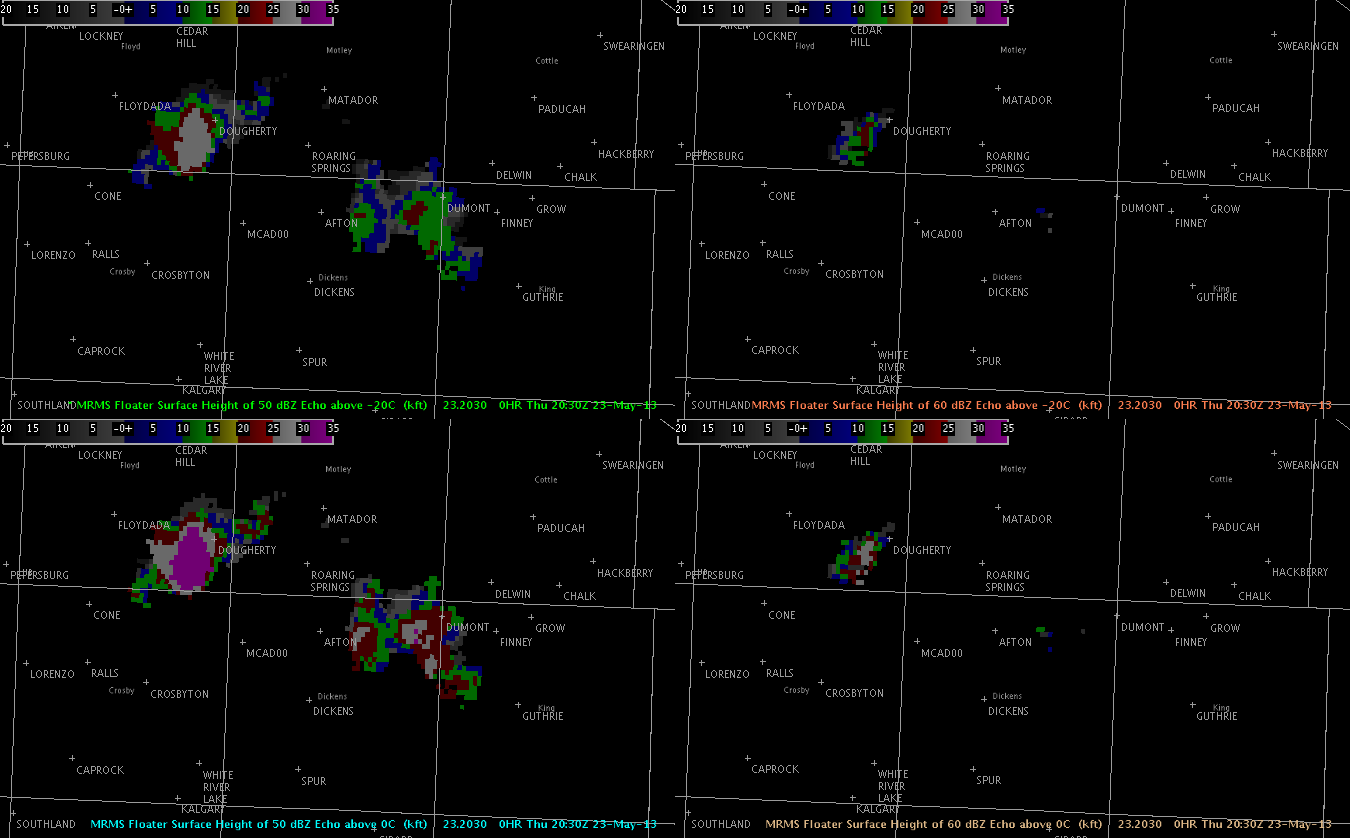
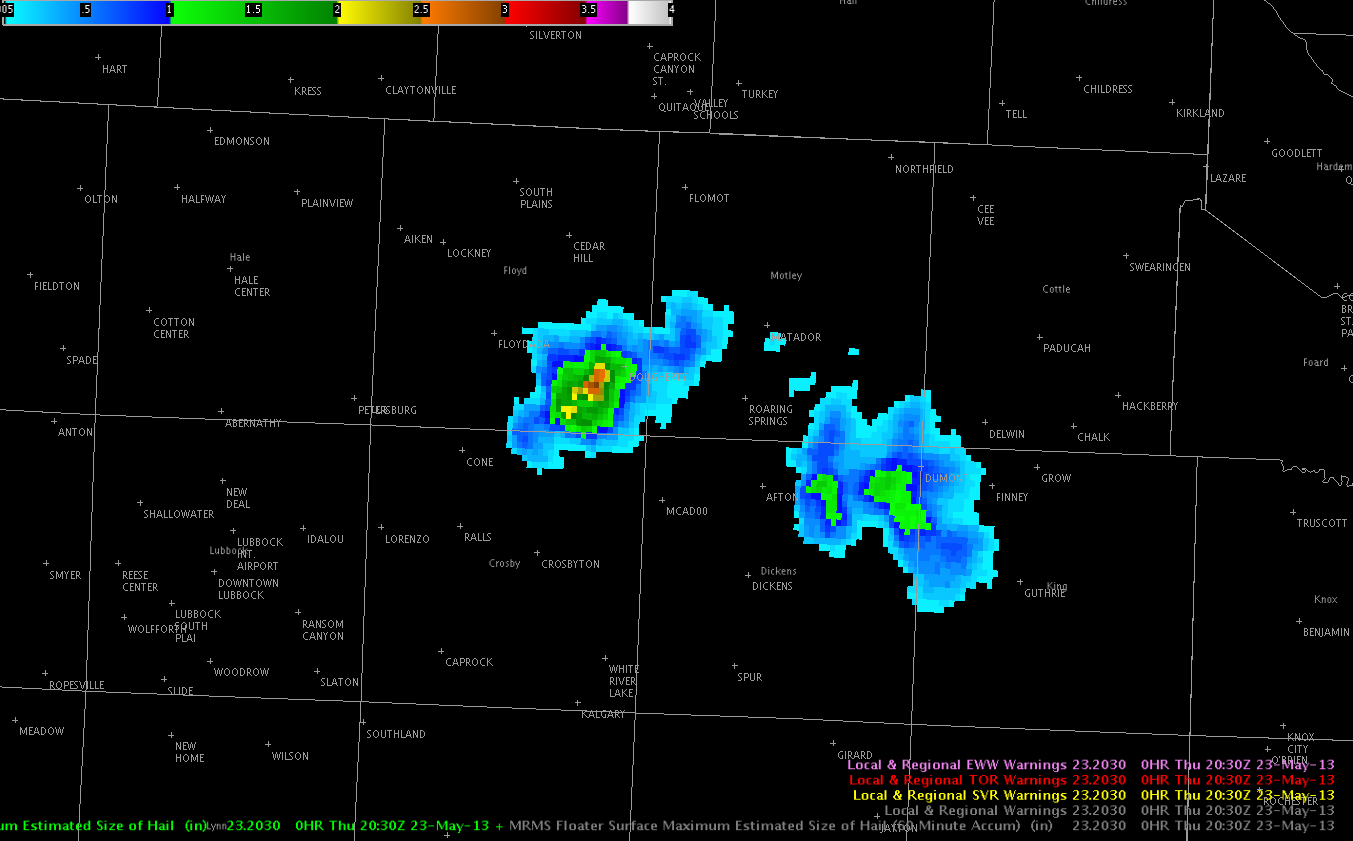
This is the corresponding MESH image corresponding to the top image.
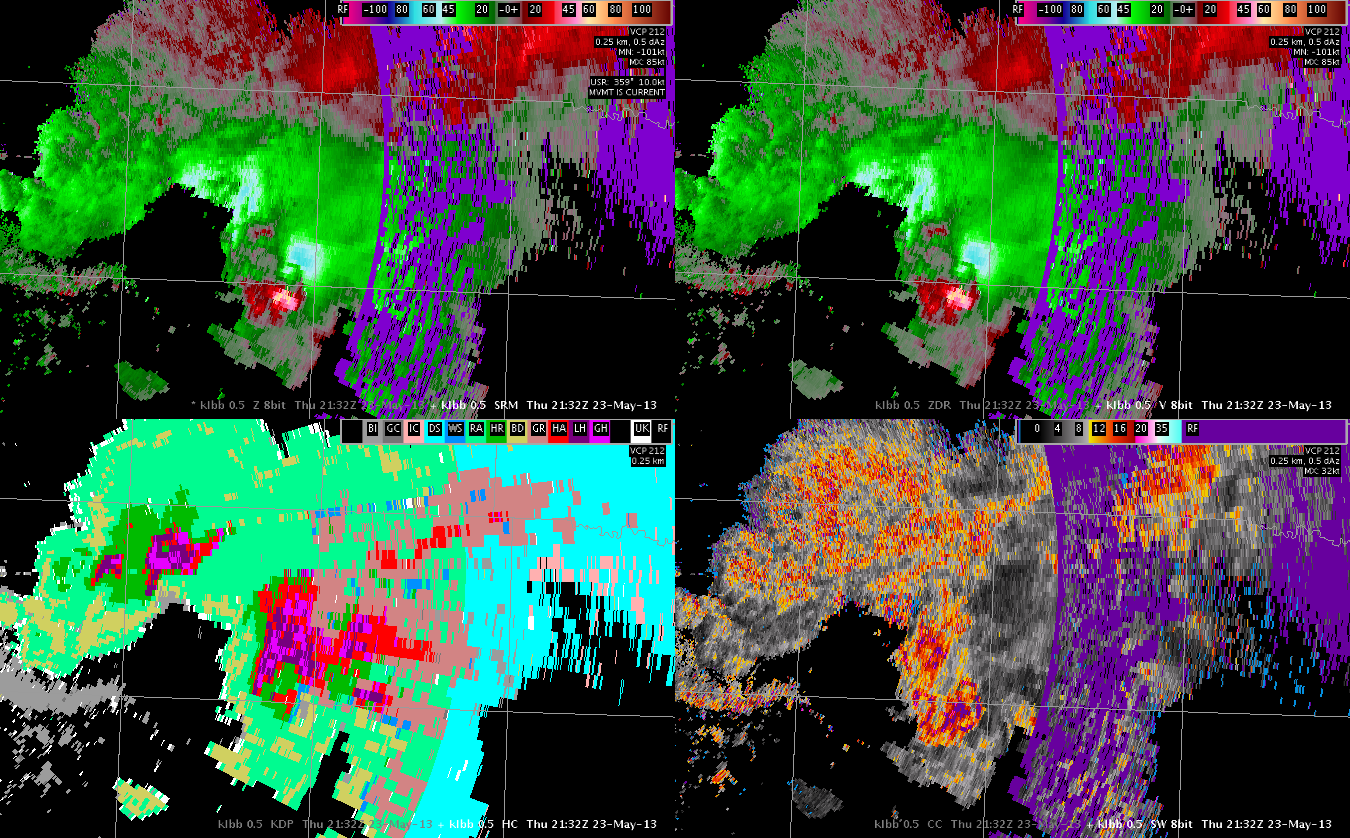
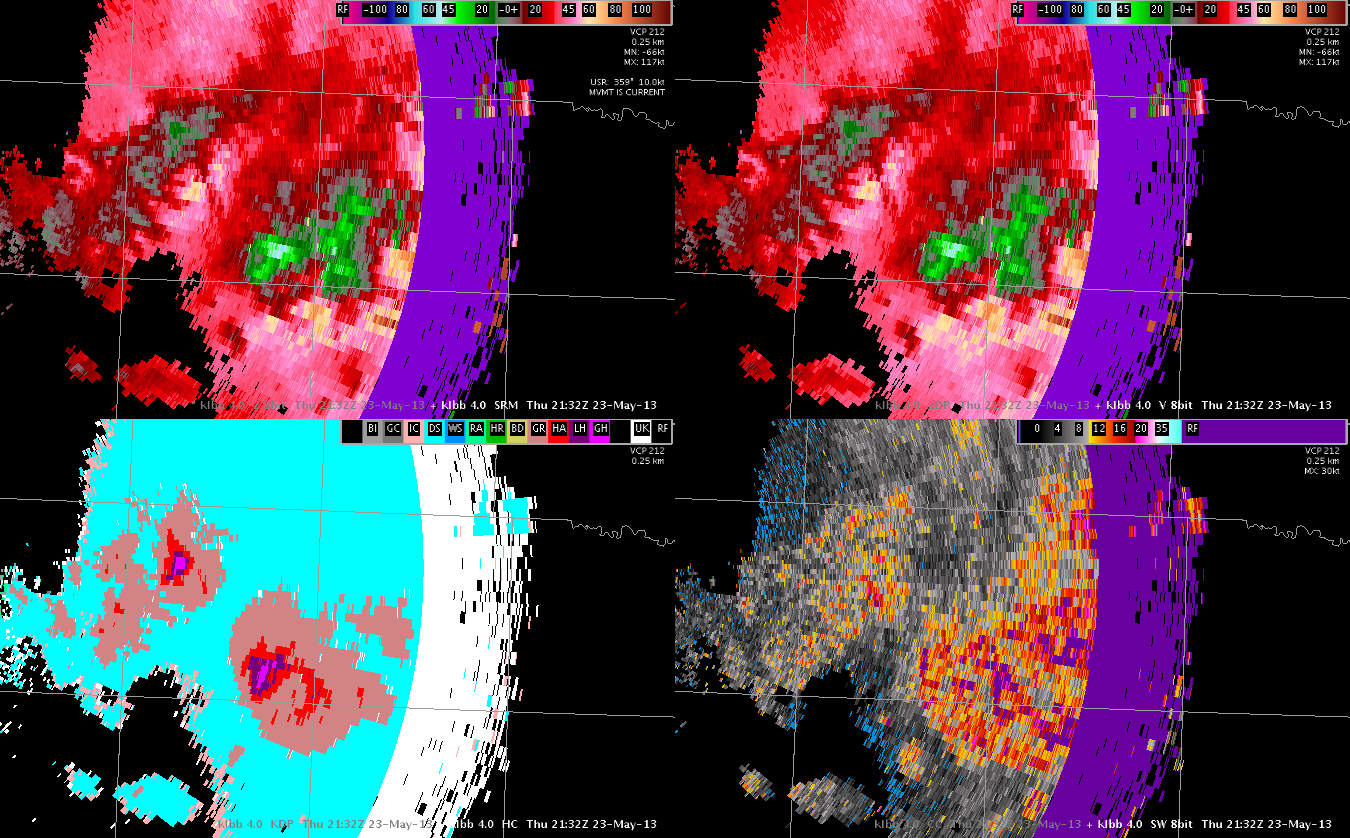
At 2132 UTC the HSDA on the eastern storm showed a hail core (indicating giant hail) from the 0.5 degree slice up through the 4.0 degree slice (~30k ft). This corresponded well with the rotating updraft. The MESH at this time (not shown) showed 2.83in.