PHS and GLM Data for Tampa Florida this Afternoon and Evening

General Risk for Thunderstorms in Florida this Afternoon and Evening

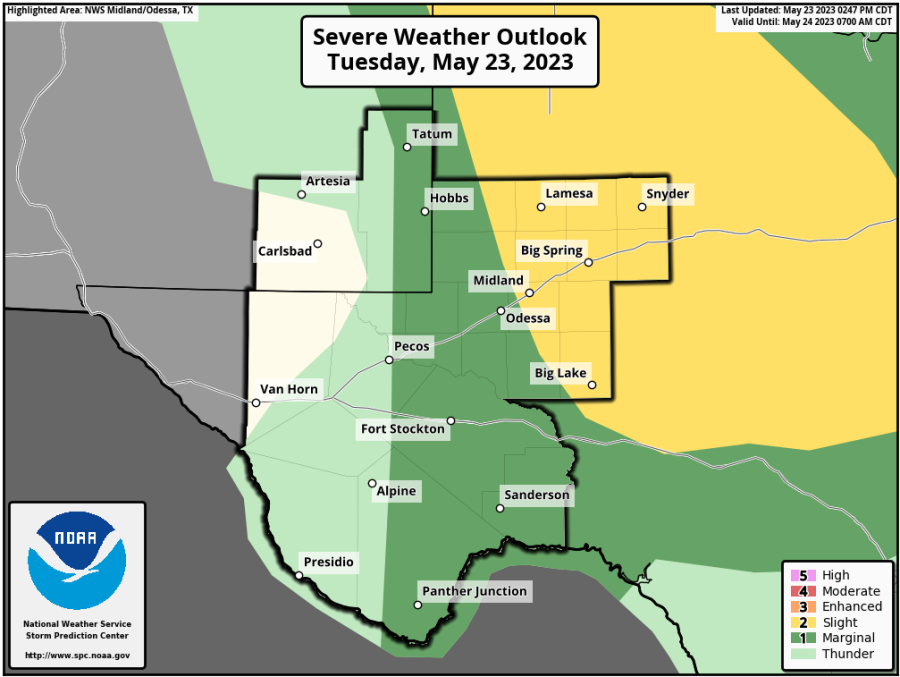
The Tampa CWA is in a general risk for thunderstorms this afternoon and evening per the SPC.

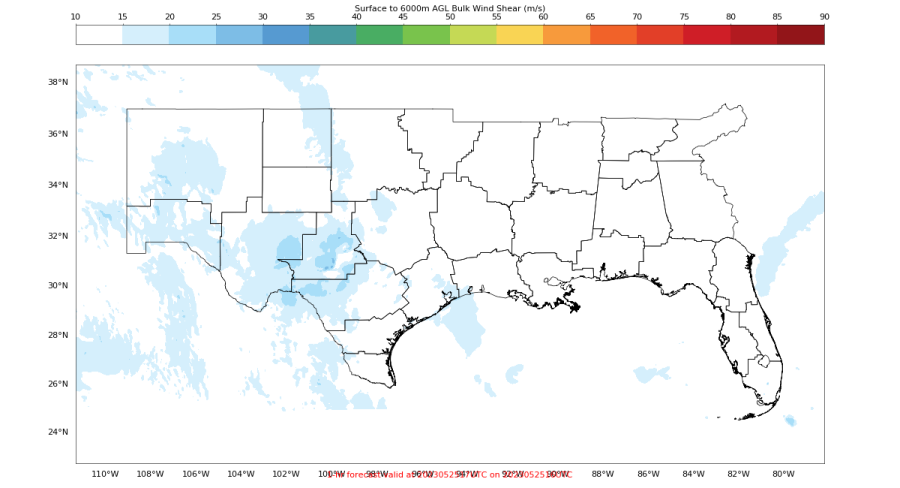
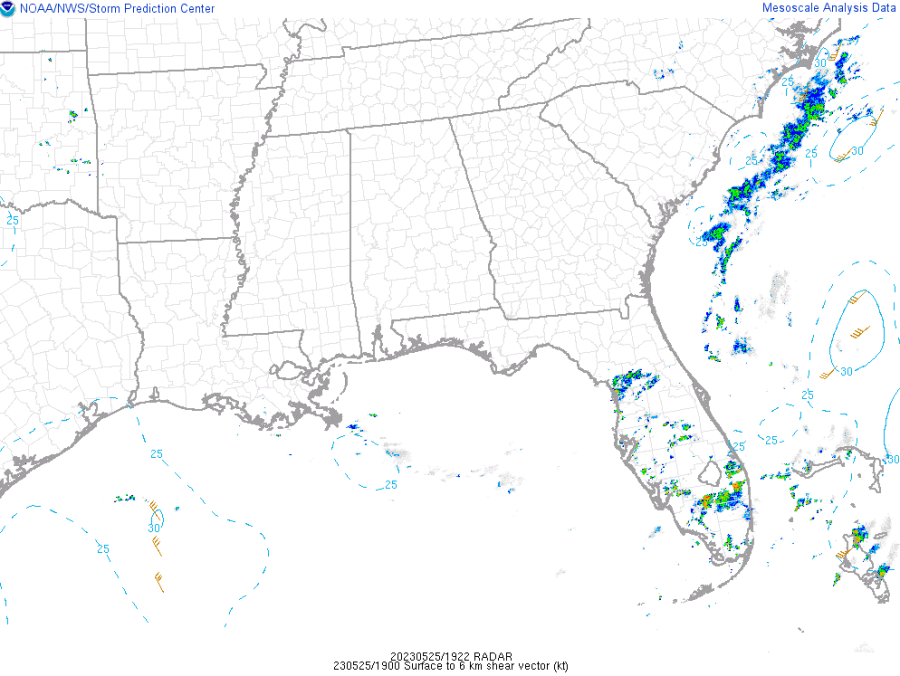
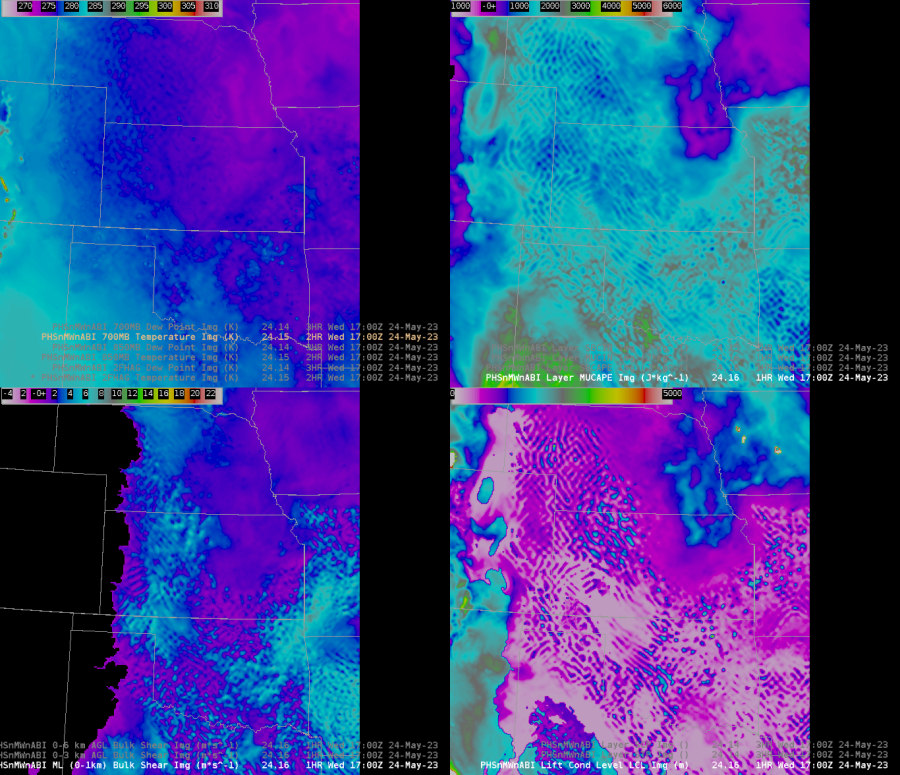
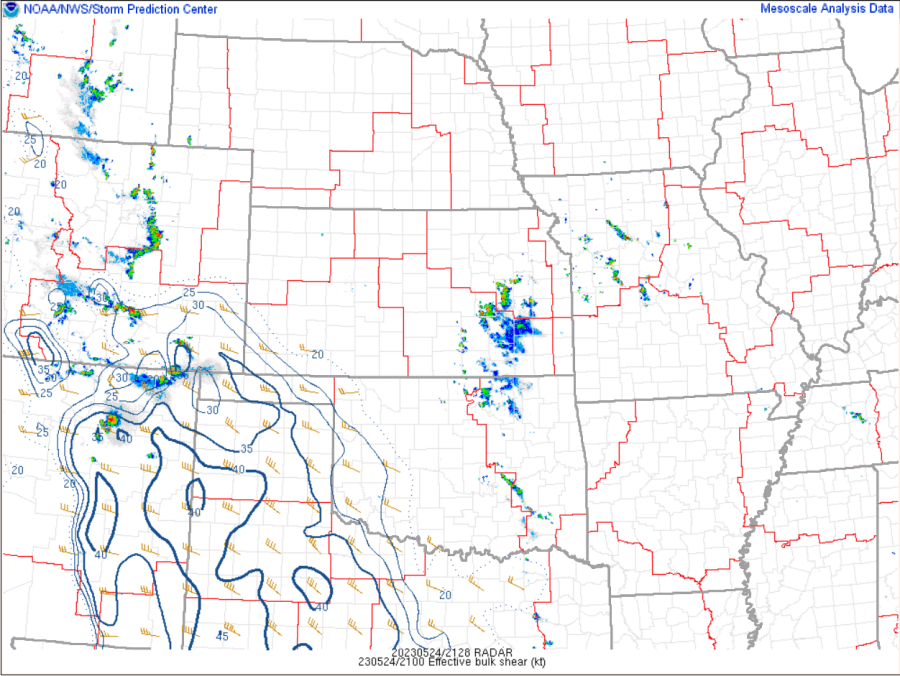
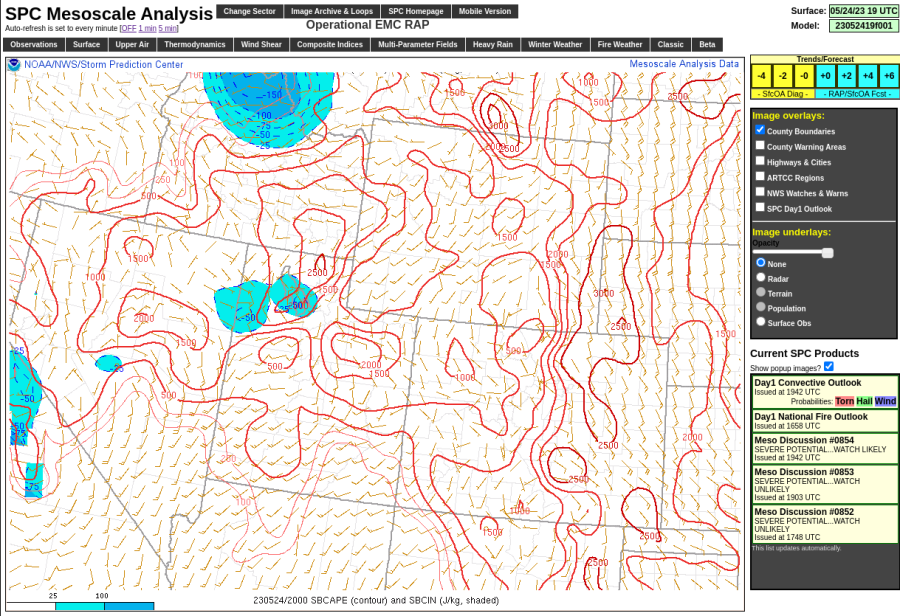
The main potential impacts are frequent lightning, heavy rainfall, and gusty winds thanks to decent amounts of SBCAPE.  Localized flooding  also remains possible, especially in urban areas,  due to slow storm motion as PHS shows no 0-6 km Bulk Shear over Florida. This matches well with the latest SPC Mesoanalysis which also shows no 0-6 km Bulk Shear shear over the region.

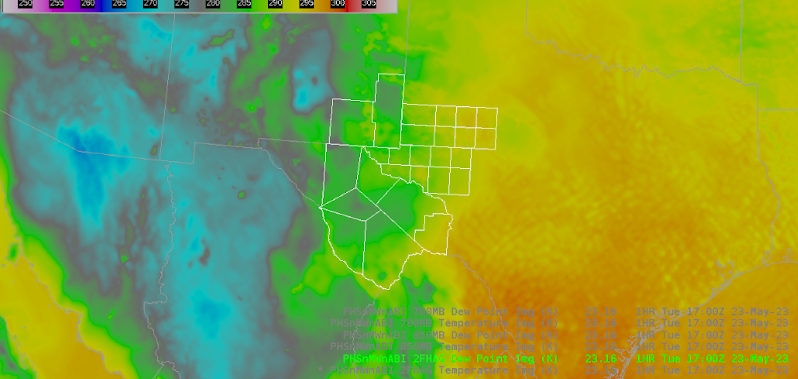
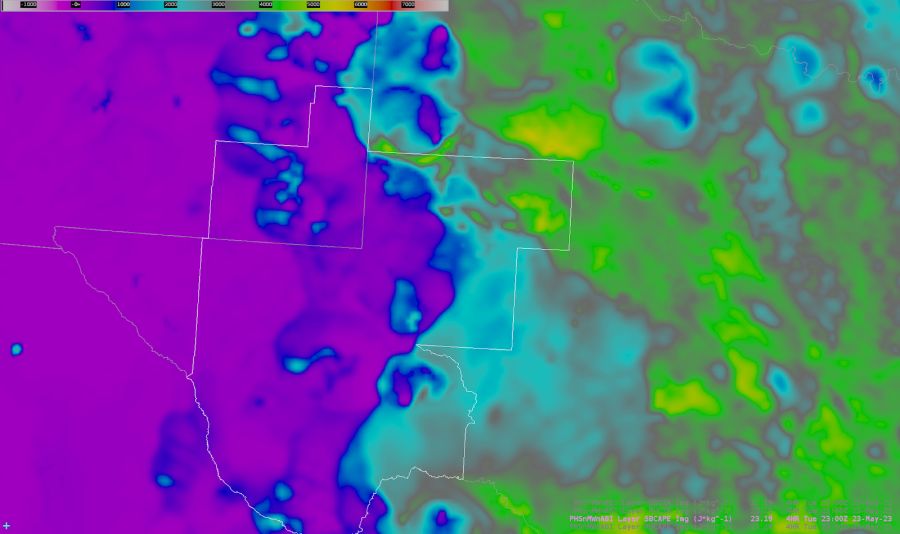
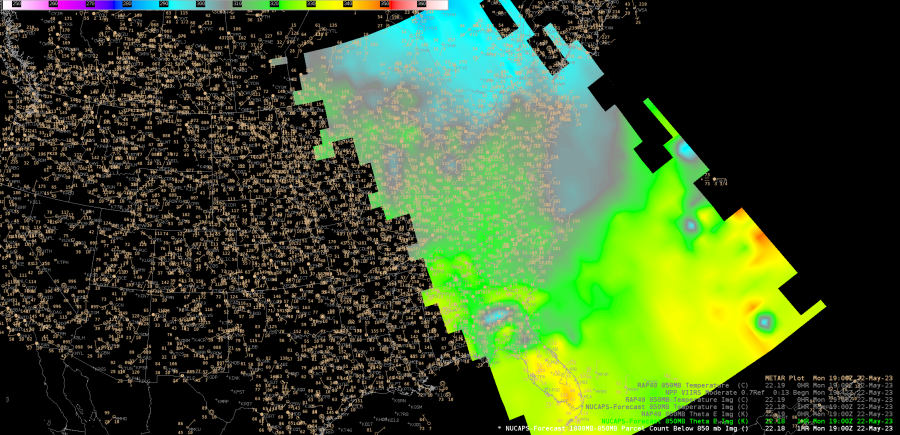
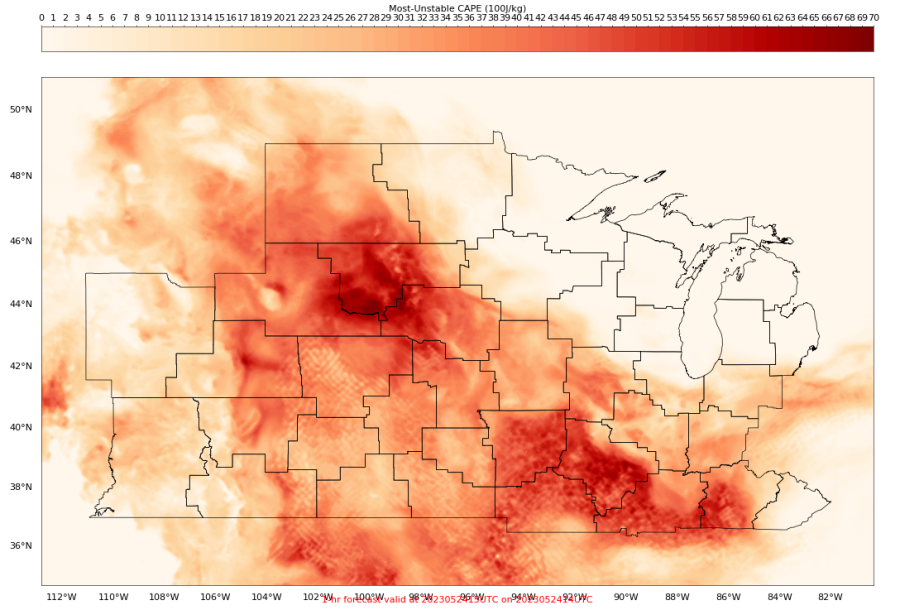
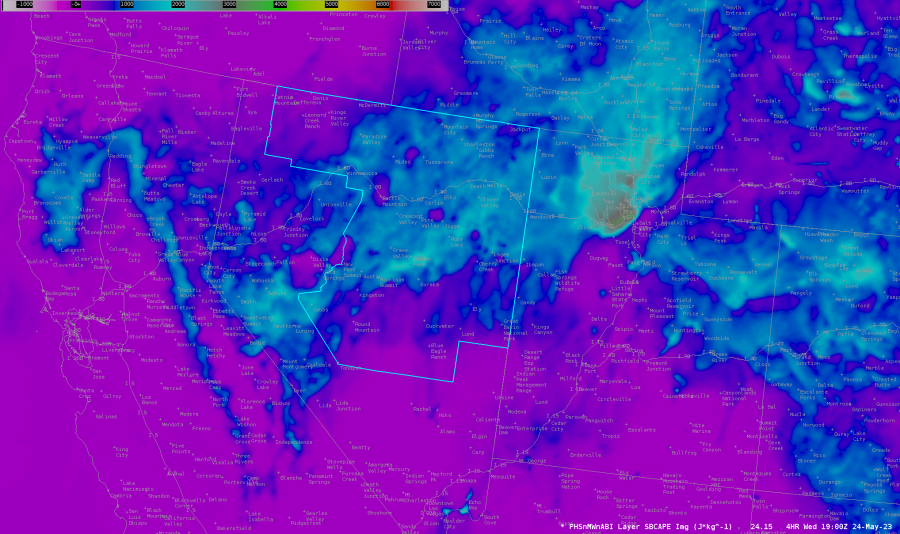
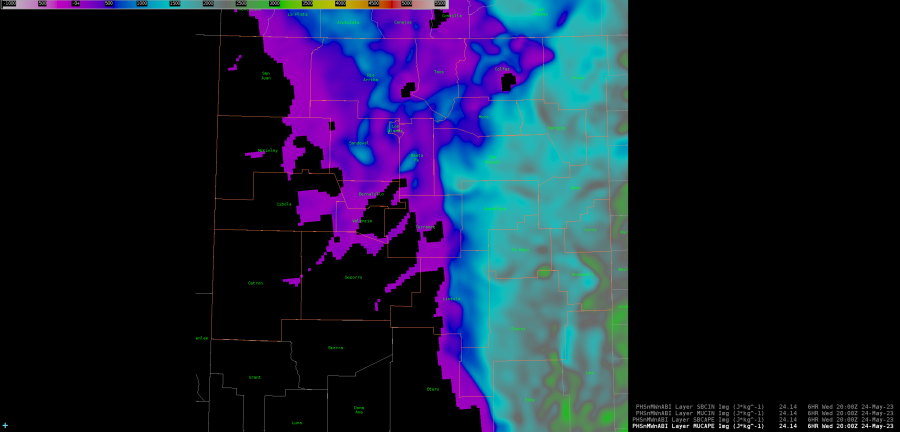
NUCAPS showing SBCAPE values at 21Z. Values are highest across the central and southern portions of the Tampa CWA. Areas in green had values around 1600-1700 J/kg. Areas in teal show values ranging from 800-1400 J/kg. Areas in purple range from 200-300 J/kg.  
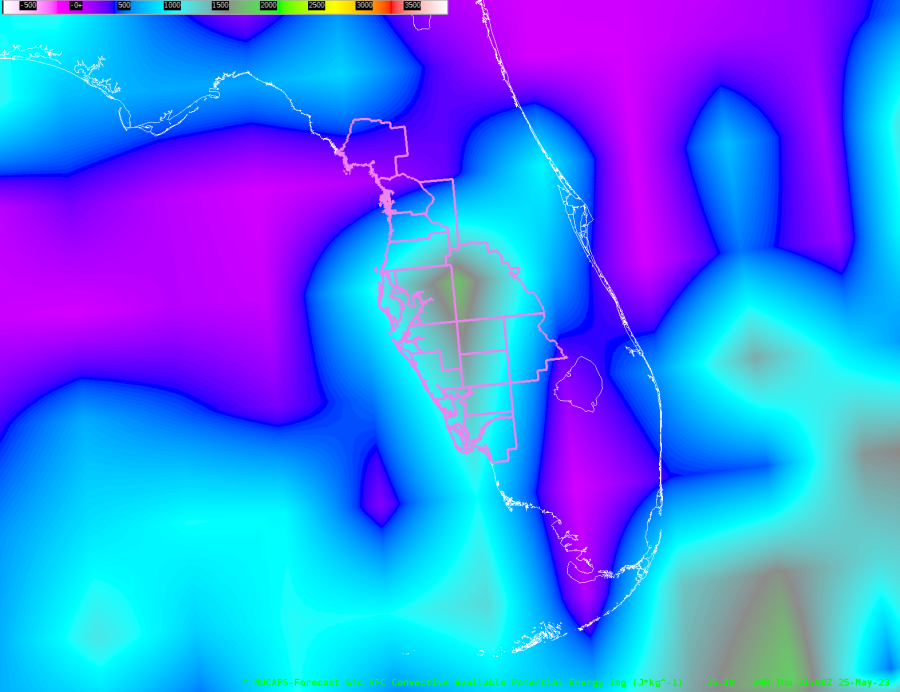
PHS shows a similar trend to NUCAPs with higher areas of SBCAPE across the central and southern CWA with lower values across the northern half of the CWA. However, the color scale on the online version of PHS is difficult to interpret as the gradient ramps up from light red to dark red. So, you cannot really pinpoint specific values of SBCAPE. However, you are able to see areas of lower SBCAPE and areas of higher SBCAPE at a glance. 

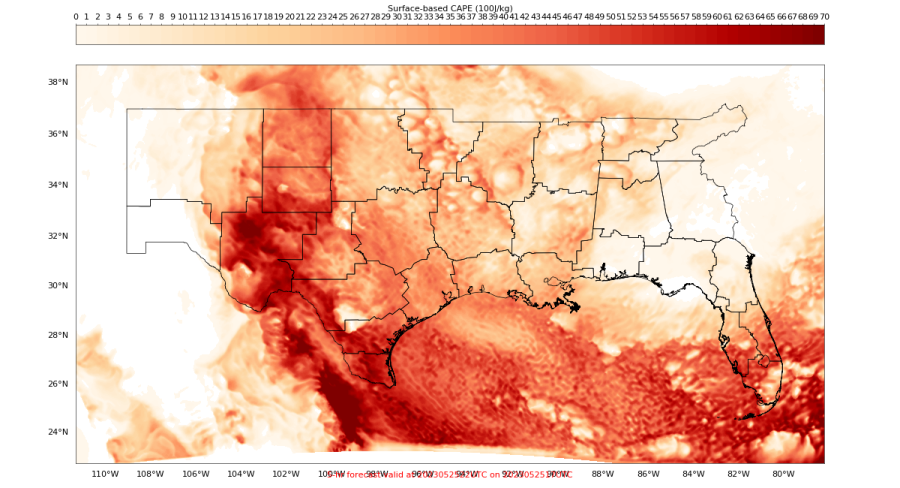
ProbSevere version 3 increases our confidence that storms will remain generally sub-severe as ProbSevere values are below 10% across the Tampa CWA as of 1930Z.
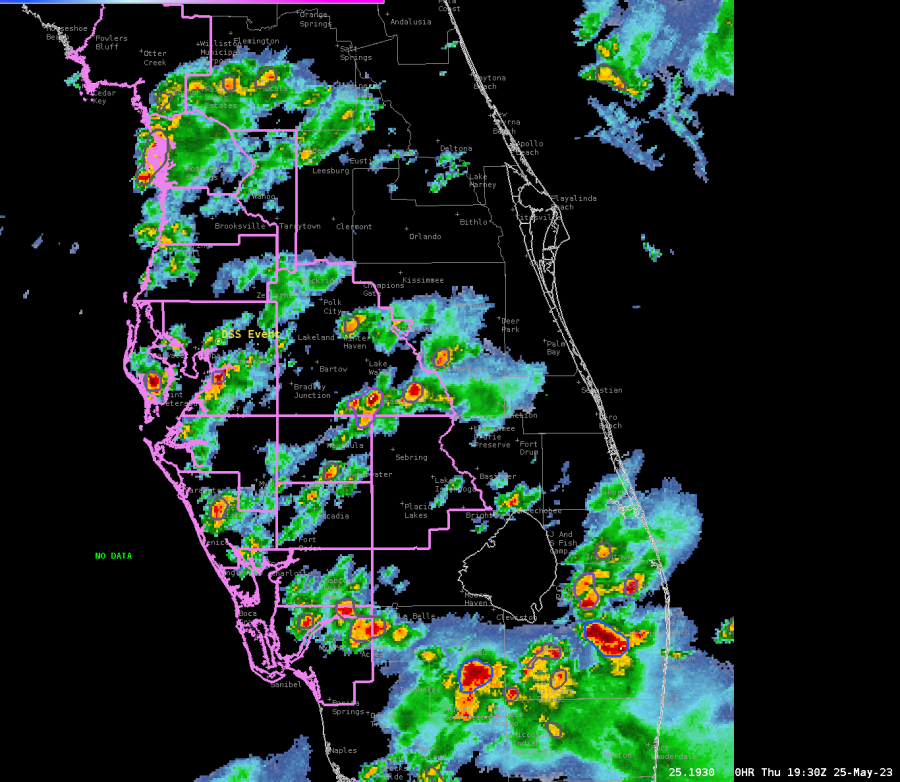
The Octane Speed Sandwich product further confirms that storms are remaining below severe limits as the strongest storms are noted over southeastern Florida this afternoon as of 1930Z. Not only do these products help us pinpoint areas of potential severe weather, but they also help us pinpoint areas of sub-severe weather.  
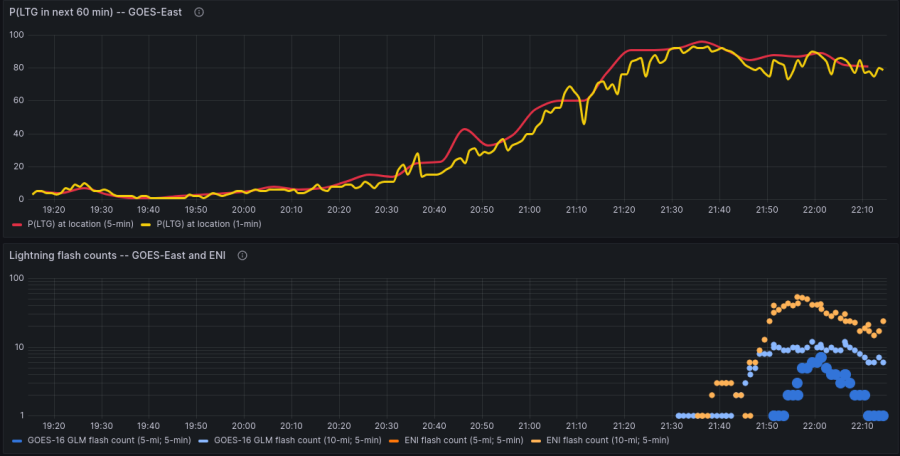
GLM shows lightning activity increasing across the Tampa CWA early this afternoon, and activity is expected to gradually increase in coverage as more thunderstorms develop through the late afternoon and early evening hours.  
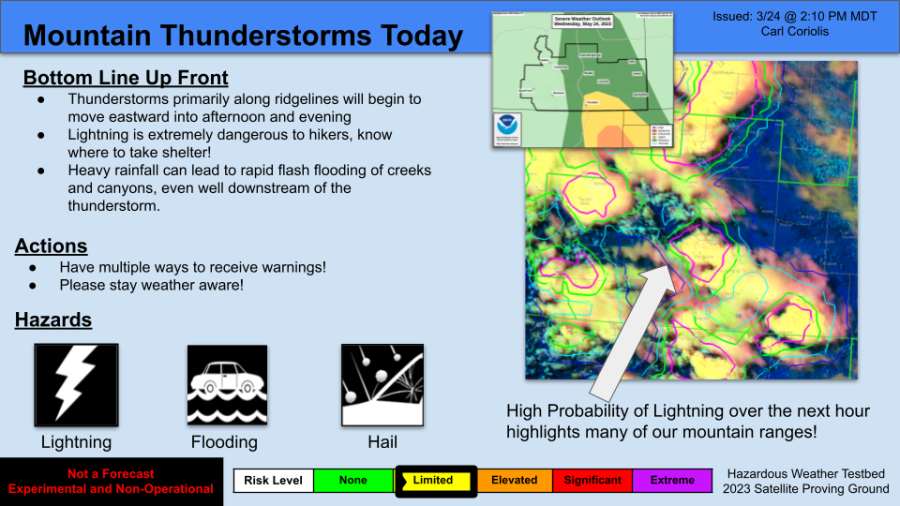
Lightning Cast around 1930Z shows lightning probabilities increasing across the Tampa CWA over the next hour. Pink contours represent a 75% chance of lightning in the next hour. Green represents a 50% chance, teal a 20% chance, and dark blue a10% chance of lightning in the next hour. 
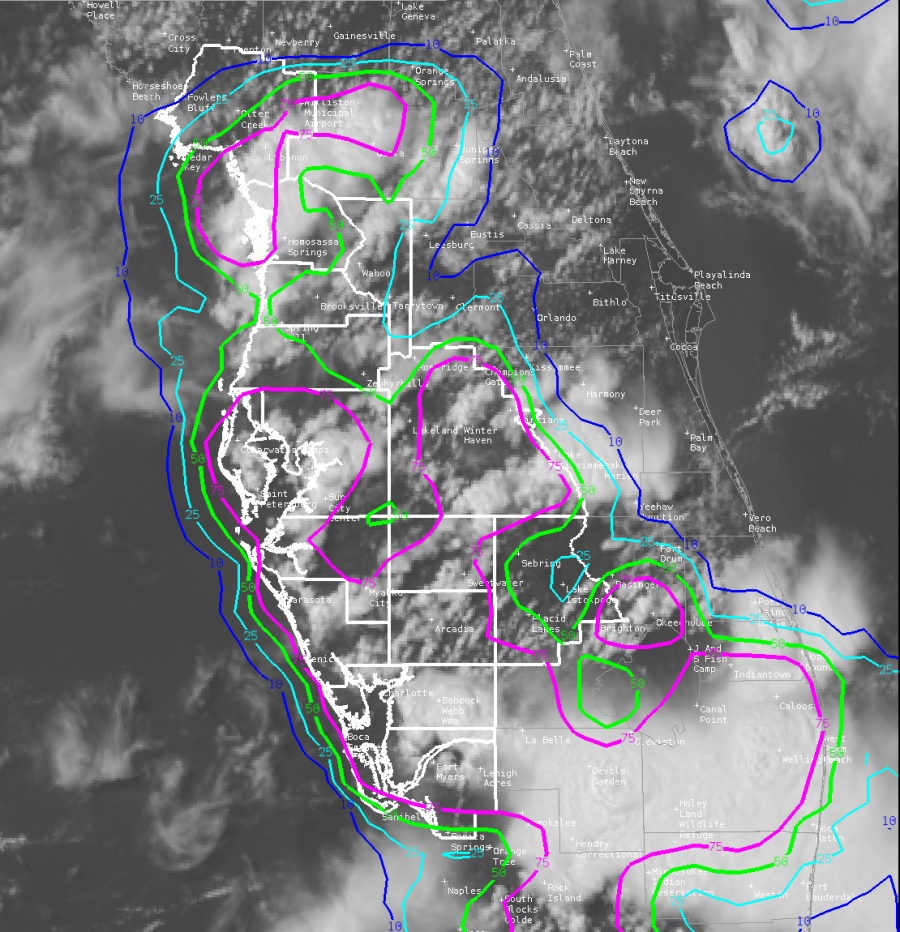
GLM showing lightning activity increasing across Florida from 1930Z through 2016Z across the Tampa CWA. Areas showing more oranges and yellows have shorter flashes and more lightning density. These areas help us know where stronger updrafts are located. The strongest updrafts at the time of this loop remain outside of the Tampa CWA.  -Dwight Schrute

Tags: None

Satellite HWT Day 3 Carl

Wednesday Satellite HWT Thoughts

PHS Model Comparisons and Thoughts

Above: Top is HRRR SHIP parameter, bottom is PHS SHIP parameter.

Looking at some of the convective parameters and indices around the CWA I was working with today (PUB), one thing that really stood out to me was how “splotchy” many of the parameters were when compared with the HRRR model. It’s very hard to believe that the model, especially at a 3 km resolution, is able to obtain that level of accuracy with regards to these parameters, or at the very least having gradients this sharp in many of these parameters doesn’t make much sense. Wondering if some of it is being driven by the extreme CAPE gradients that do show up later on, which are certainly going to be drivers in many of the severe indices.

Another thing I noticed is what looks to be a wave-like numerical instability within the first hour of the model – this could be having some big impacts on the model forecast, as you can see these reflected in the base fields (T, u, v, etc) and then having impacts on many of the other derived parameters that last through the forecast period, as shown in the image below:

CAPE also seems to initialize really high, then “jump” down to a lower value at the first hour. This is quite a large “adjustment” from the initial conditions that the model seems to start with. Shown below are hour 0 of the 14Z run and hour 1 of the 14Z run from Wednesday 5/24.

You can also see the numerical instability within this field that is in place across a large portion of the domain.

OCTANE

Octane was able to capture an interesting view of the Above Anvil Cirrus Plume on a very powerful storm along the New Mexico/Colorado border during the afternoon hours. The cirrus is a bit slower than the surrounding clouds within the sheared environment, providing that “V” type shape that we’ve come to associate with some of the strongest updrafts:

Another good example of using Octane for surveillance of storms – the direction product really highlighted another storm that quickly grew on the flank of another severe warned storm. Big value especially in areas where radar coverage might be limited by mountains, such as in the CWA I was working in today (PUB):

LightningCast

Used the LightningCast product extensively for DSS purposes today. We had a pretend outdoor event located in Pueblo, Colorado. A very strong thunderstorm (MESH estimated nearly 3″ or larger hail at one point) which passed within a few miles to the south and east of the city. I used the LightningCast probabilities in AWIPS overlaid with satellite data to provide multiple updates to Emergency Management, using it to confidently state that probabilities of lightning were increasing as storms approached from the south. Lead time for action would have been within the 45 min to 1 hour range. Was able to confidently say they would see lightning within the 10 mile range a good 15-30 minutes before the first strike occurred within the range per the ENTLN network data. Below is the LightningCast time series as output on the webpage for the KPUB airport, which is very close to where the DSS event was taking place:

There is definitely some very actionable lead time here. As a forecaster, having this type of data available to me outside of AWIPS is a game changer. I know it may be challenging, but being able to click on a point like this and get this type of information would be huge for briefings and emails with decision makers. Right now we are limited to airports. Even a relatively coarse mesh that would allow me to pick a close point would be extremely useful if these images can’t be generated on the fly. Other possible ideas include only generating points within a certain LightningCast threshold (say 10%), or generating them on the fly based on a click query. That all said, even in its current form I will be using it going forward, and making a point to share it with my office and WCM for DSS.

I also made a social media type graphic using the LightningCast product for hikers, given the large number of mountains within the CWA. Perhaps would have been a bit more meaningful to have sent this as storms were beginning to form, but they were already cooking once we got spun up and started. Highest probabilities were hugging the mountains where storms were forming. If I were formally posting to social media, I may have added some lightning safety graphics or something to that effect as part of the post (twitter thread, multiple images in Facebook post).

GLM RGB

This product does a great job in my opinion combining information from the FED and MFA. I found it useful for detecting lightning jumps within storms while still maintaining information about the overall coverage of lighting. Would happily use this as my primary GLM viewing option in AWIPS.

-Carl Coriolis


Tags: None

Afternoon High Plains Convection in Southern Colorado

Today we focused on the Pueblo, Colorado  CWA for afternoon High Plains convection. Scattered convection developed across the CWA leading to large hail and damaging winds. The first Severe Thunderstorm formed on our CWA border with Albuquerque and drifting south into their CWA. A second Severe storm developed and tracked north towards our DSS Event in Pueblo, bringing the potential for large damaging hail and strong winds.

15Z PHS MUCAPE valid at 18Z showed around 2000  to 2500 J/kg for green areas while areas in blue had roughly 1000 to 2000 J/kg.
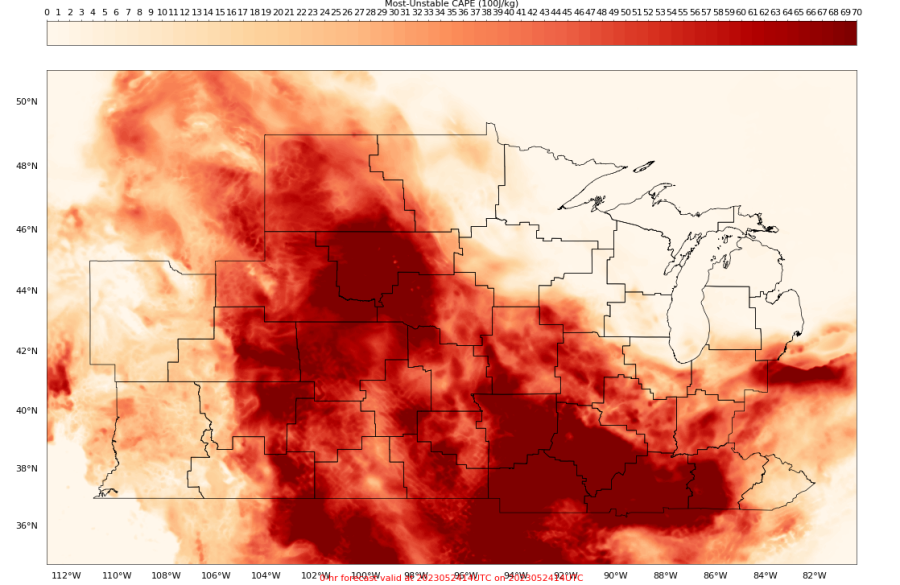
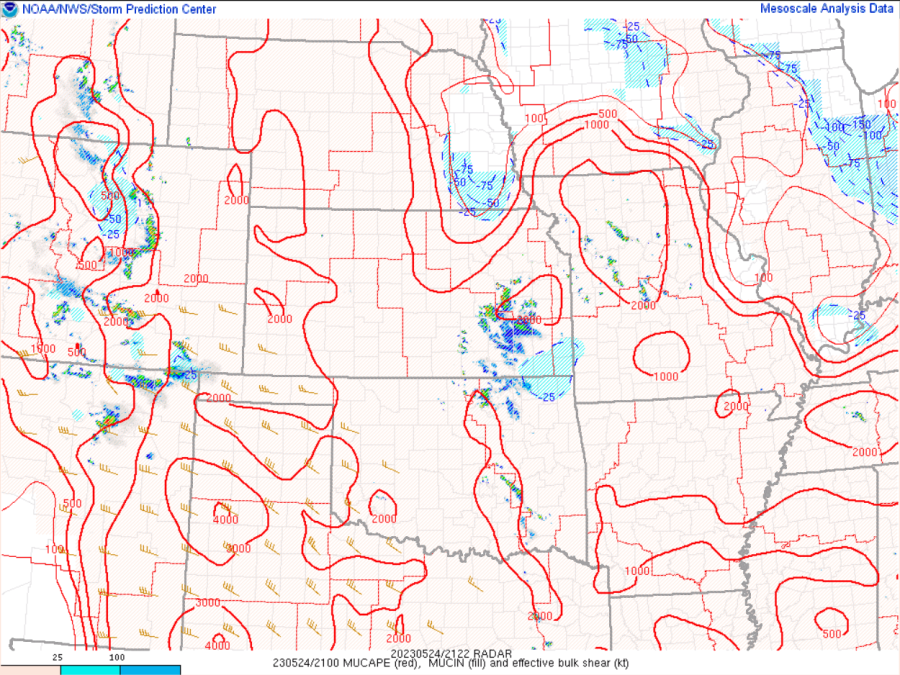
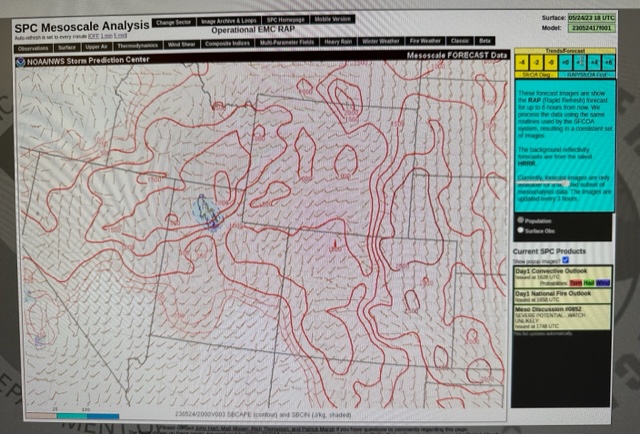
SPC MUCAPE Mesoanalysis valid at 18Z shows similar trends to the 15Z PHS MUCAPE values.

16Z PHS valid at 21Z showed a slight upward trend of MUCAPE in the eastern half of the CWA. 

21Z SPC Mesoanalysis showed increasing values of MUCAPE developing just south-southeast of the CWA, similar to the 16Z run of the PHS shown above. 


15Z PHS STP valid at 18Z showing little overall threat for tornado concerns through early afternoon, for the most part values were less than 0.25. 

SPC Mesoanalysis page showing 18Z STP values similar to the 15Z PHS forecast. 


The image below shows the Octane Speed product on the left and the Octane Direction product on the right, focusing on a cluster of activity near the Jefferson/Douglas County line in Colorado. Picked this screen capture as it showed a wide range in values, mainly for the Direction product. The Octane Speed product shows some speed shear present with the lighter speeds (darker blue, ~5 kts) transitioning to brighter green/a bit of yellow (~30 kts). The magnitude of directional shear was higher, showing direction of motion/divergence ranging from ~170 degrees (core of red area) to ~295 degrees (core of green area).
Below is a animated graphic showing the transition in both products. 

———————————————————————————————-

Chose to grab this Octane Direction product screen capture as it shows an elongated area of storm top divergence through central Colorado.  The red/magenta colors show direction generally from the 170-190 degree range, while the green/yellow colors show values from the 275-285 degree range. The black areas are spots of data dropout, which can occur when the speed shear product drops below 5kts.

———————————————————————————————-

First Severe Thunderstorm Warning issued for this area today came right after 20Z, based on ProbSevere values/time series as well as the Octane Speed Sandwich product.  
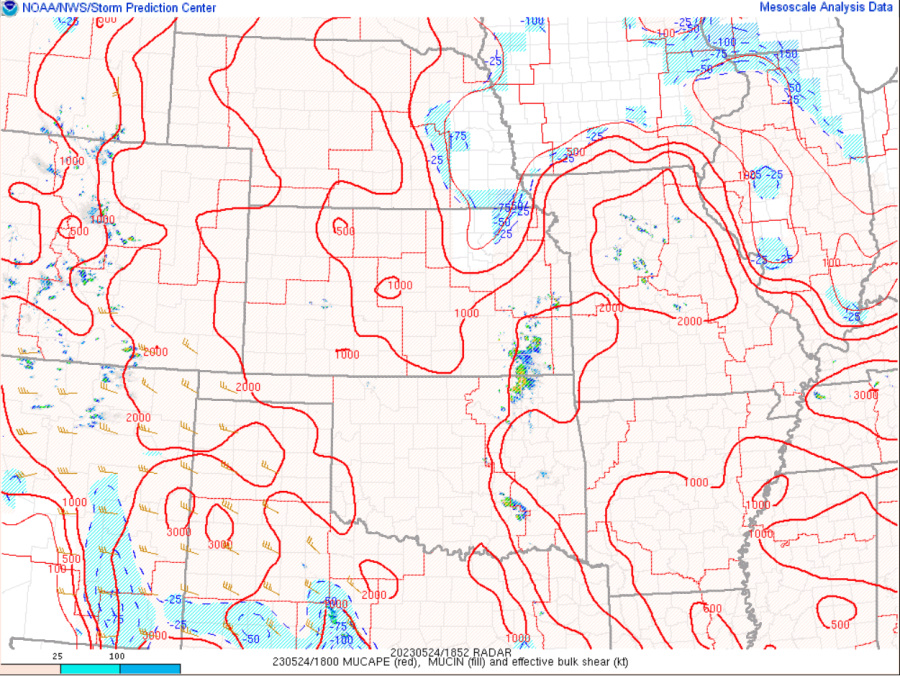
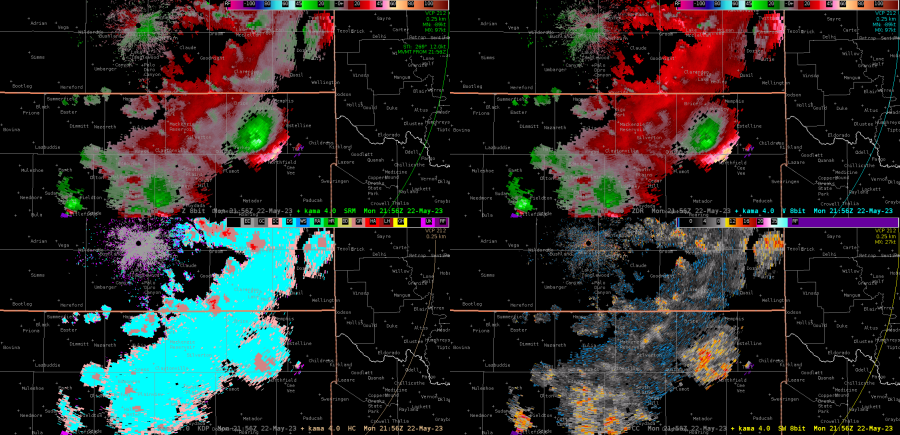
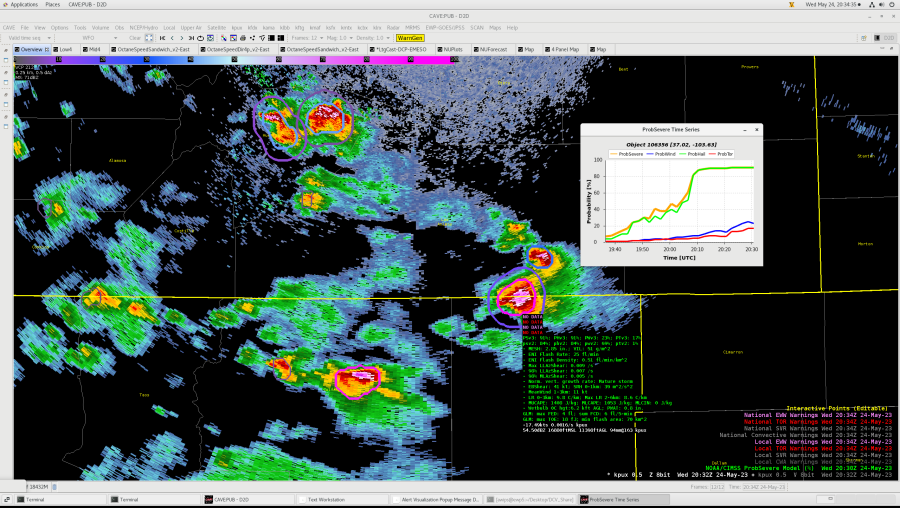
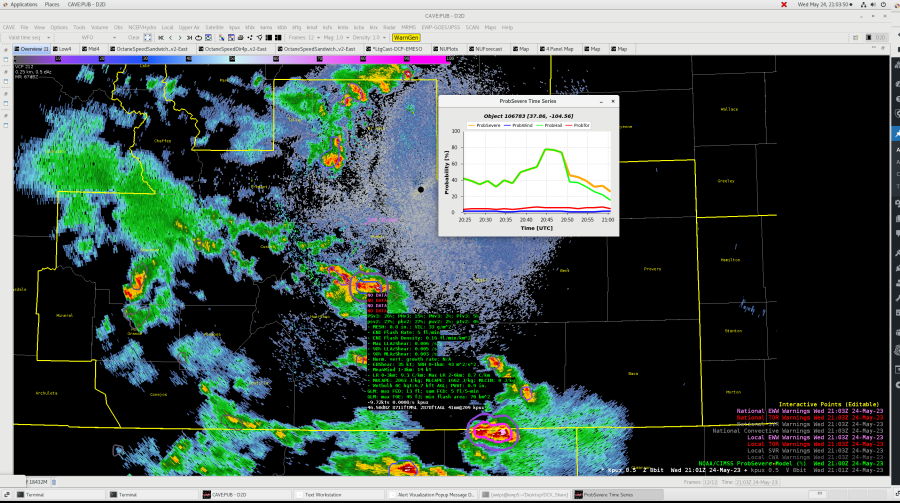
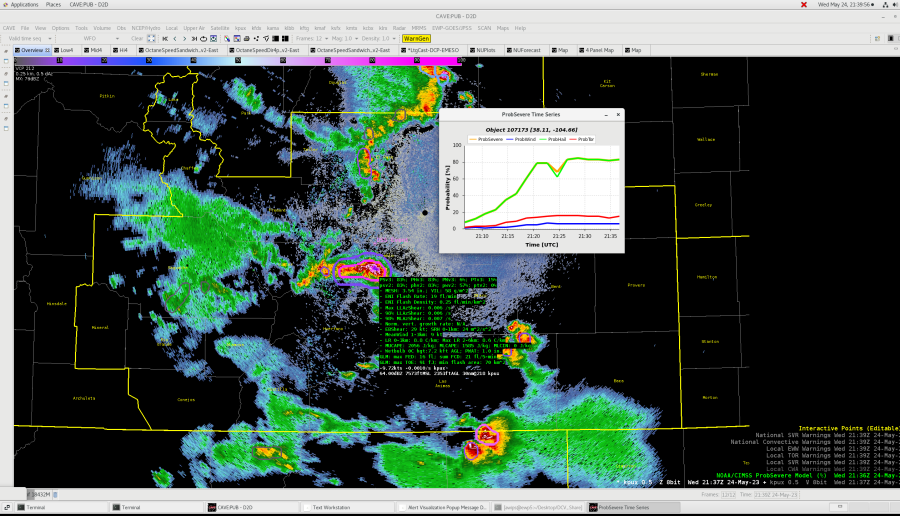
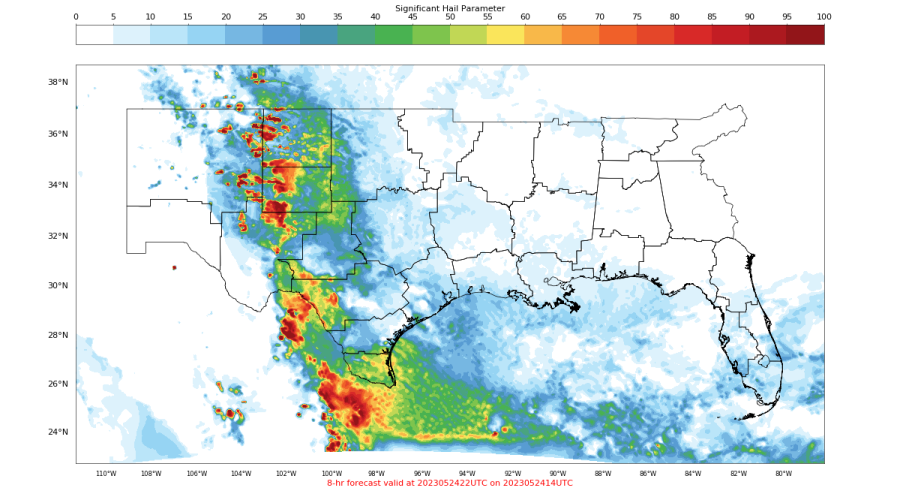
Probabilities ramped up quickly for both ProbSevere and ProbHail on this storm at the edge of the PUB/ABQ CWA boundary. 
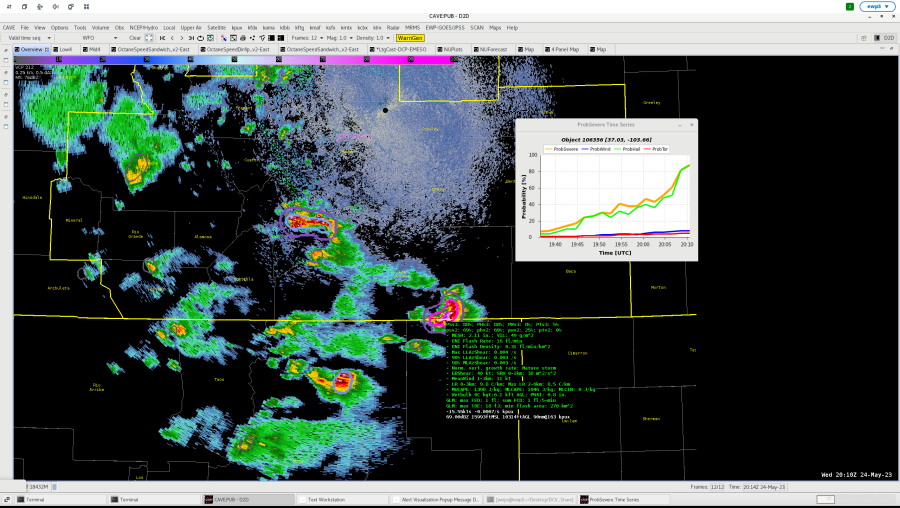
Octane around “peak” of the storm.
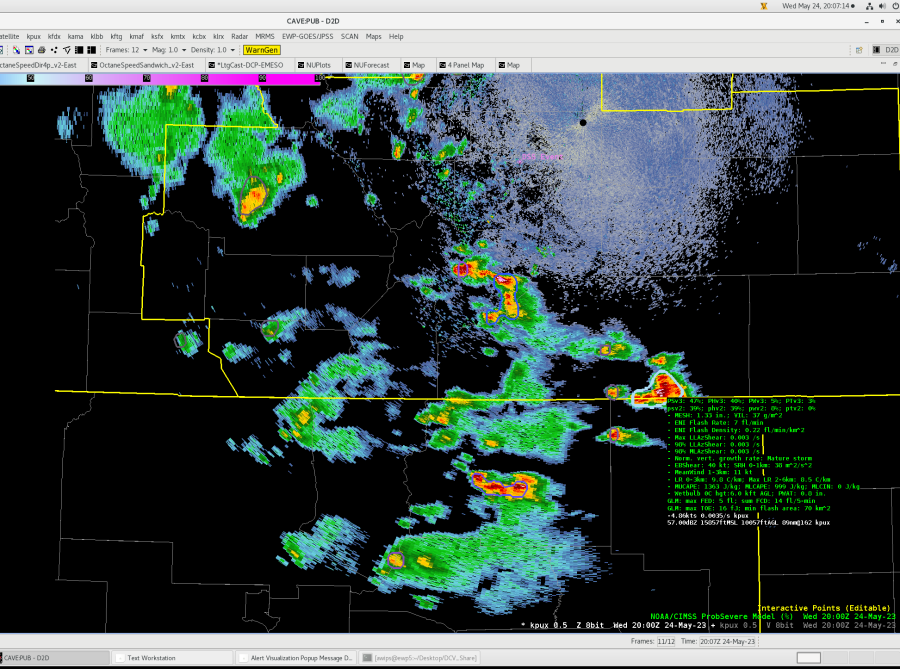
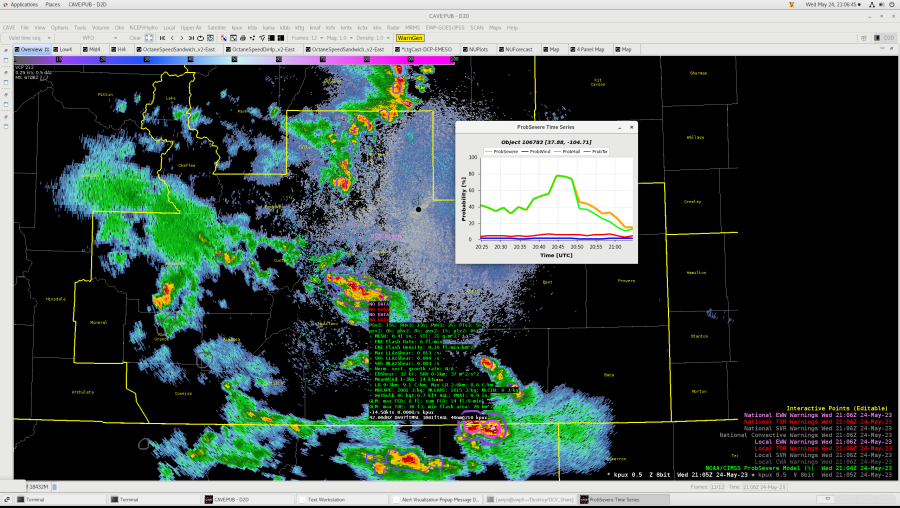
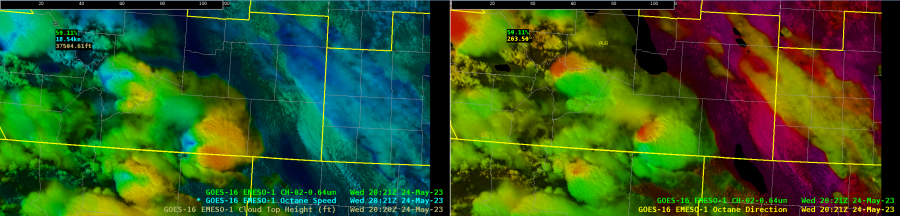
Low Level SRM and ProbSvr (0.5 deg slice is about 10.8k ft AGL)
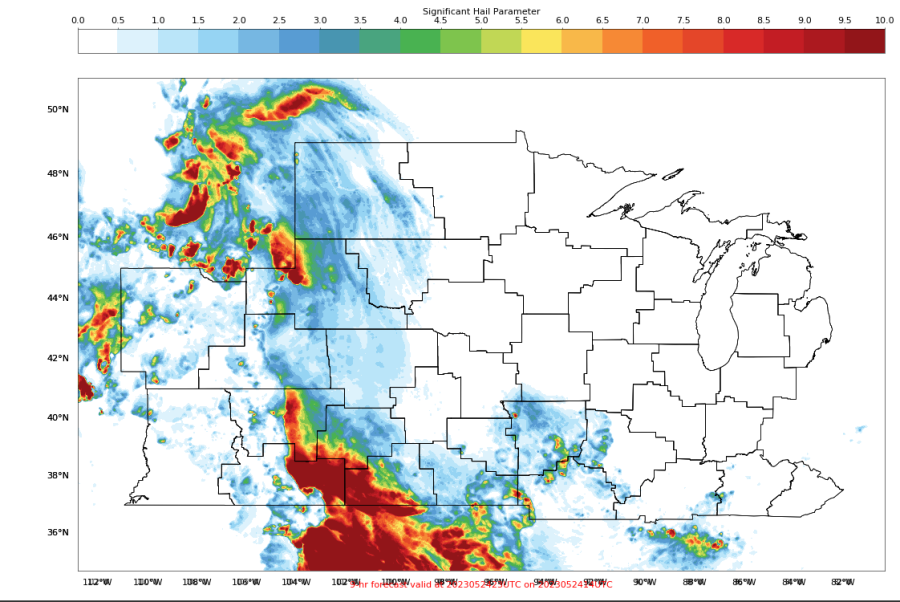
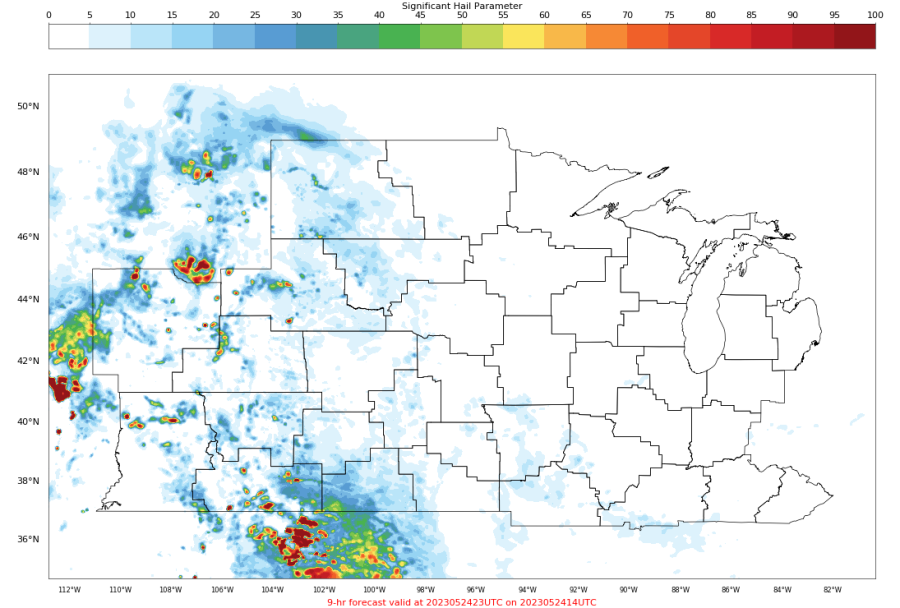
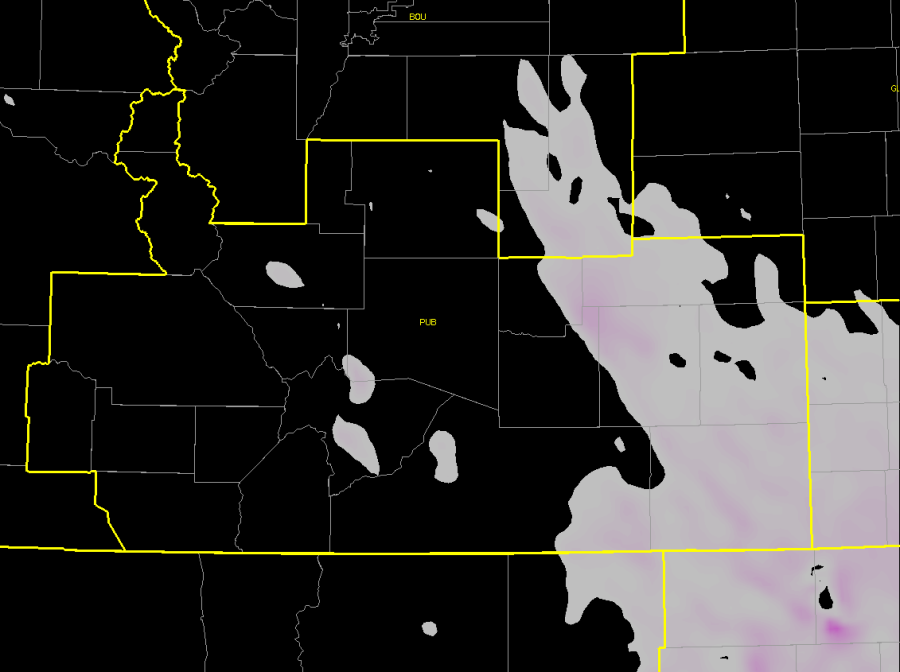
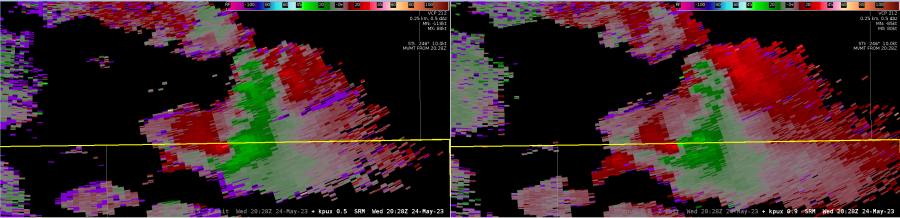
Mesh showing 3 inch hail on the border of the Pueblo CWA.

ProbSevere and ProbHail maxed out at roughly 90% while the storm remained severe. This storm eventually moved into ABQ’s CWA.———————————————————-

2nd Severe Thunderstorm Warning – Huerfano County

ProbSevere values and time series for 2nd Severe Thunderstorm Warning of the day, readout is at its “peak”…around 2045Z.
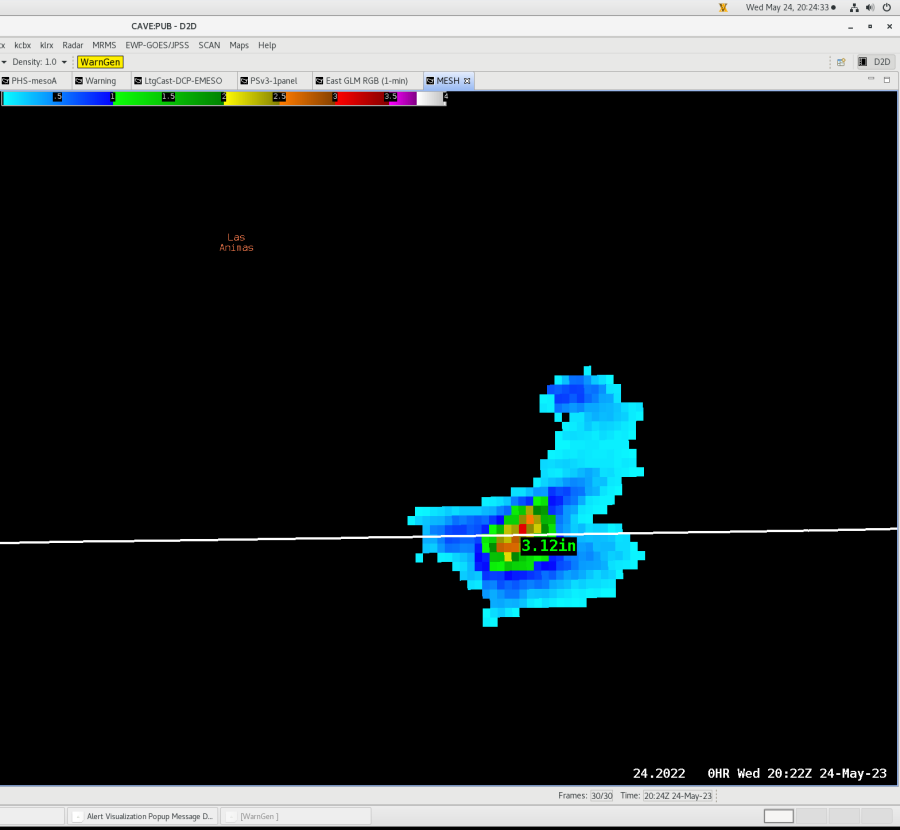
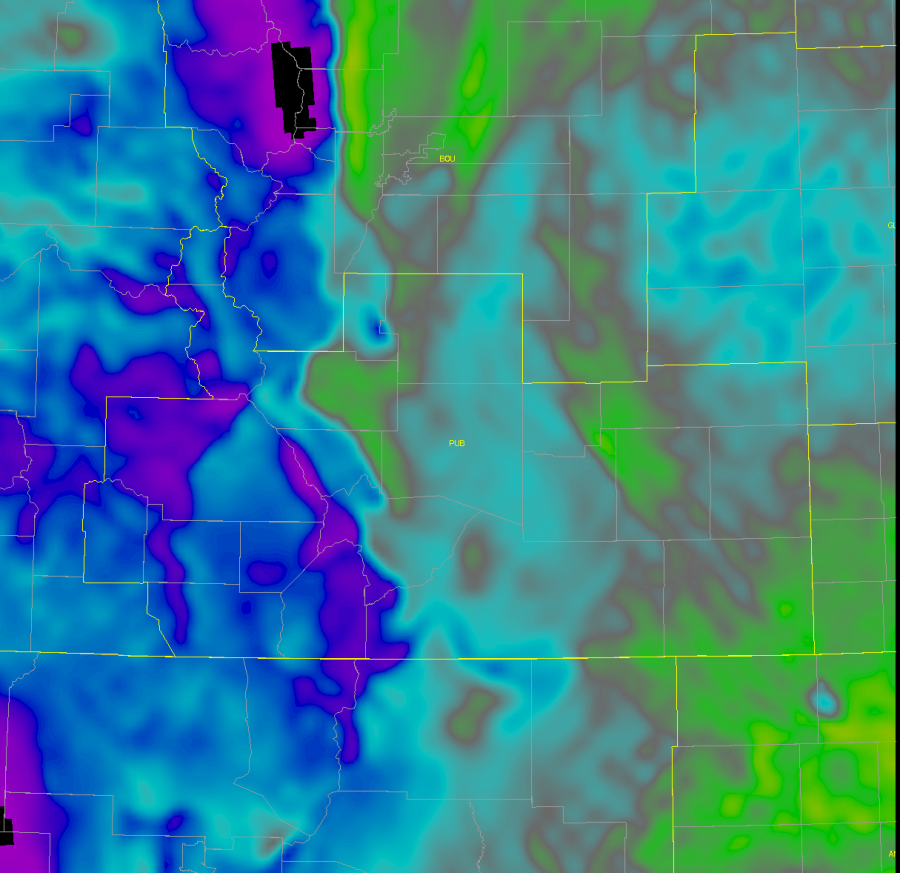
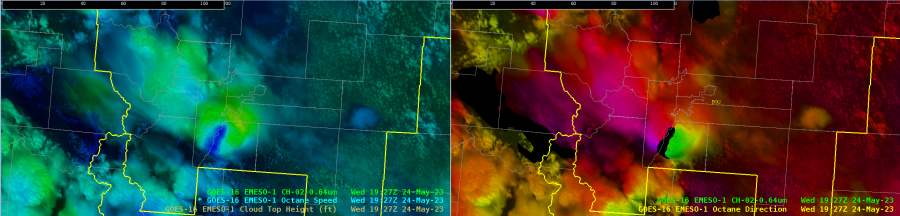
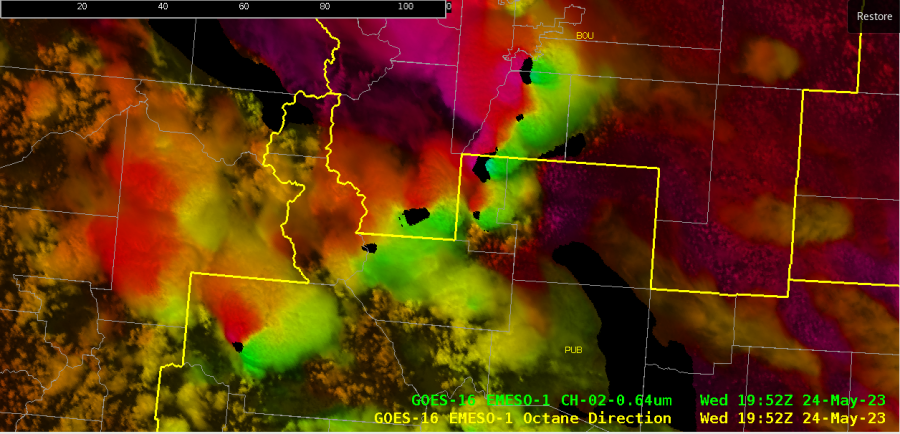
Octane Speed/Direction at “Peak” of the storm,  around 2045Z. Directional shear varied from ~205 degrees (reds) to ~285 degrees (greens).
ProbSevere showing the weakening trend of the storm gave us confidence that the storm was in fact weakening.  
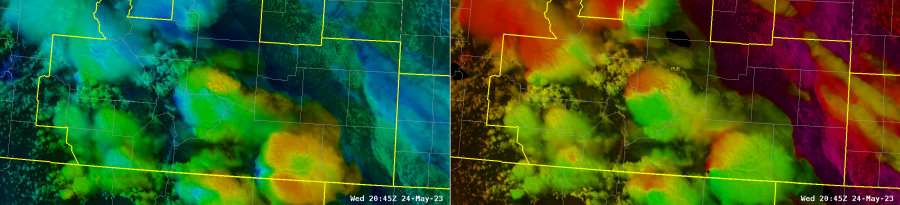
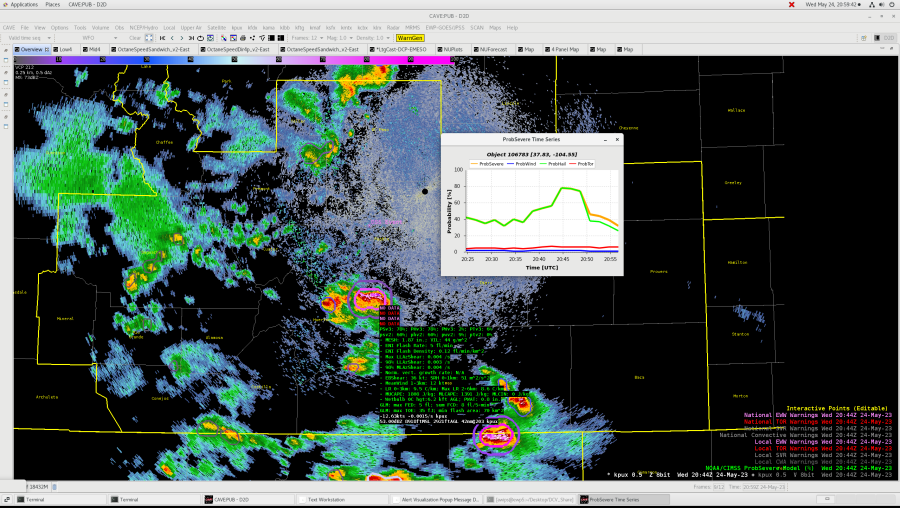
Octane speed/direction further confirming the weakening trend as colors become more diffuse in nature.

ProbSevere showing continued weakening trend. We decided not to issue another severe thunderstorm warning on this storm based on the trend.

Though this storm showed a weakening trend, it was a short-lived trend, as it still had ~2000 j/kg of MUCAPE and effective shear around 30kts to work with as it tracked farther north.

The storm ended up re-intensifying, as shown by the ProbSevere output/time series below. We went ahead and issued another Severe Thunderstorm Warning for very large hail.  
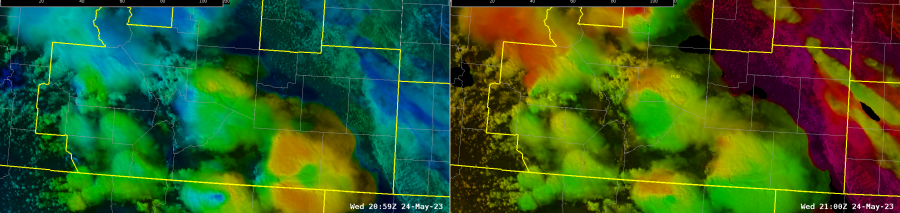
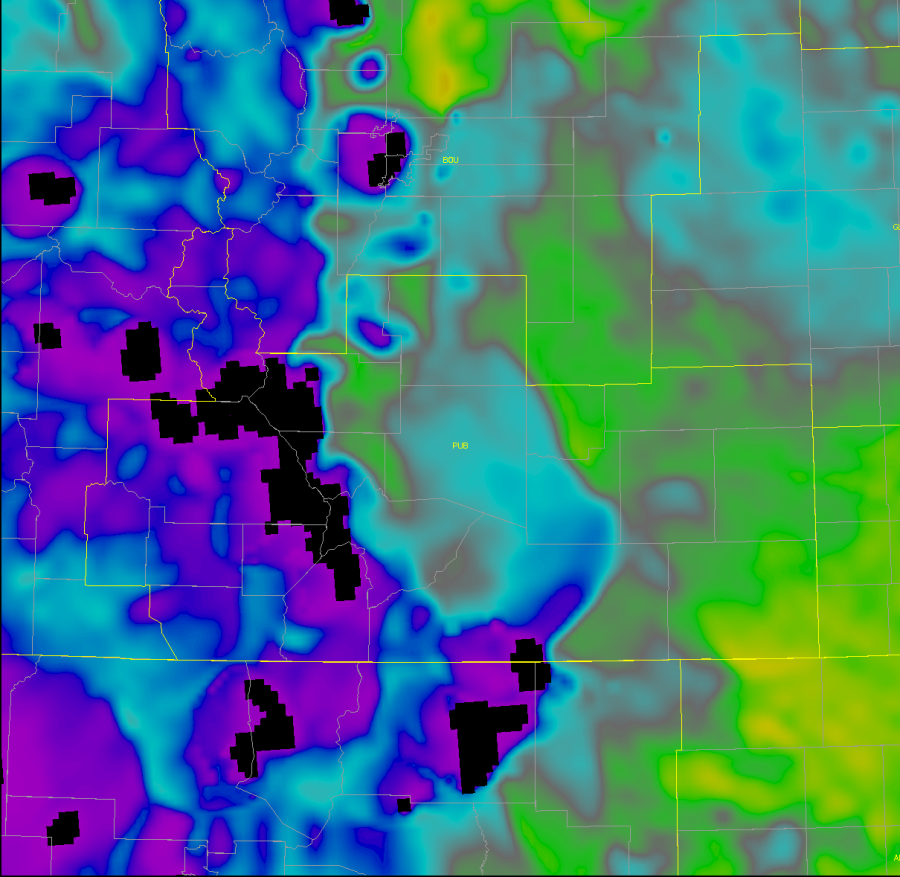
An increase in both storm top speed/directional shear was also shown by the Octane product.
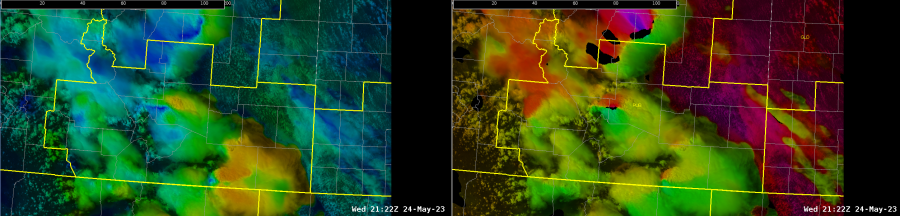
The level reflectivity images show an impressive core peaking in the 36-40k ft range, shown in the 12.5 deg. slice. 
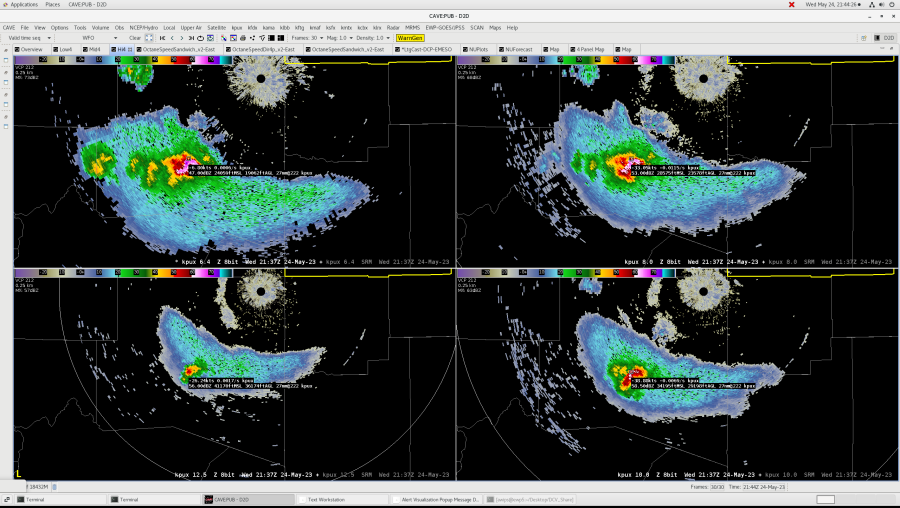
MESH showing nearly 4 inch hail south of our DSS event in Pueblo. The event was notified about the potential for large damaging hail.
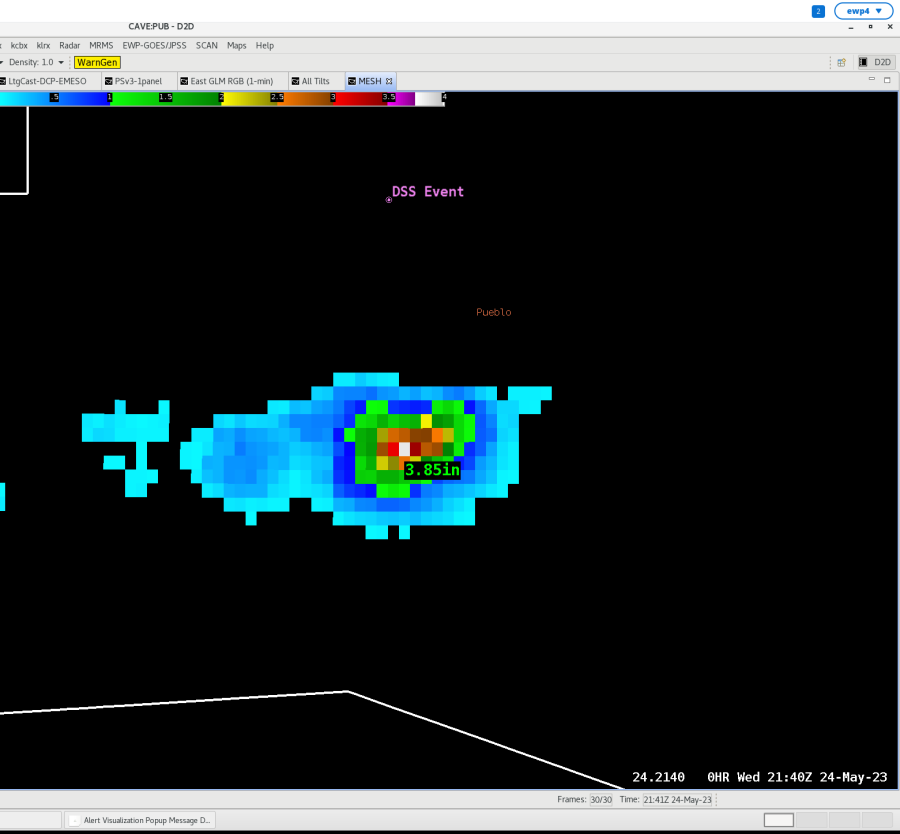
 

-Dwight Schrute/Bubbles

Tags: None

PHS Highlights Instability Axis – Elko, NV

PHS Highlights Instability Axis – Elko, NV

High resolution thermodynamic parameters from PHS appeared to be in line with meso-analyzed products from the RAP (SPC Mesoanalysis). The benefit with PHS is the 2km resolution output, highlighting terrain features in the CWA. Composite reflectivity product performed well with expected convection through the afternoon, and helped with the creation of a mock DSS graphic that included up to 3 hours of lead time for an airshow in Wells, NV.


PHS SB CAPE at 19Z prior to CI

PHS Comp Refl at 18Z

PHS Comp Refl at 20Z

Tags: None

PHS PreStorm Environment

Looking at the pre-storm environment using PSH we can see higher MUCAPE in the eastern most portion of ABQ CWA. We also looked at the SHIPS model on the PHS website and saw high number also in the eastern region of the CWA. That indicated to use the best chance of storms would be in the eastern most half of New Mexico and the biggest threat would be hail. PHS did excellent in this event. We have been seeing a few good hail cores in the area of the highest CAPE while areas to the west of of higher CAPE has see a storm or two but nothing close to severe.   .-Thunderstruck

Tags: None

PHS SBCAPE Data in NV

Here is what the PHS SBCAPE forecasted for 5/24, 20Z across NV.  (Some of the purple circles within the areas of blue hinted at ongoing convection).  This matches up well compared to the forecasted 20Z SPC Mesoscale Analysis SBCAPE.  How did it verify?

The 20Z SPC Mesoscale Analysis SBCAPE had an area that was 2,000 J/kg.  However, this appeared to be overdone as there  was widespread convection occurring across this area.

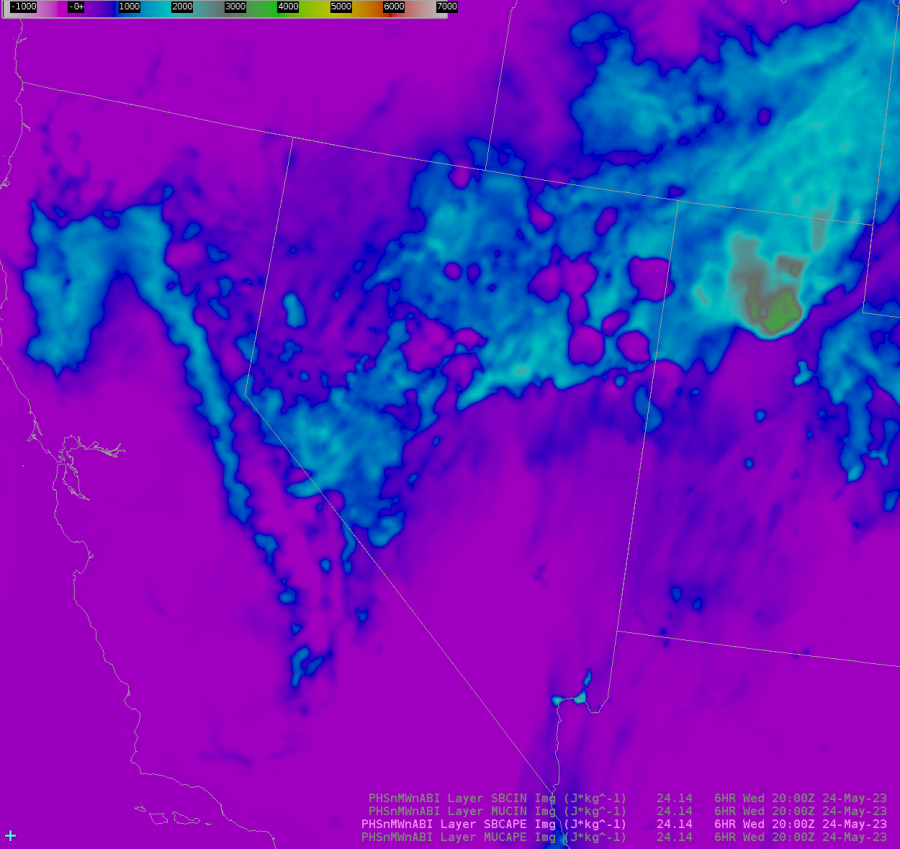
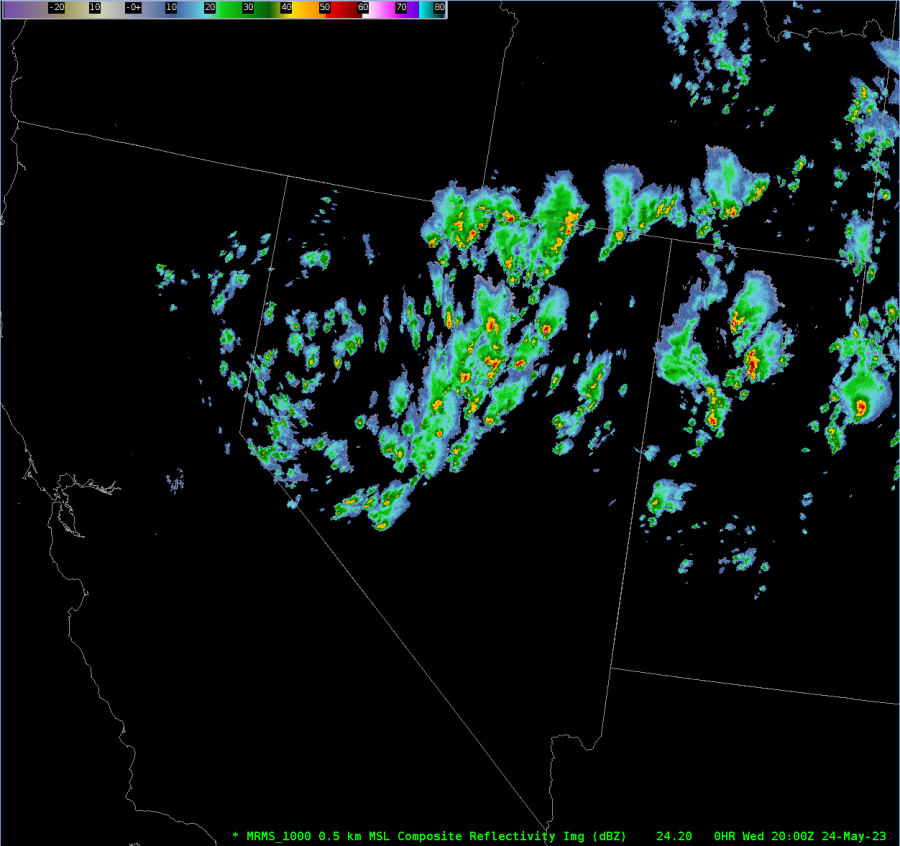
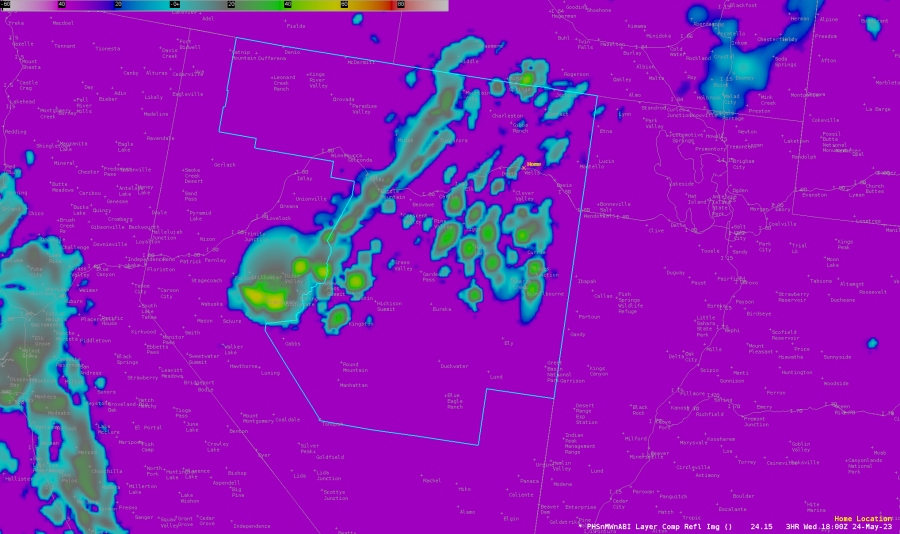
Remember, the PHS hinted at ongoing convection in some of these areas.

-Champion

Tags: None

PHS Comp Refl Data in NV

Here is what the PHS Comp Refl was forecasting for 5/24, 22Z across NV.  How did it verify a few hours later?

MRMS 0.5 km Comp Refl at 22Z showed a broad area of convection over NV.  What’s interesting is how some of the individual storms were very, very close to the locations where the forecast hinted at there being individual storms.  Keep in mind, the radar coverage in this part of the country is not very dense.

-Champion

Tags: None

Sectorizing Initiation Points and Greatest Severe Threats By Low Level Moisture Content

RGB Satellite Product Using Split Window Difference

The quality of boundary layer moisture will be important to the severe convective threat across the MAF CWA today. Using the late morning split window difference field (within the RGB shown below), the greater moisture field can be found over northeastern portions of the CWA with the subtly greener shade of color. This color shade in the northeast generally overlaps with surface observations showing >60 F dew points. The color shade is more blue in central portions of the CWA where dew points drop into the upper 40s. While dew points are still lower in the southwest, there is a color shade difference where higher terrain exists (as well as greener vegetation). In this area early morning orographic convection had developed. By the mid afternoon, convection had developed near the moisture gradient in the south central portion of the CWA as well as near the northern moisture gradient along a surface low over the southwest New Mexico border.

PHS Analysis

The PHS forecast product agreed with the overall moisture gradient, where greater dew points and lower LCL’s draped the northeast corner of the CWA. Subsequently, the PHS MUCAPE product showed greater instability within this corridor.


PHS Dew Point

PHS LCL

PHS MUCAPE

Even with these satellite based products analyzing the moisture content well before the convective threat later today, it lines up well with the forecast greatest severe threat from today’s SPC outlook (shown below), with the Slight risk favoring the northeast portion of the county.

– Joaq

Tags: None

PHS as a SA Tool for Incoming/Developing Convection

Thunderstorms advecting (and developing) from the west appear to be moving into a better thermodynamic environment. SB CAPE parameters between 3k and 4k J/KG analyzed by PHS across the northeastern counties of the MAF CWA lead me to believe storms will strengthen in the next couple hours as they move into this region. SB CAPE values from 3,000 to 4,000 J/KG are analyzed by PHS at 23Z.

– Rain-Free Bass Guitar

Tags: None

Satellite HWT Day 1 Analysis Carl

PHS Model Analysis

PHS model struggled to properly capture convective initiation within the Texas Panhandle on the day. While it did see a few cells possibly starting, overall coverage was significantly underdone with many of these storms reaching severe thresholds including numerous reports of hail over 1″. The overall output shared many of the same struggles as the HRRR model on the day. Unclear what the exact problem was, but dry line convergence may have been better than in models on this day.

Above: 15Z PHS model output forecast for 17Z to 22Z from 5/22 with MRMS Reflectivity overlaid.

Below: 15Z PHS model output for 17Z to 22Z from 5/22.

NUCAPS Forecast

As I was beginning to test out these products, this caught my eye as a forecaster on the east coast that regularly deals with Cold Air Damming along the Appalachians. Models regularly struggle with multiple aspects of the dam, including extent, depth, and actual temperature and strength. Additionally, one of the most common pathways for large winter storms in the southeast is when low pressure passes across the Gulf Coast and into the Atlantic while an Arctic high in the northeast helps drive cold air damming into the area. Models again struggle with the dam, but also with strength of the warm nose aloft. I would love to see how this system performs in these scenarios – I know it isn’t “convective”, but it still is an incredibly impactful event, where the strength of the warm nose can be the difference between a few inches of snow or half an inch or more of ice. We regularly attempt to send up special soundings to get the best sample we can, but since GSP does not do a sounding, we rarely get a meaningful sample of the cold air damming in the SE states.

Above: NUCAPS Forecast from morning pass over east coast showing CAD feature over the east coast.

Octane Speed and Direction

Above: Octane image around 22Z for storm just south of AMA.

The Octane product was extremely useful in seeing when updrafts were really “taking off” and hitting the tropopause, immediately highlighting storms which require quick attention. Another extremely useful feature is sampling the actual speed, which gave a potential proxy for storm top divergence. Noticed that the Octane product gave a value around half of what the radar was measuring on this storm – ~50 kts on the Octane product vs ~100-110 kts on the radar. I’m assuming the resolution combined with some of the smoothing within the algorithm may be playing a role here, but it would be interesting to see if there is a consistent way to match the two up, even if there is just a “rule of thumb” or something. This would be huge in areas of sparse radar coverage (portions of the west or the ocean, for example).

Below: Radar image of storm top divergence near 22Z from KAMA.

ProbSevere v3

Noticed an interesting time period where two close updrafts – one fading, one picking up, resulted in some jumping of the ProbSevere product as it would sometimes combine the objects and then sometimes track them separately. I think this shows the importance of pairing the algorithm with analysis – just looking at the time series of the product could lead to misinterpretation of what was happening.

-Carl Coriolis

Tags: None