HGX Convection impacting the Car and Truck Show in Burton, TX

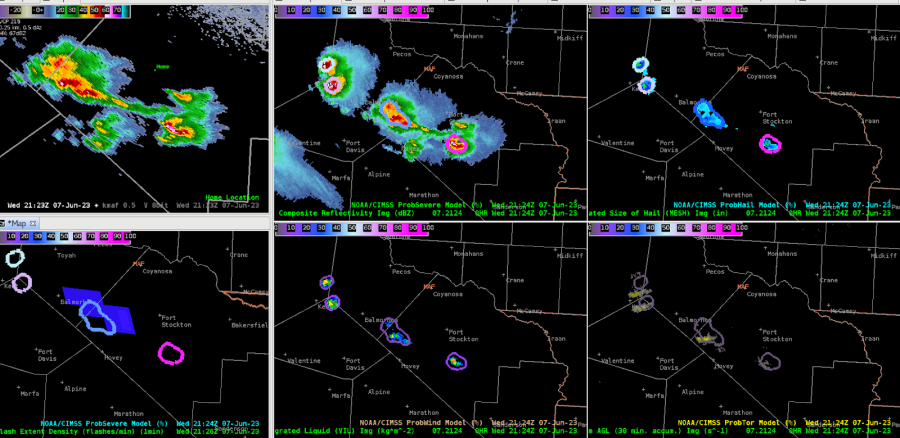
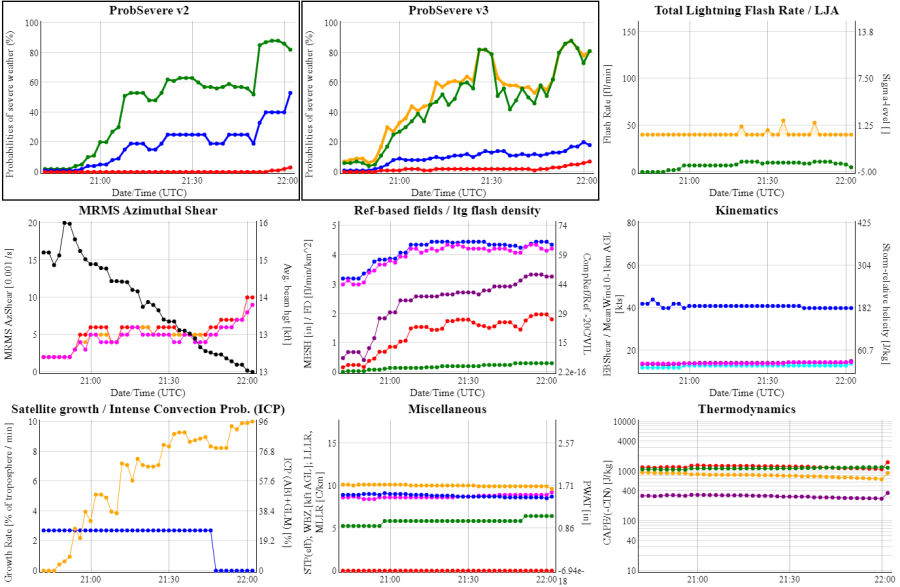
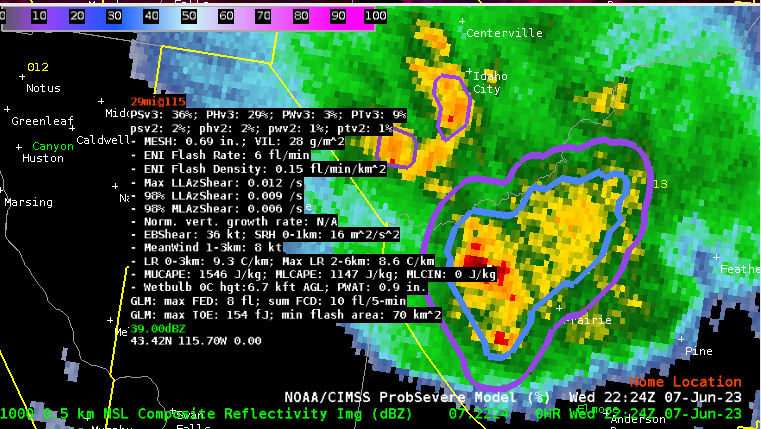
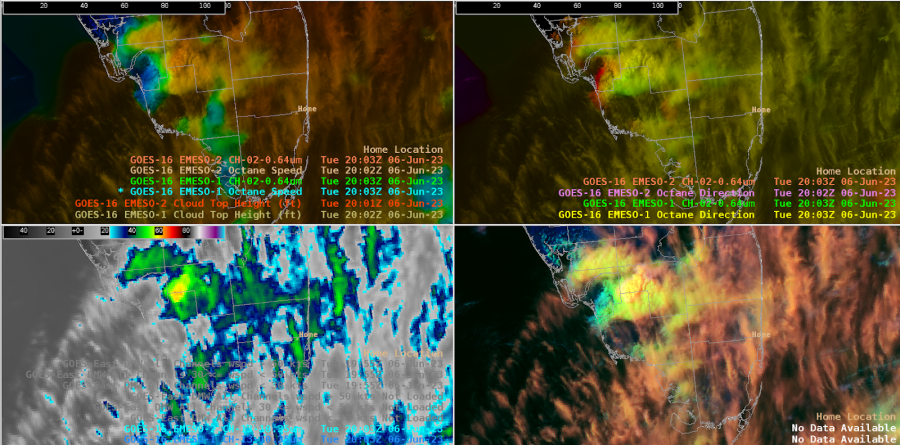
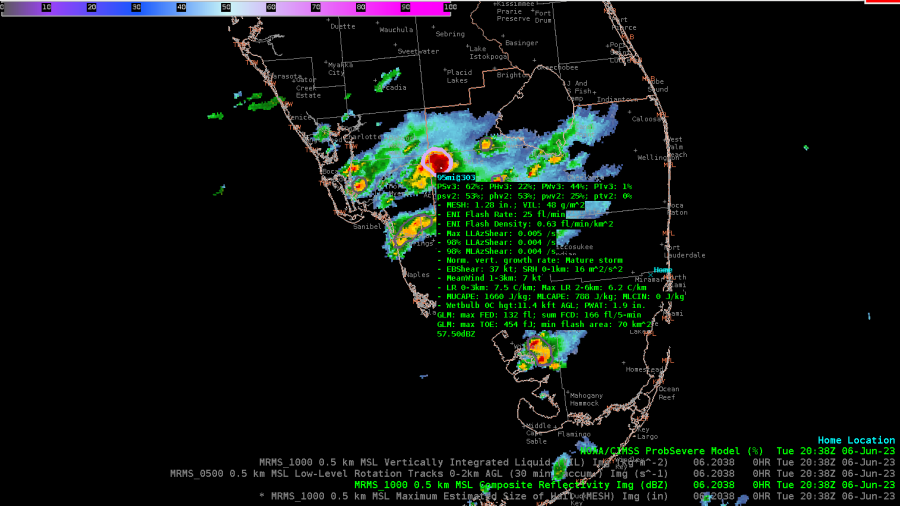
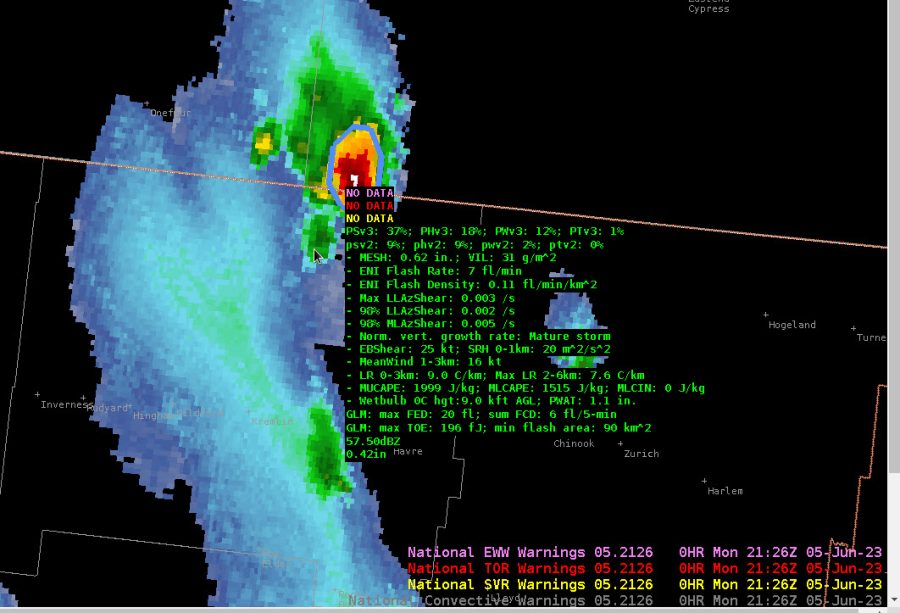
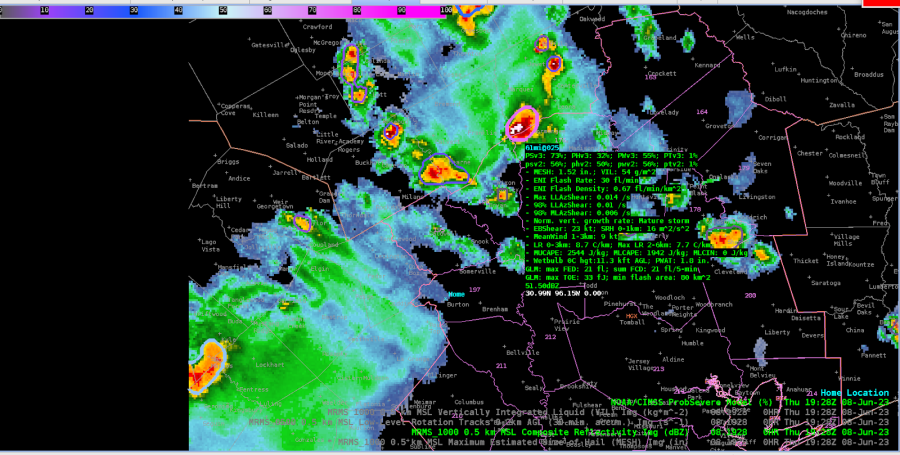
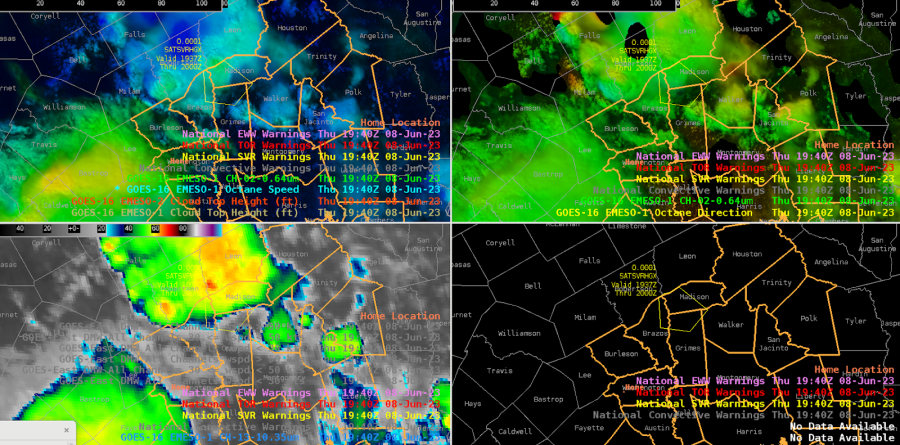
Initial setup for the HGX vicinity showed several cells to the north and east of the DSS site, propagating southeastward. The strongest cell, pictured below, had a PSv3 of 73%, while PSv2 remained as 56%.

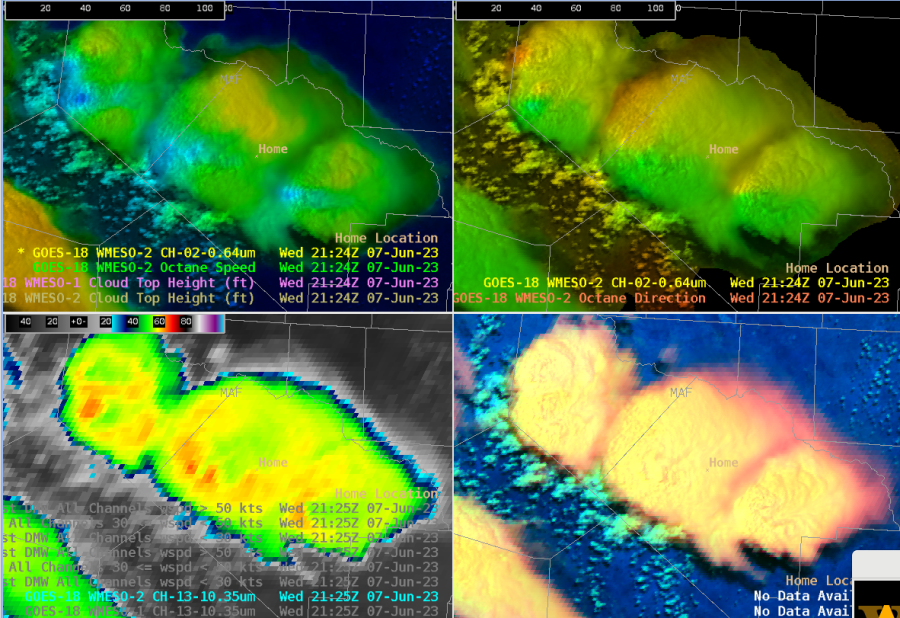
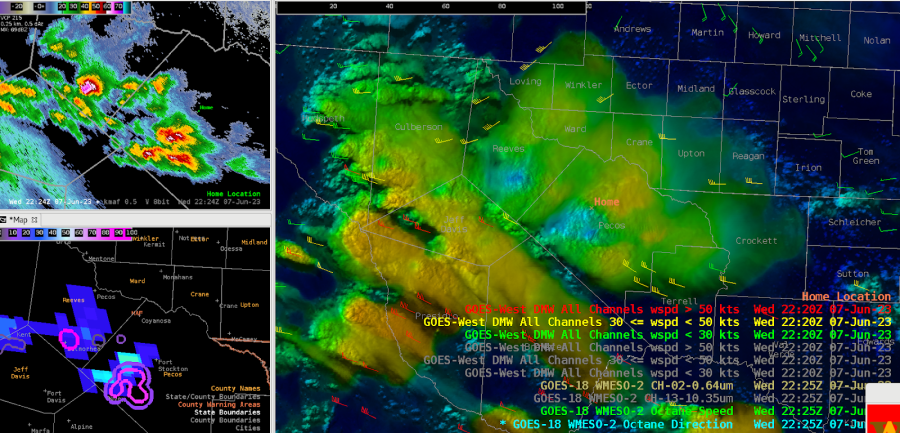
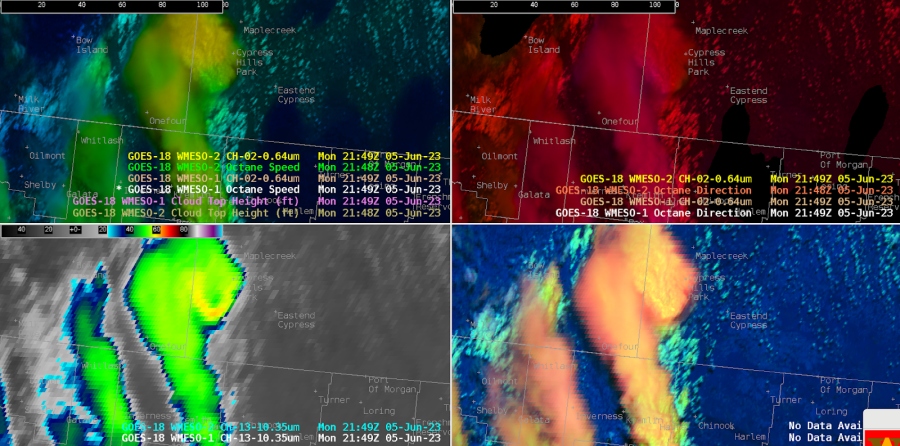
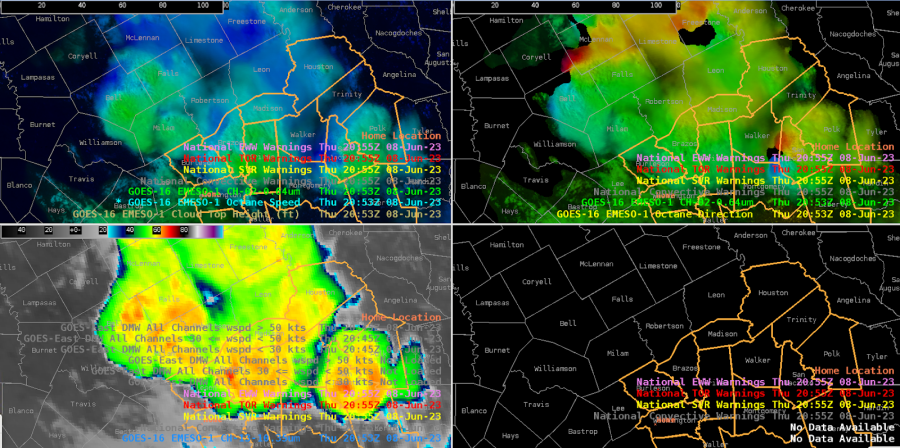
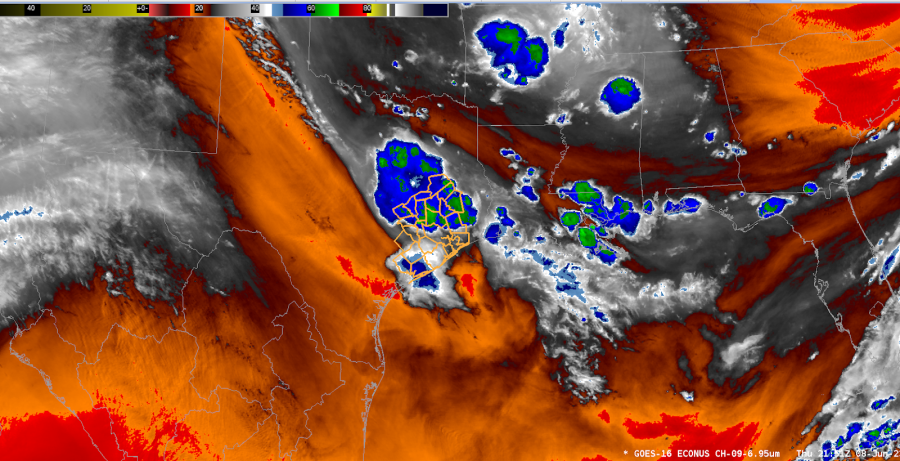
We issued a warning for a northern cell moving into the CWA into Madison county, based on a -70C cloud top brightness temp and PSv3 total prob over 70% (had been climbing from the 50s fairly steadily). But the cloud top shear noted by Octane was not strong (~20-25 kts), so the warning was very borderline. Just a couple scans later, it lost most of its texture on the vis imagery and lost its shear in the Octane direction product. Cloud tops warmed a bit as well.

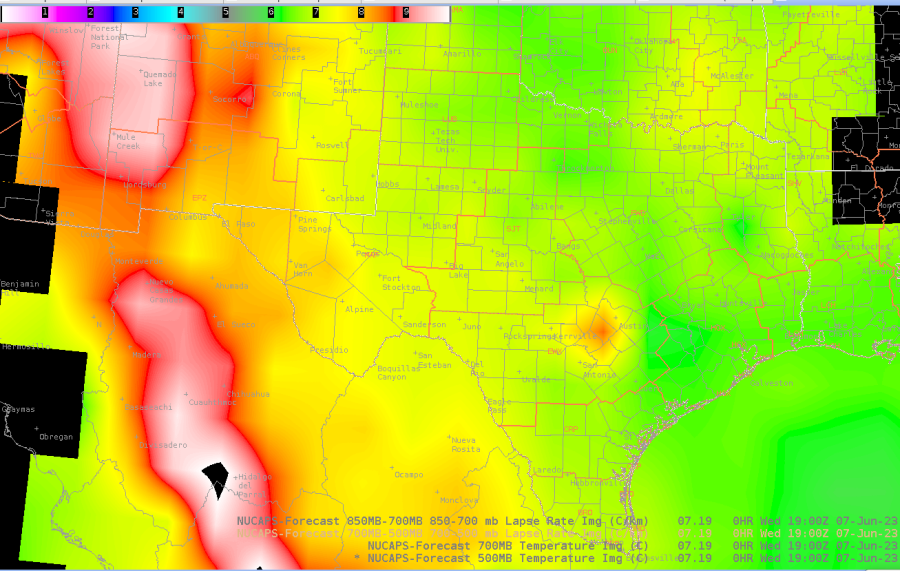
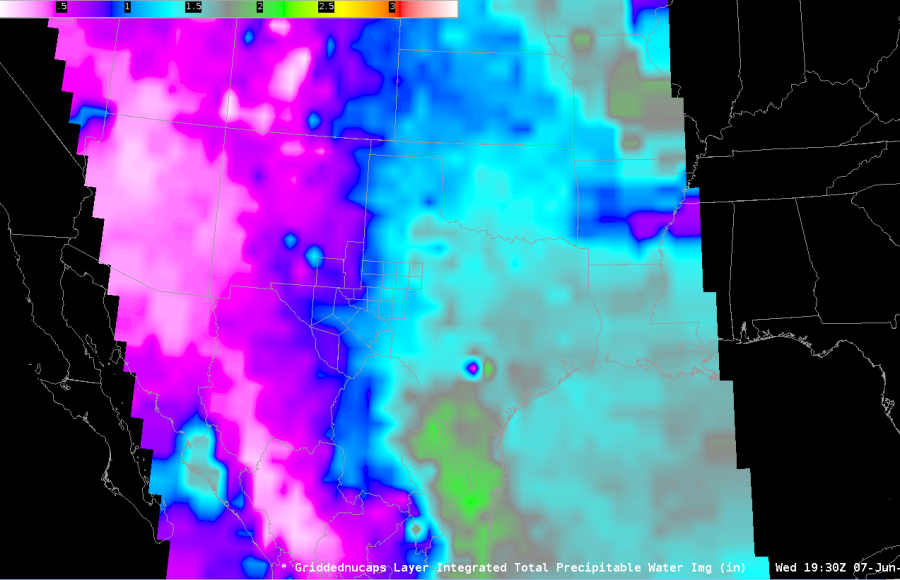
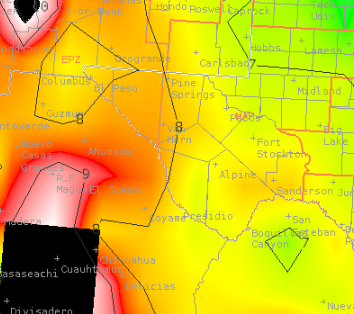
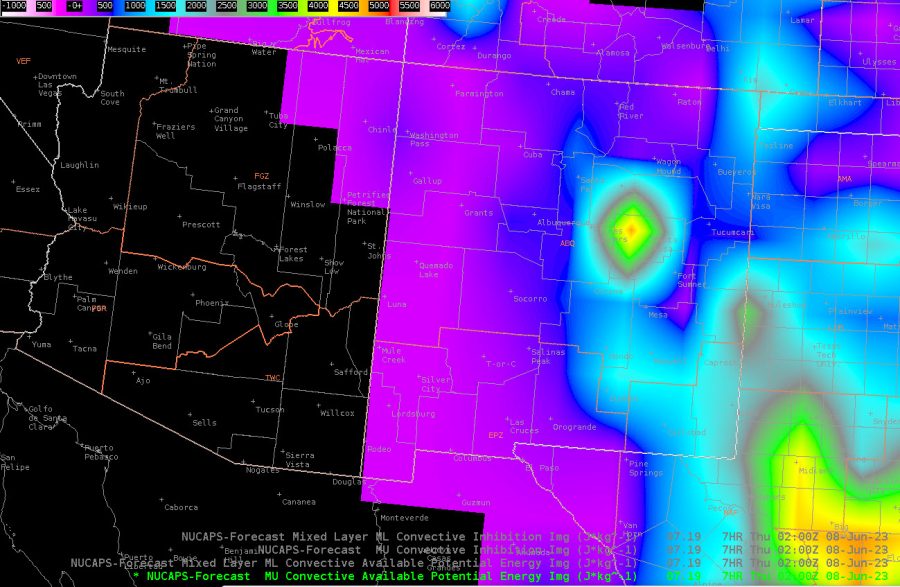
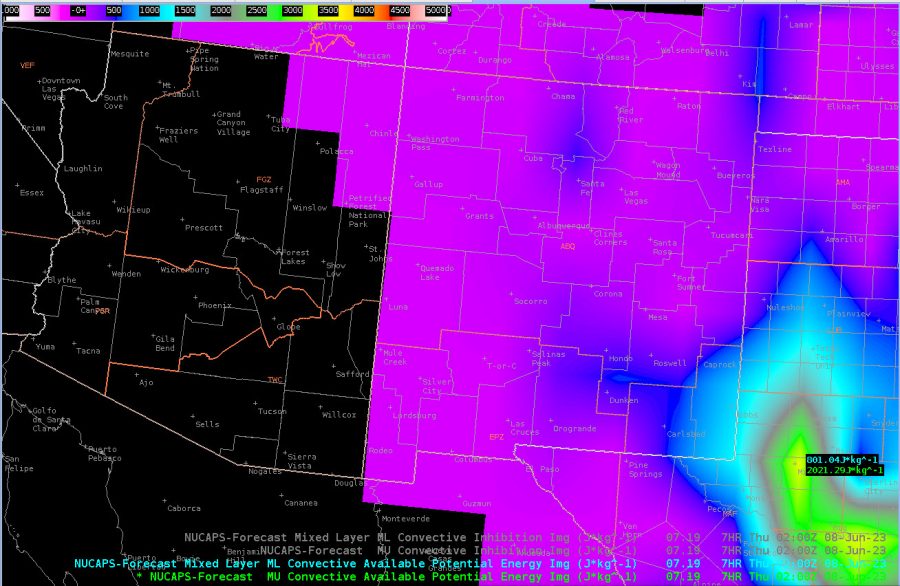
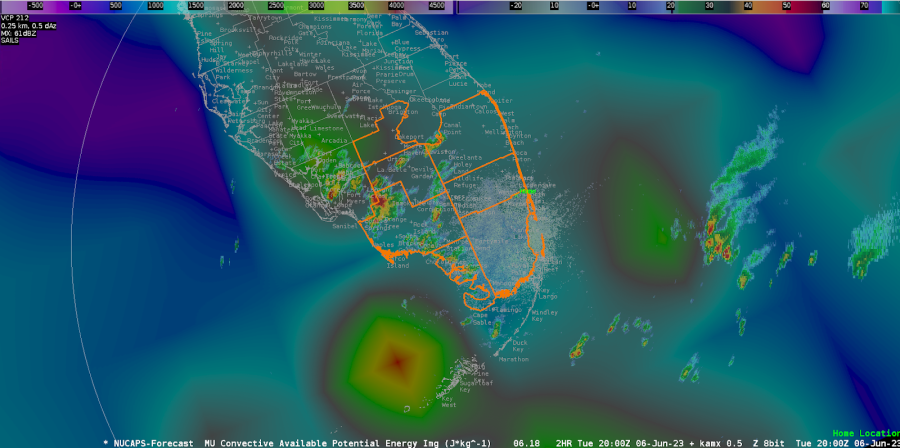
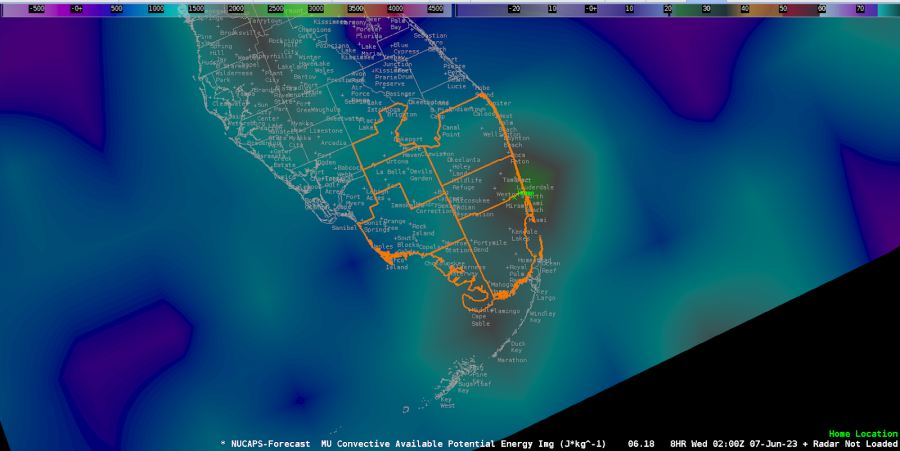
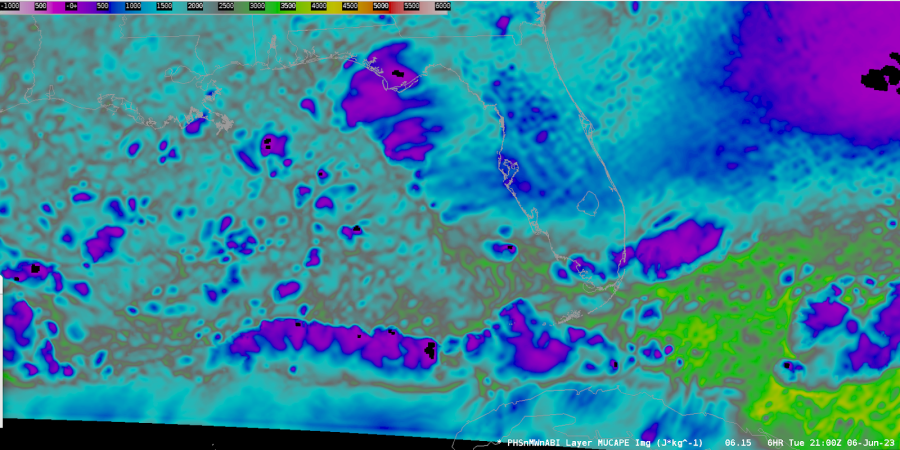
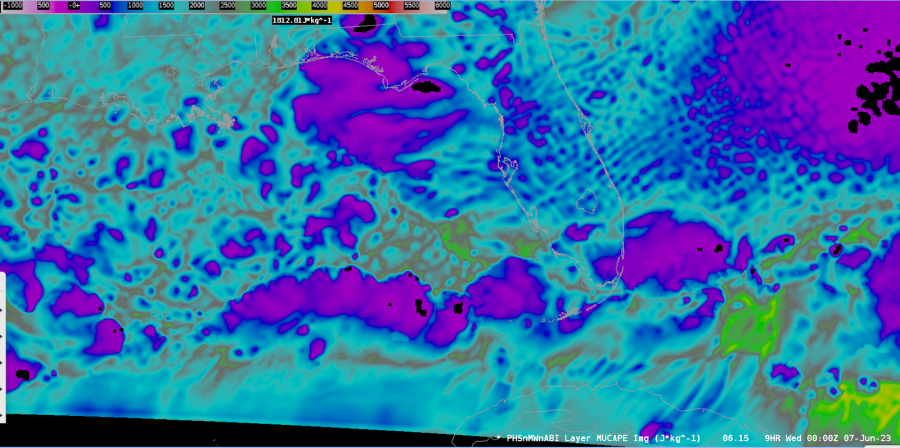
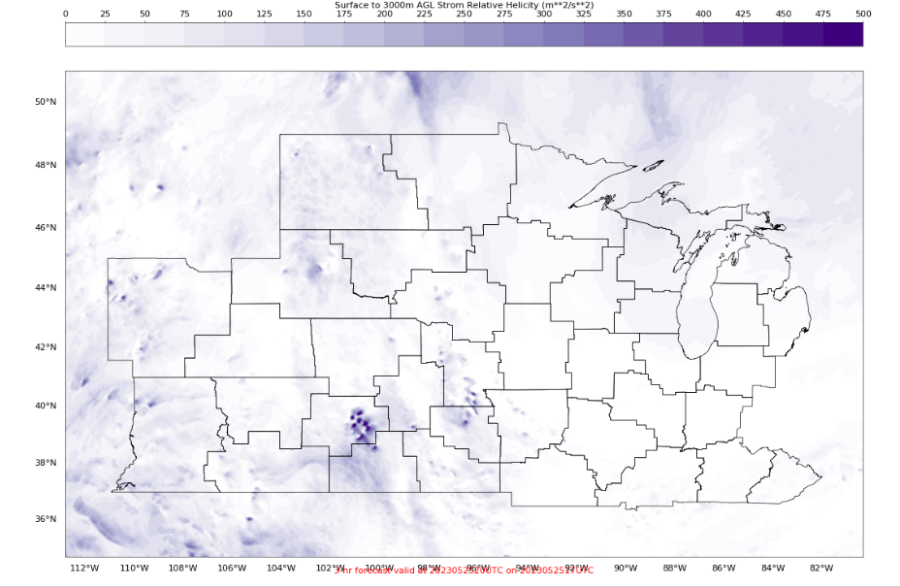
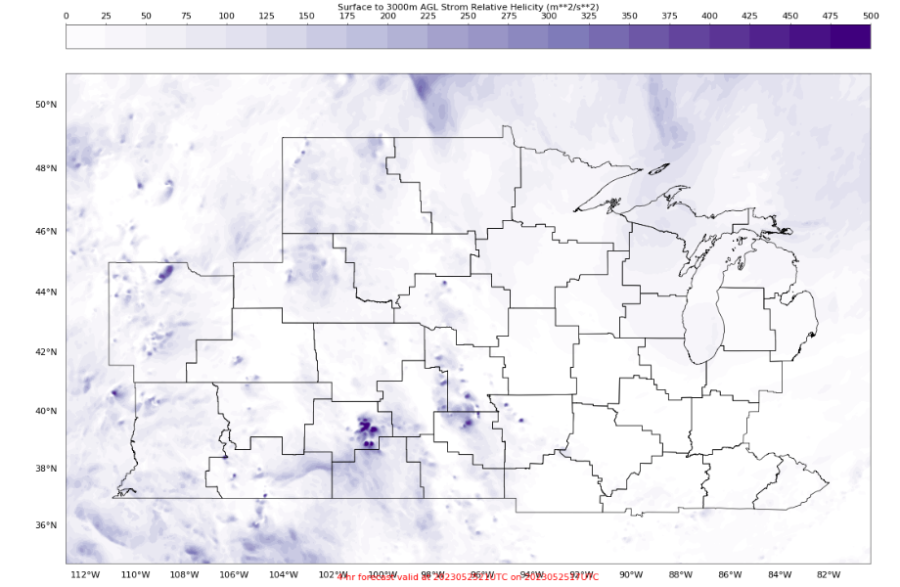
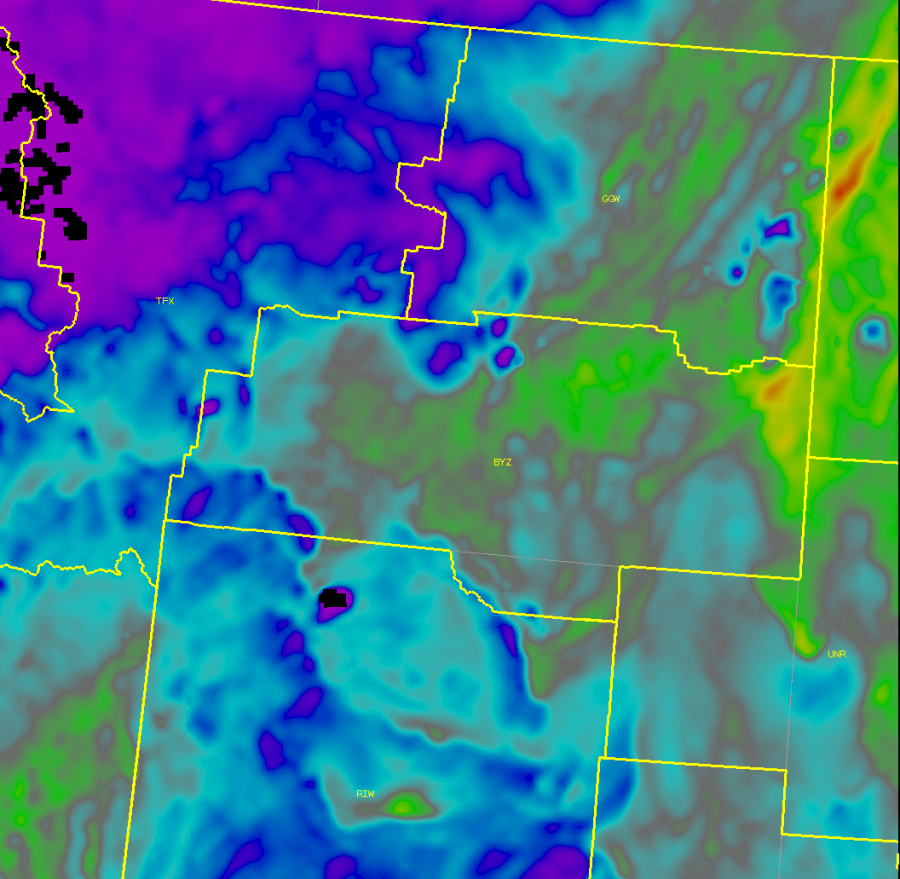
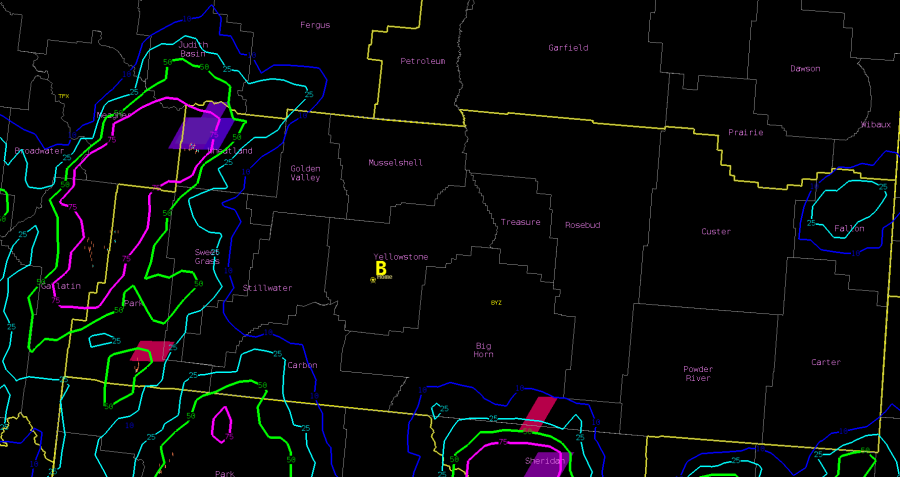
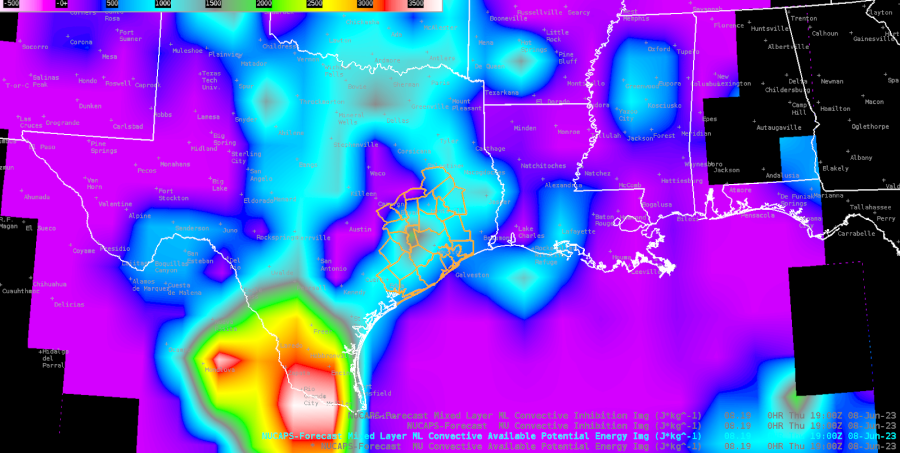
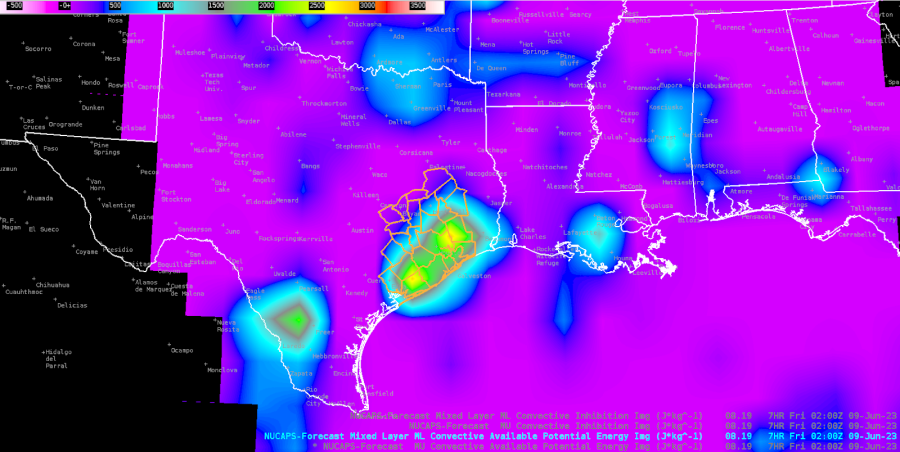
00H NUCAPS-Forecast (NF) is showing moderate CAPE now (1st image below), which may help explain the messy sub-severe multicell clusters, but the forecast valid at 02z this evening shows a resurgence in the CWA (2nd image below).

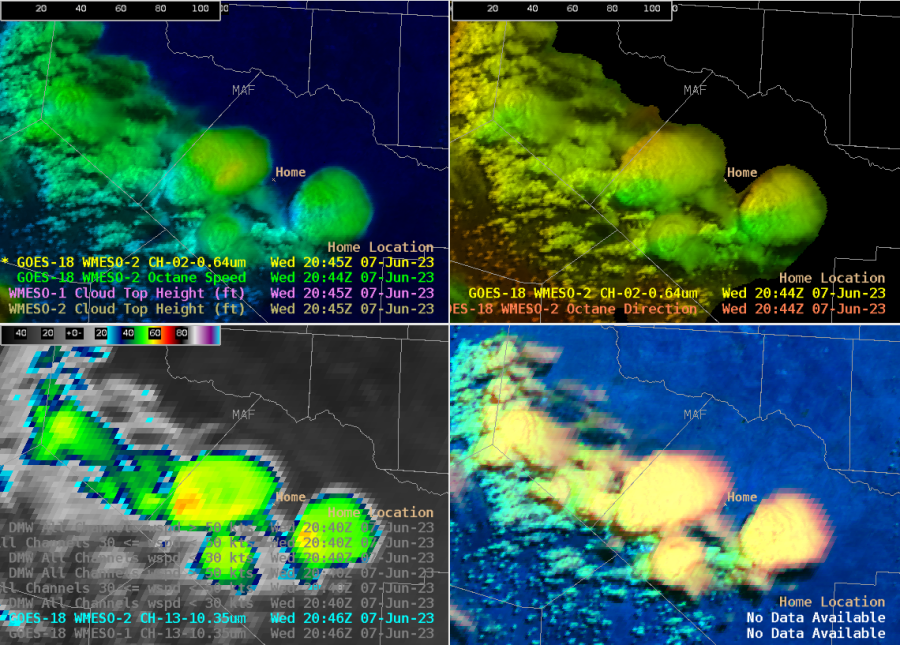
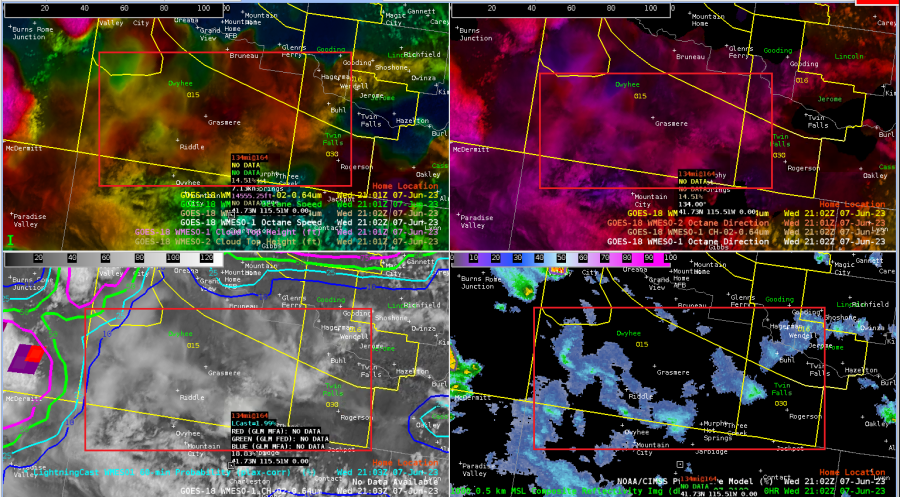
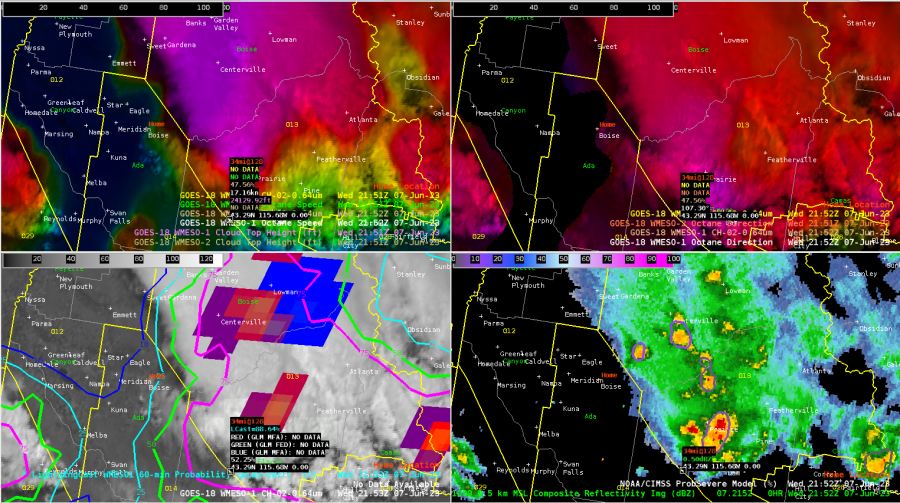
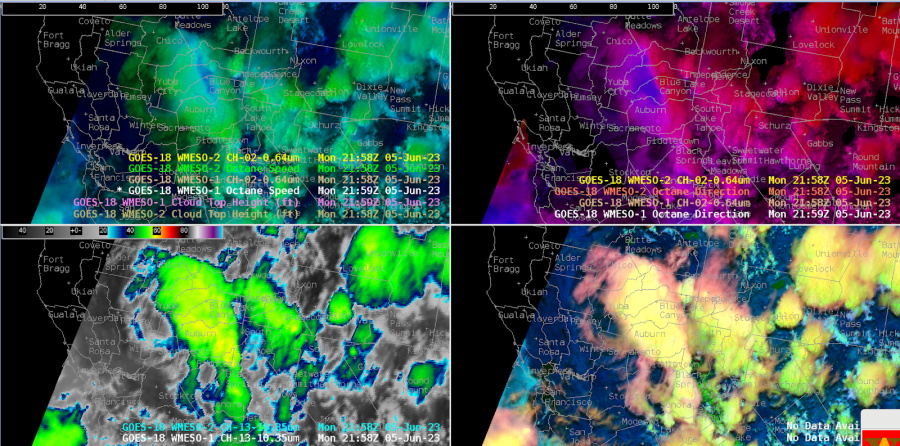
Looking to our NW, one of the stronger cells is outside our CWA, but the Octane direction is showing good cloud top diffluence.

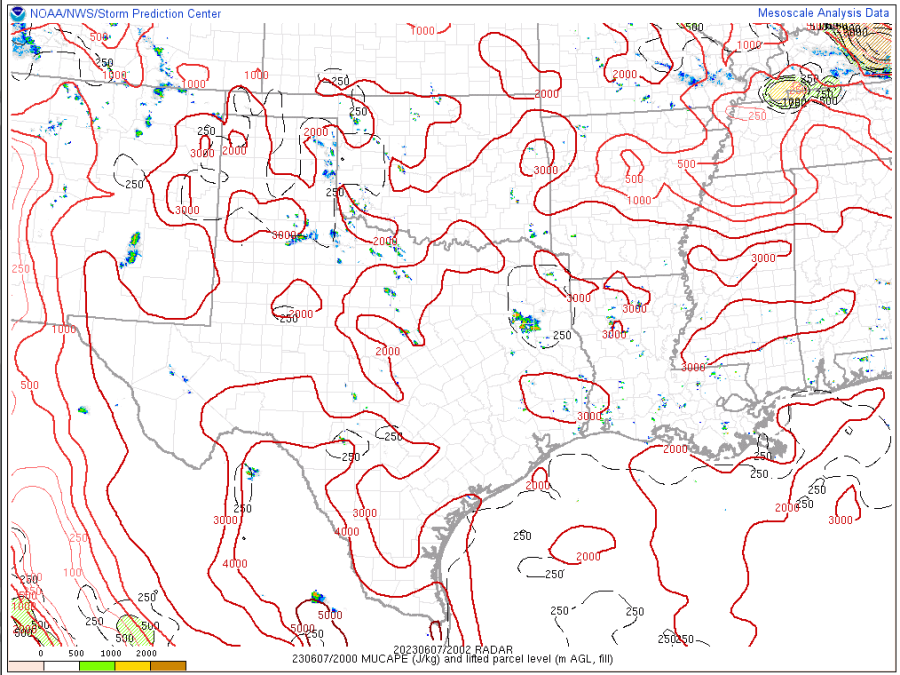
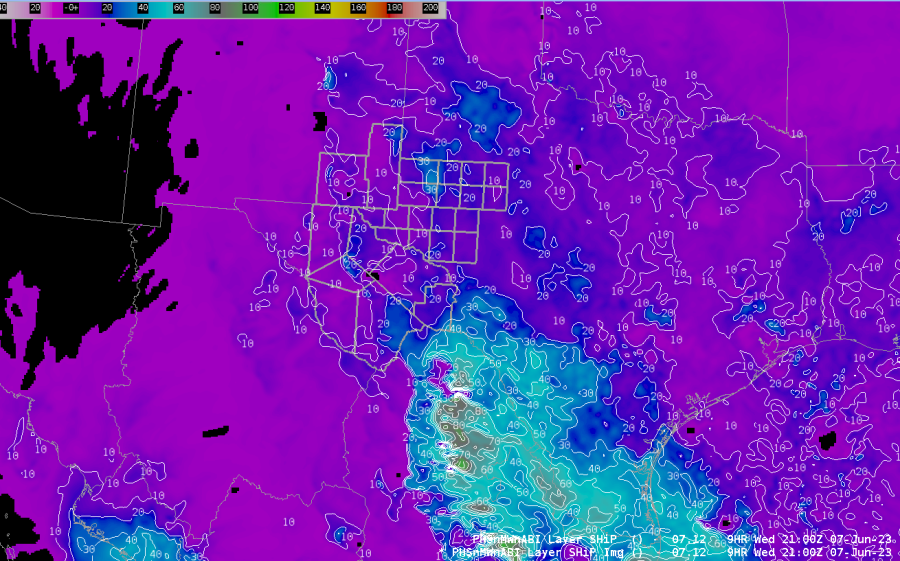
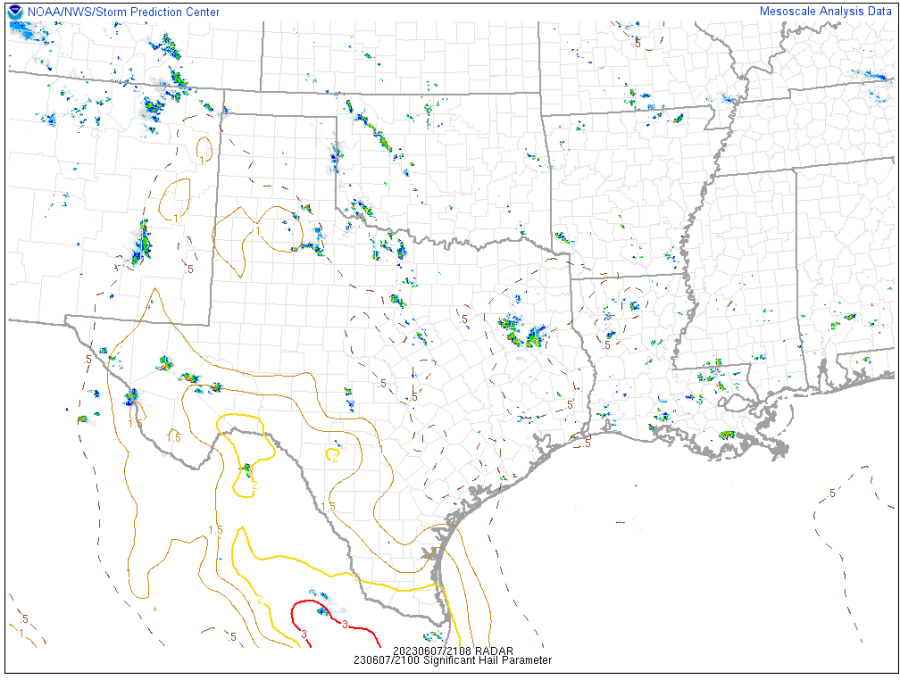
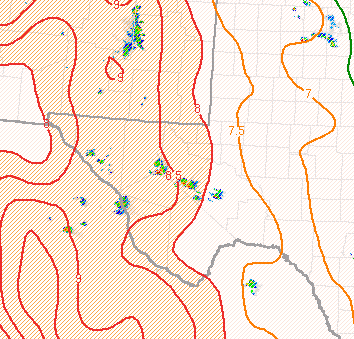
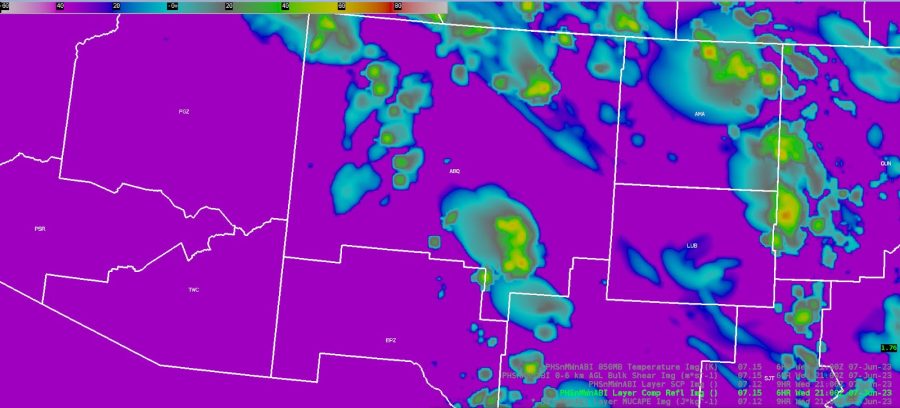
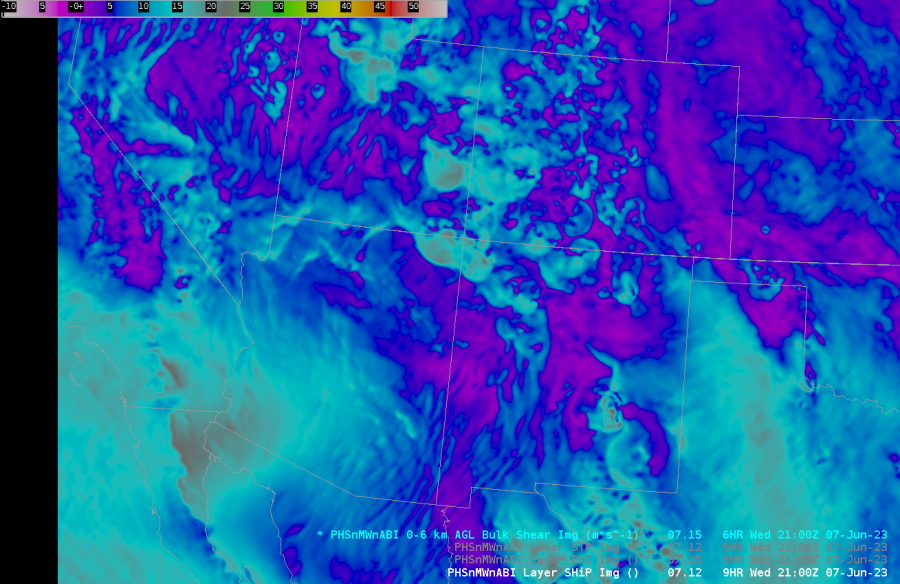
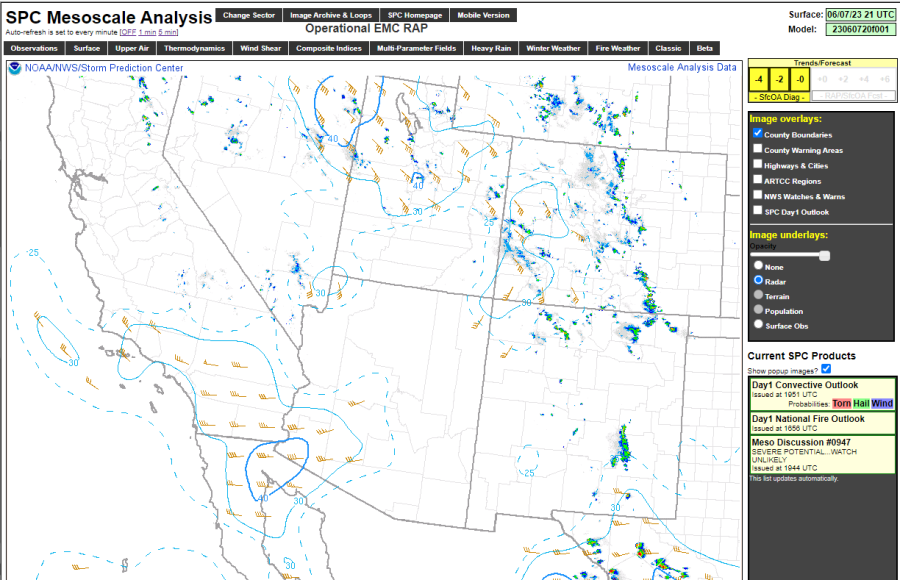
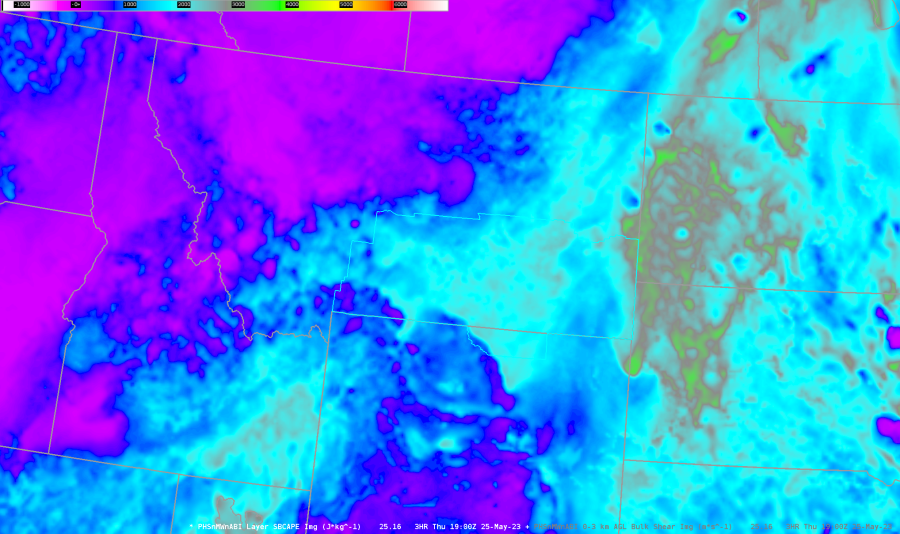
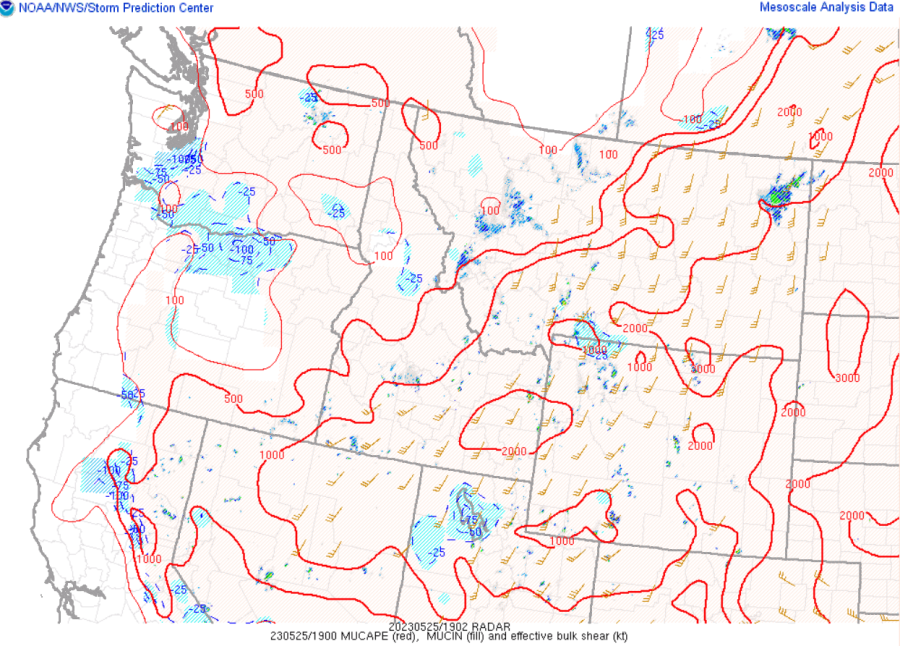
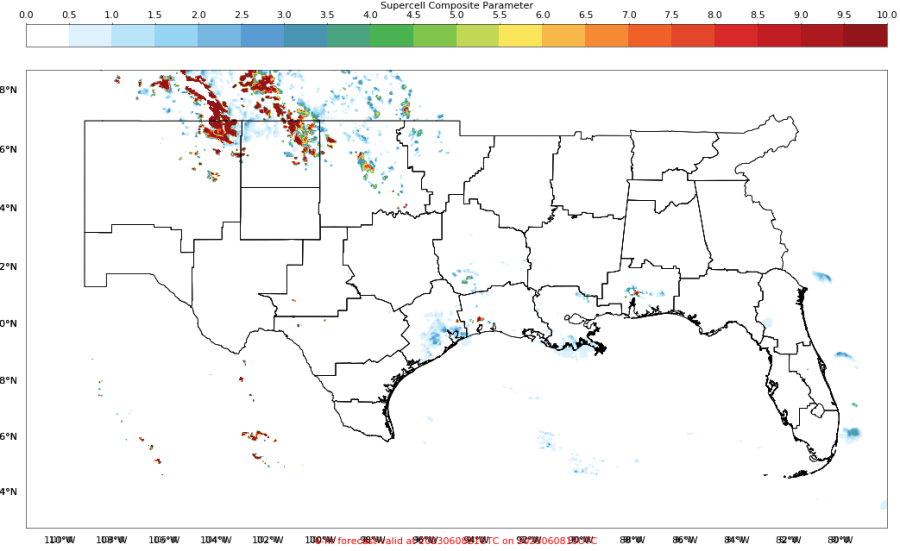
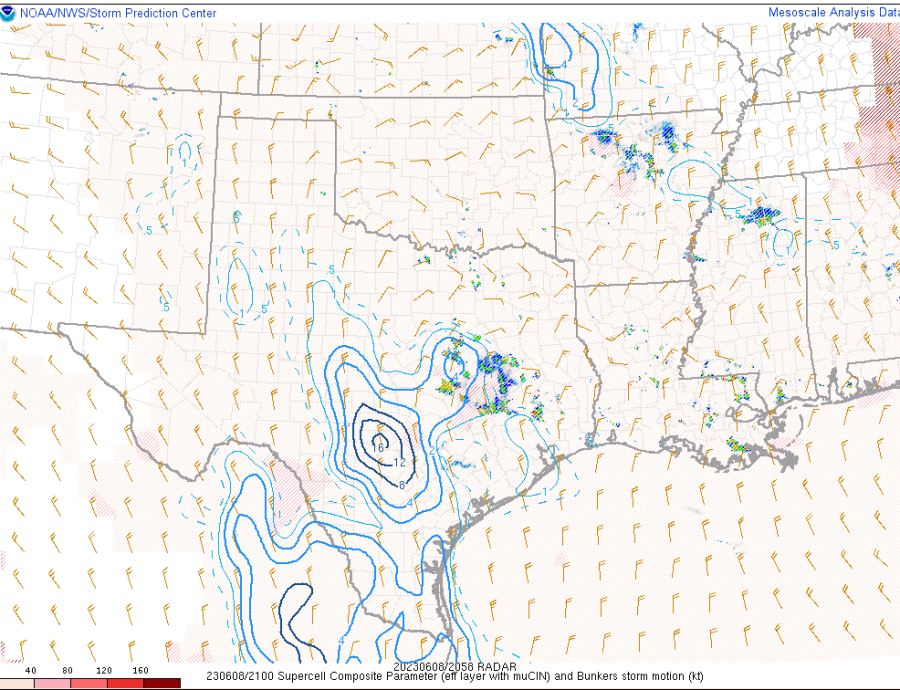
The PHS SCP forecast valid at 20z looks to be around 2-4 over our area, although this doesn’t match well with the SPC meso page SCP, which focuses high values W of our CWA.

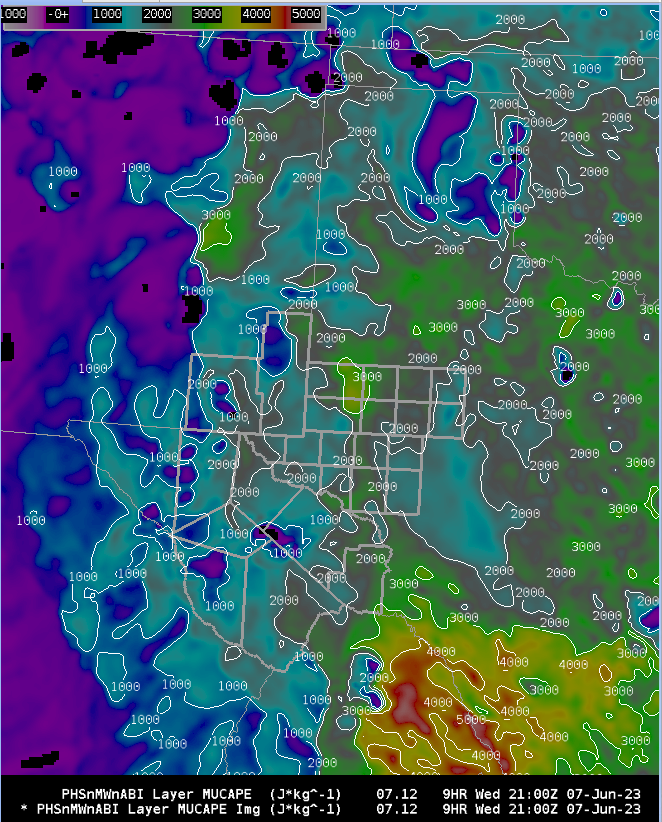
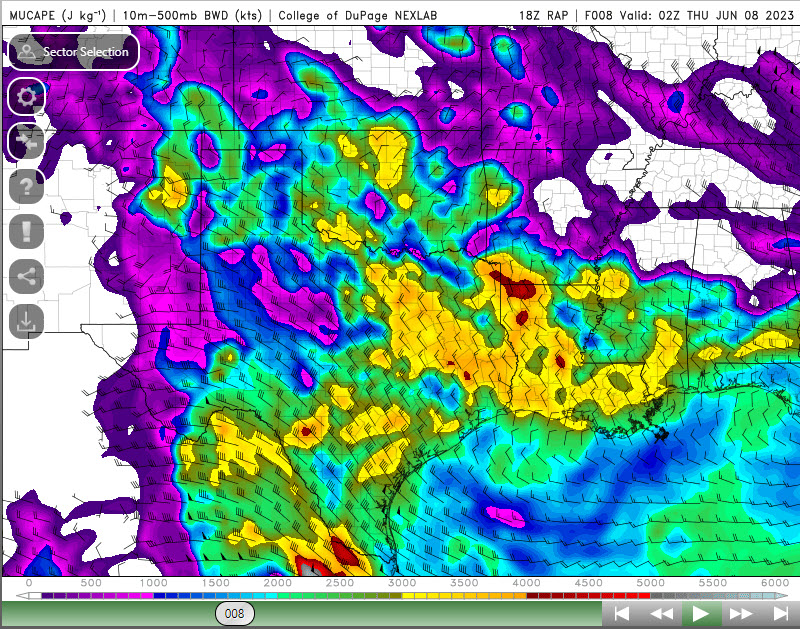
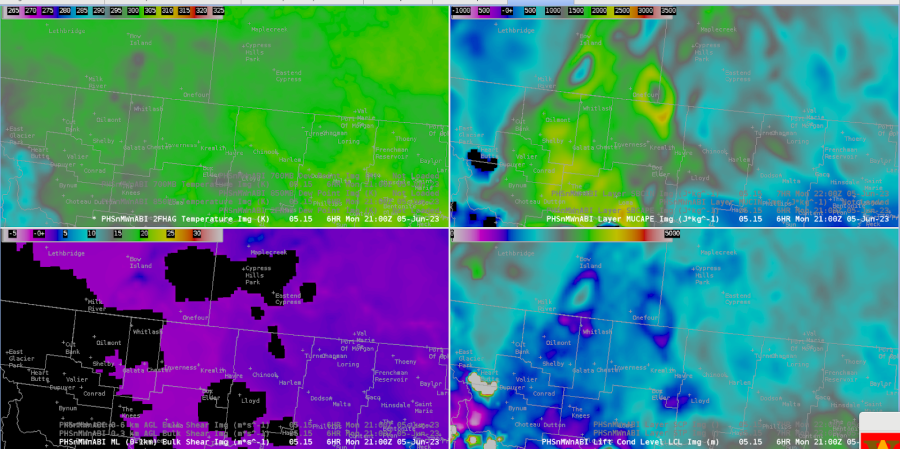
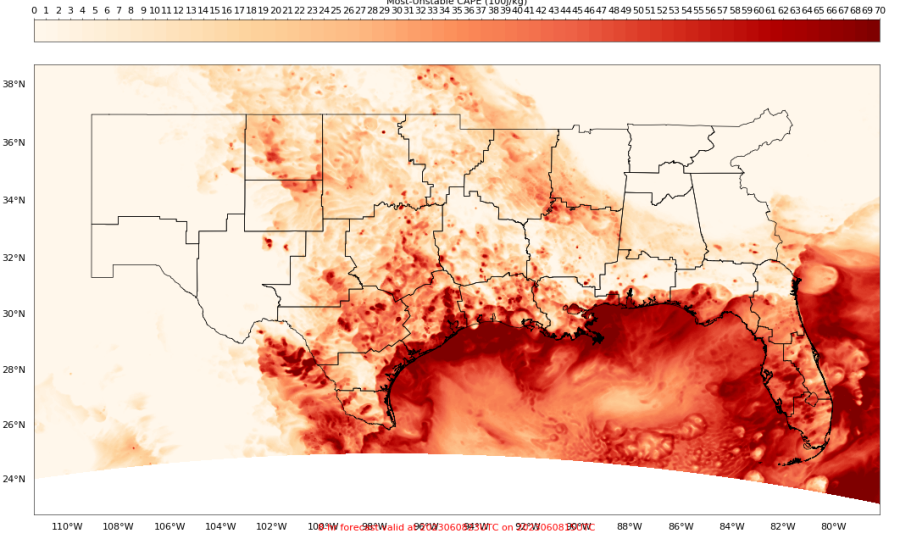
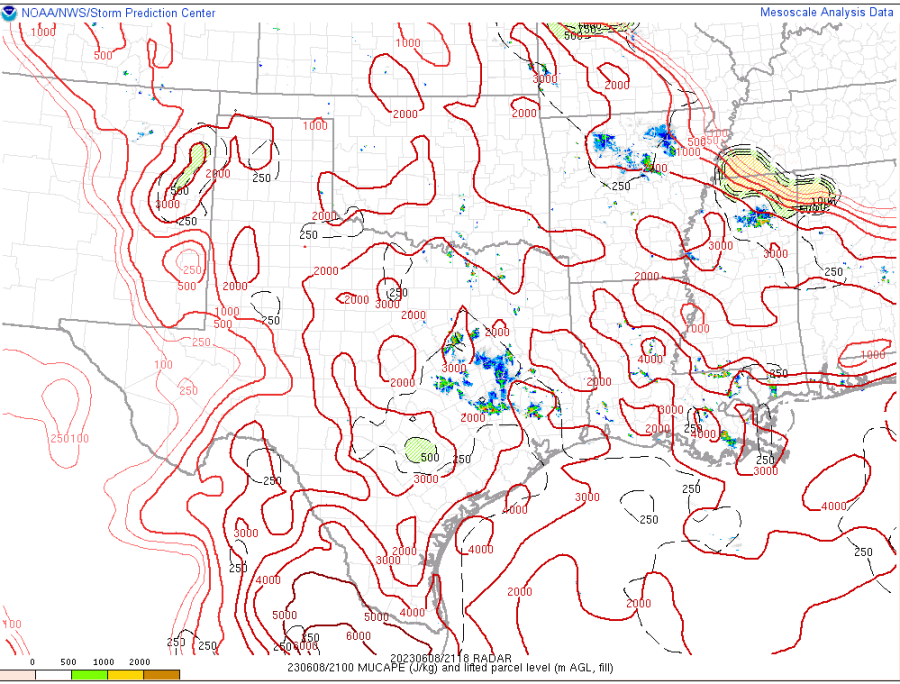
The 21z PHS MUCAPE (15z run) looks like it has insane values of 6000-7000 J/kg near the coast and just offshore. This is much higher than the SPC meso page, showing 3000-4000 J/kg at most.

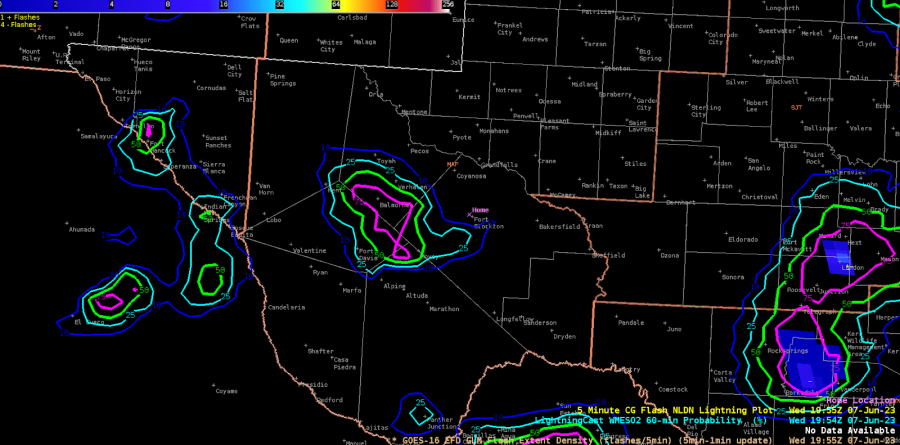
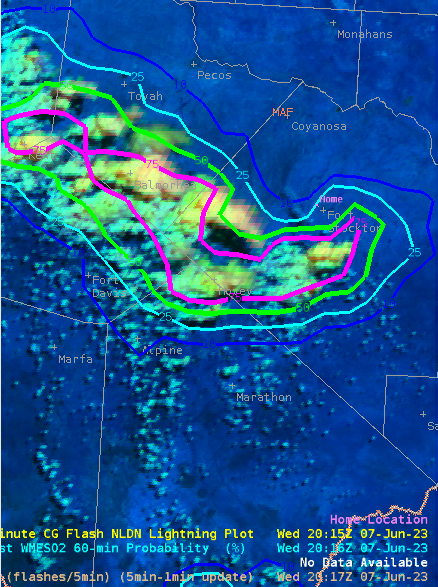
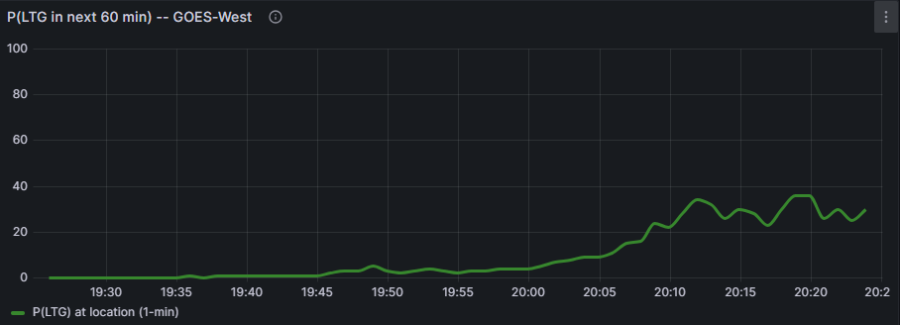
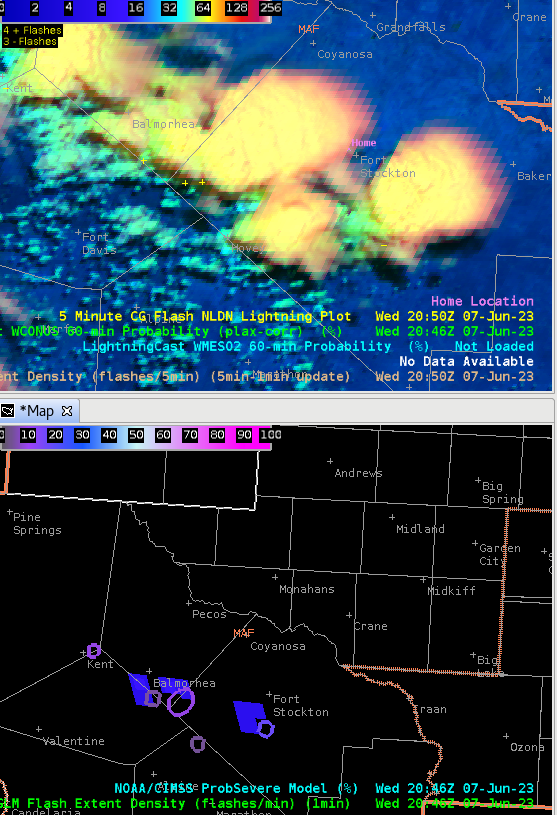
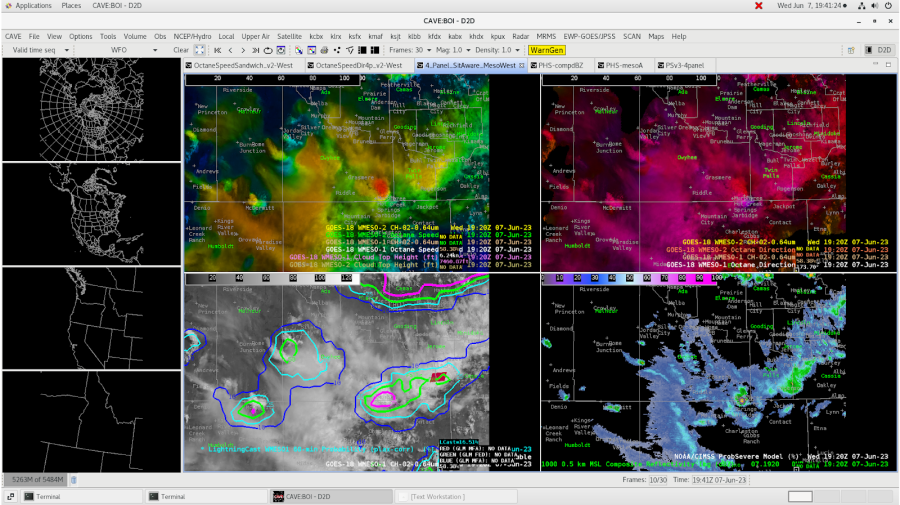
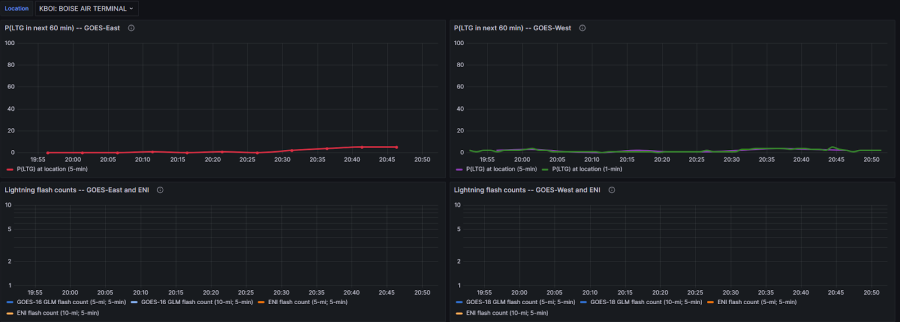
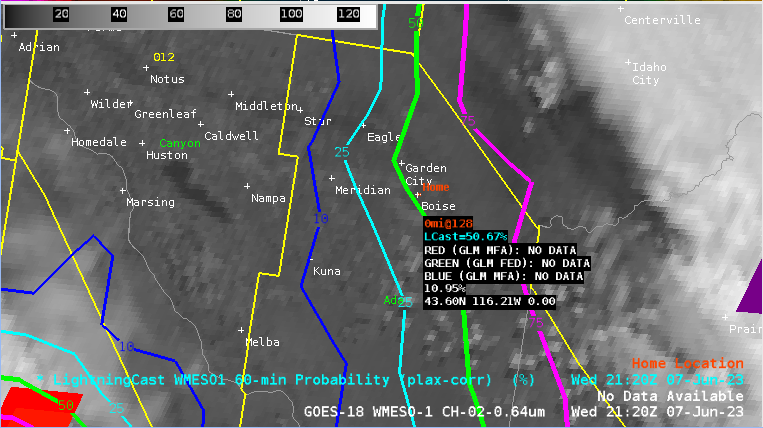
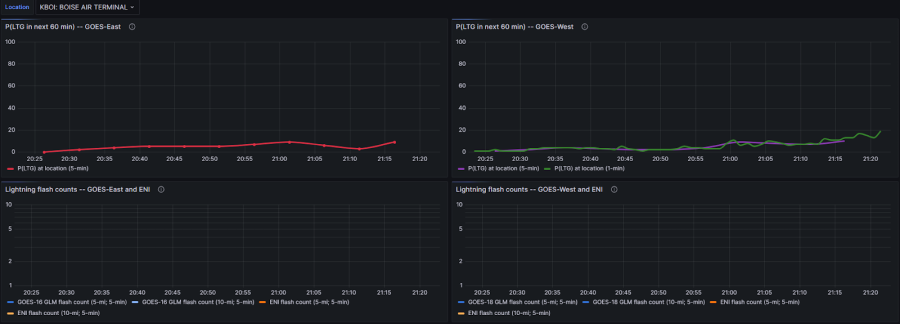
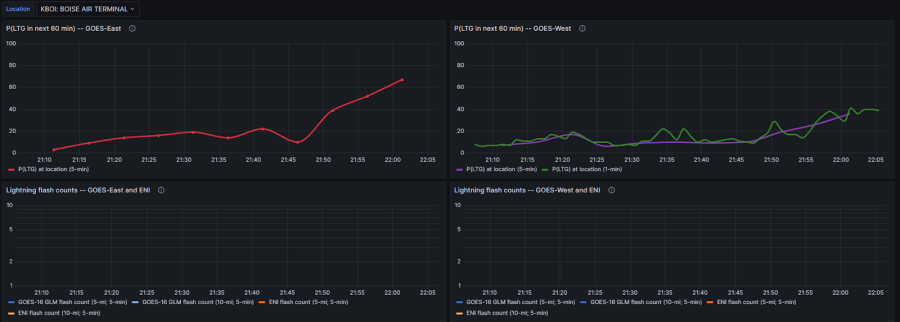
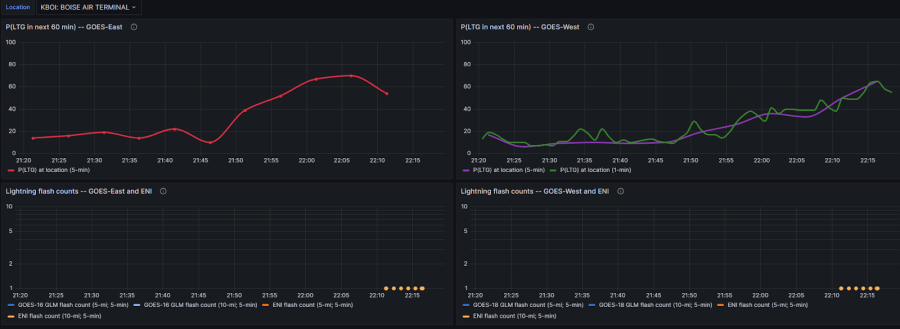
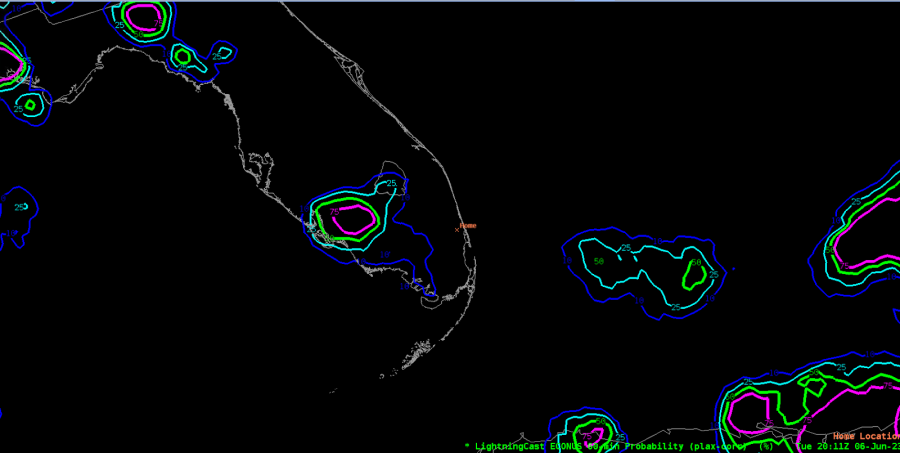
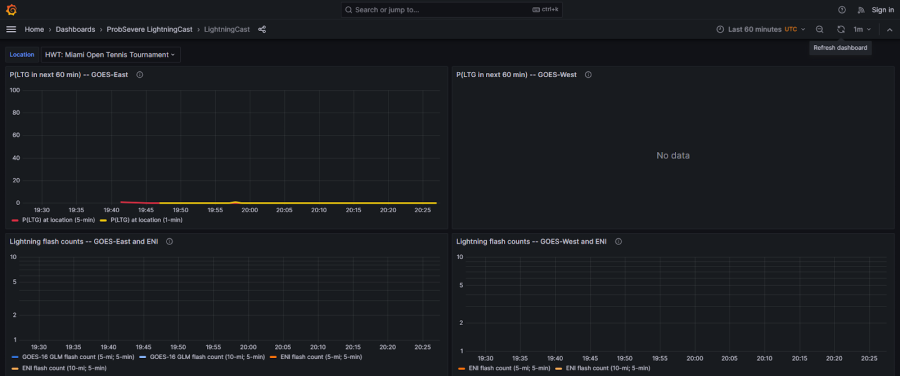
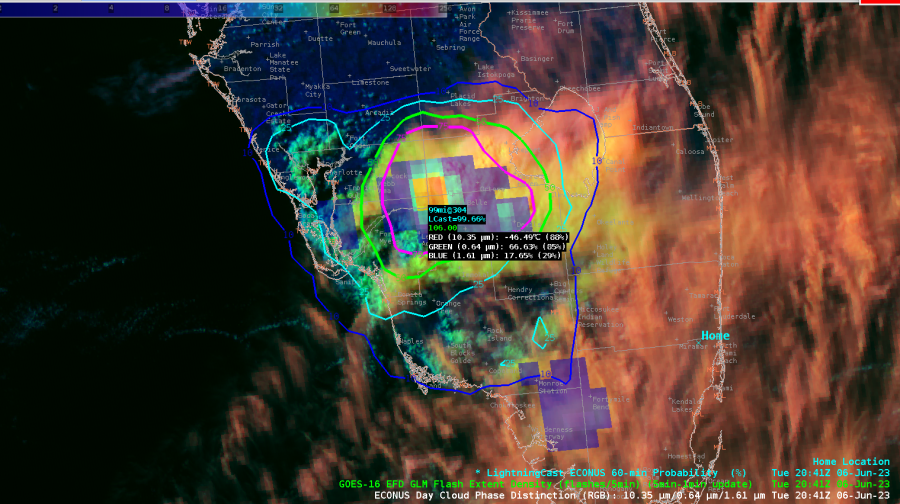
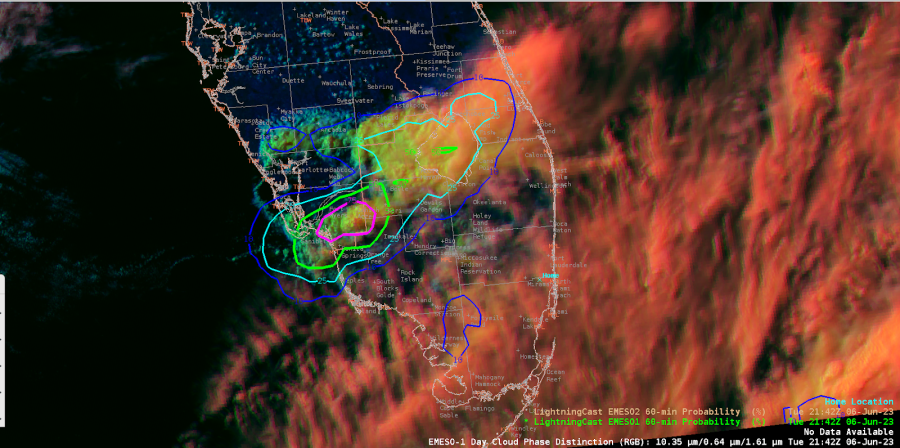
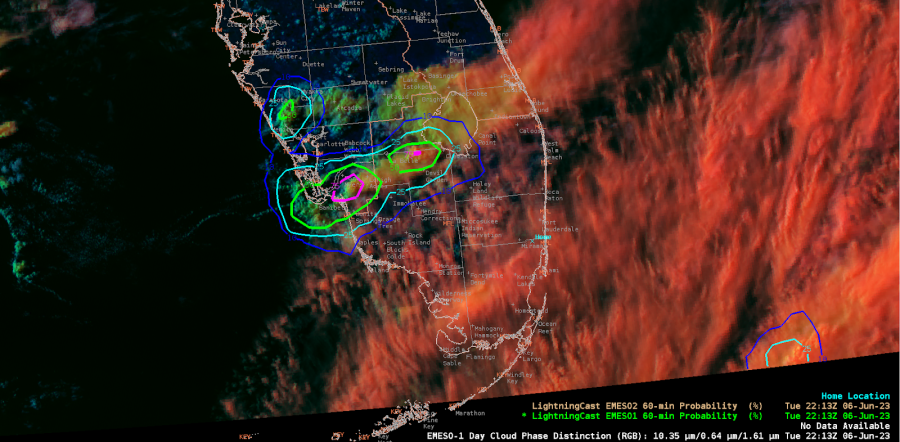
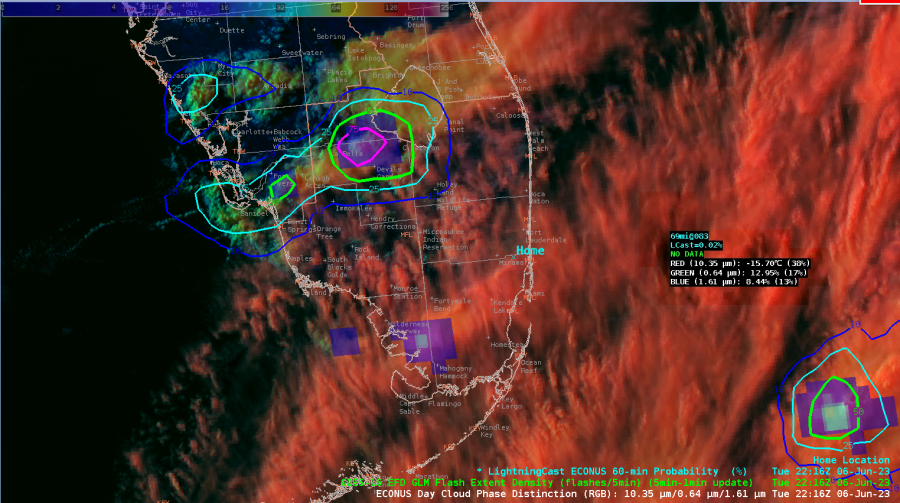
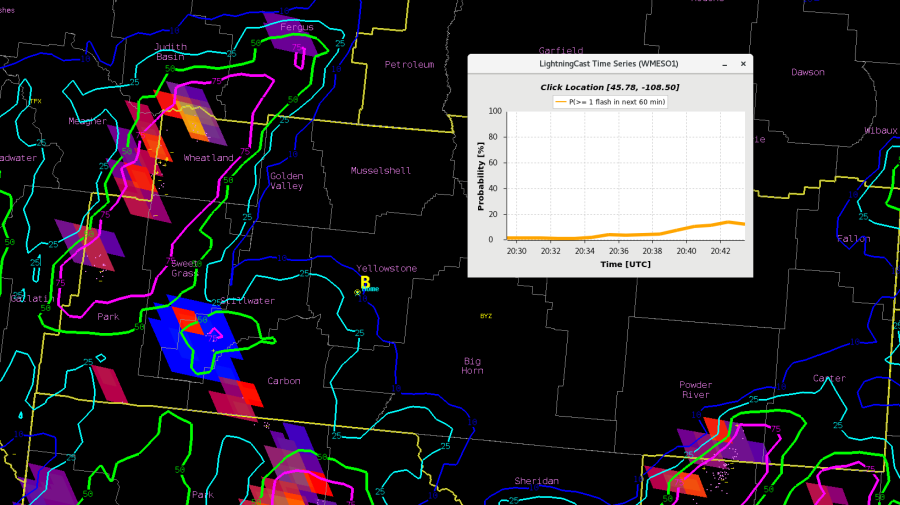
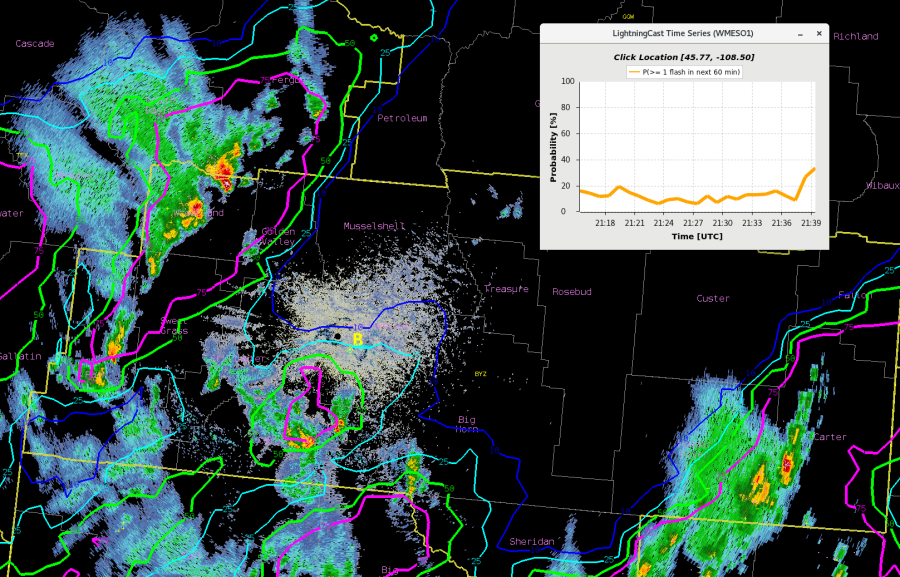
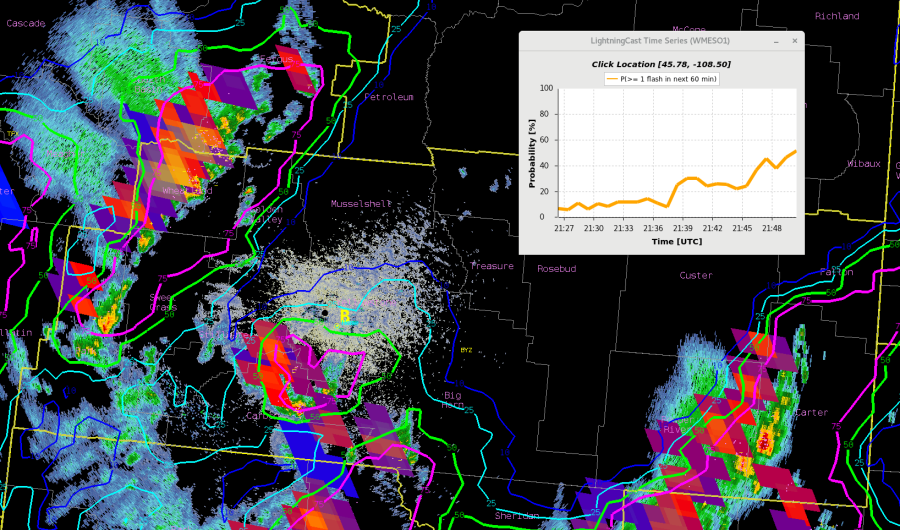
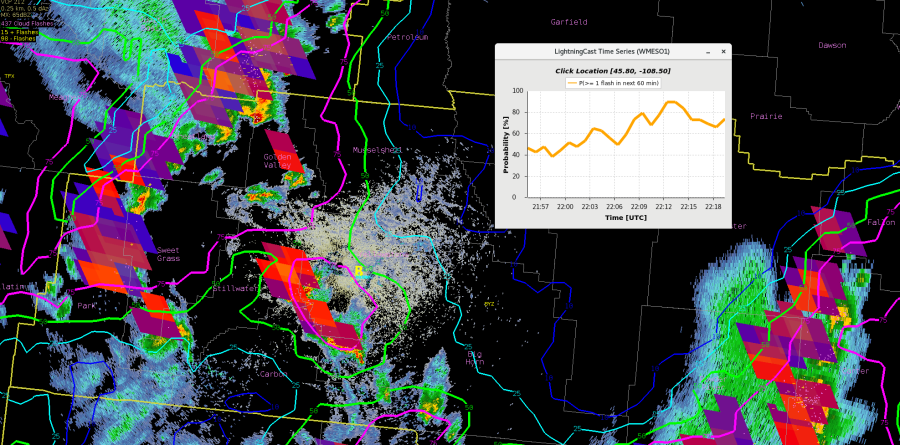
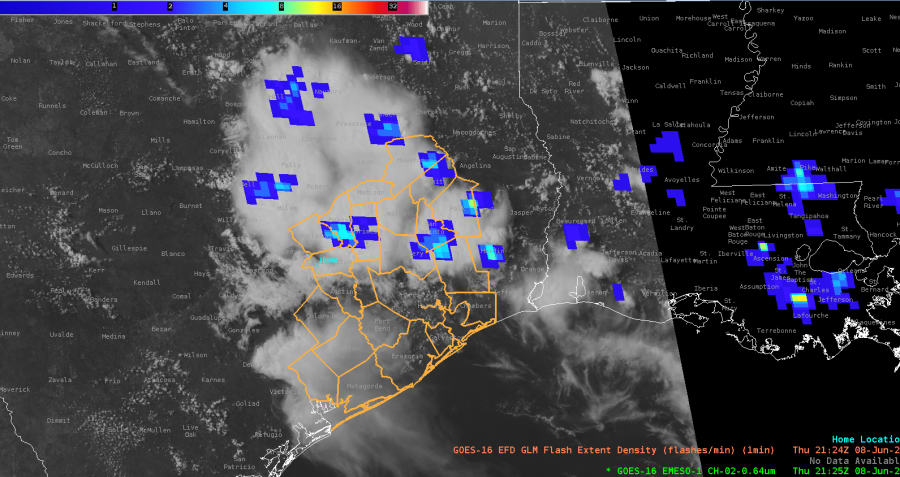
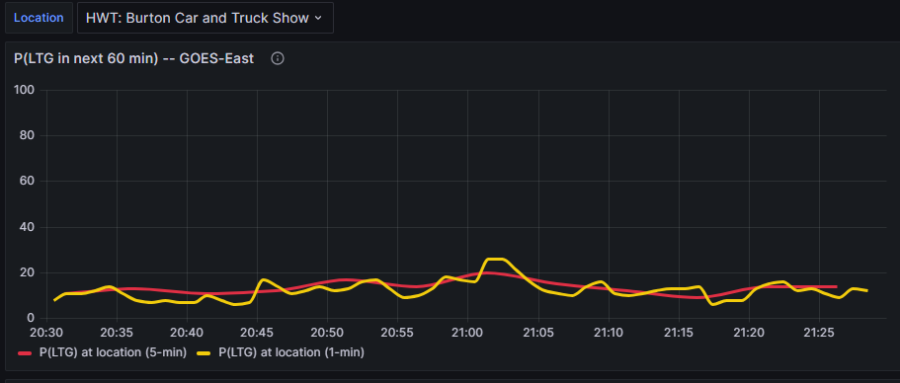
Looking at the optimal application of LightningCast, it seems that the point-based meteogram would work best for CI and in situ developing convection, versus storms propagating into the area. In our case here, at the DSS site, the point-based LC probs are low, suggesting little concern. But we can see from the GLM FED data that there are mature cells with lightning just to the NE that will probably move near the site in the next hour, which certainly poses a safety concern.

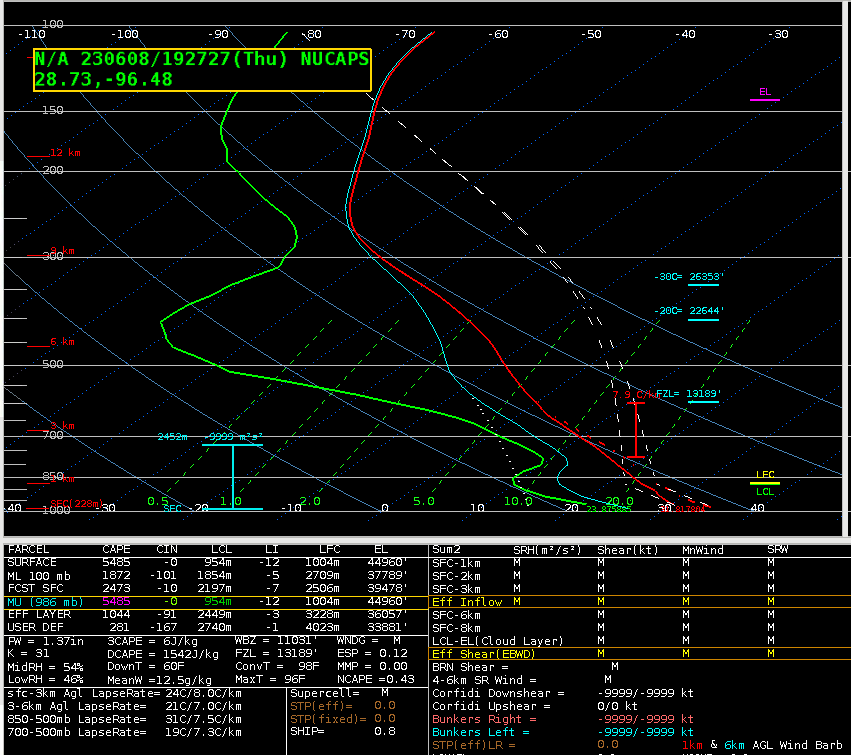
The NUCAPS sounding near Victoria (far SW CWA) showed a lot of CAPE and DCAPE, but a rather dry profile. This is confirmed by WV imagery over much of far S TX.

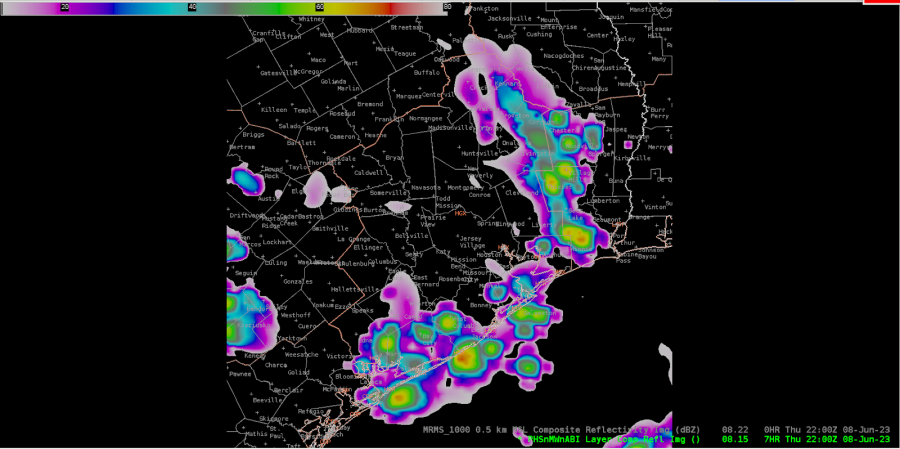
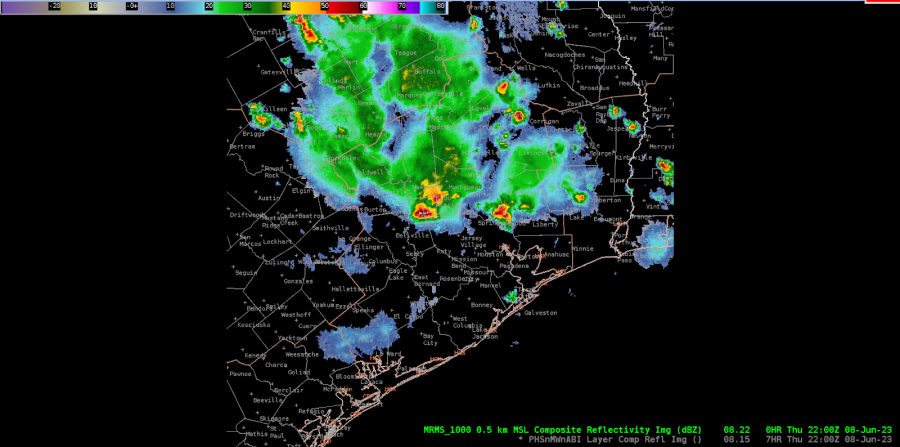
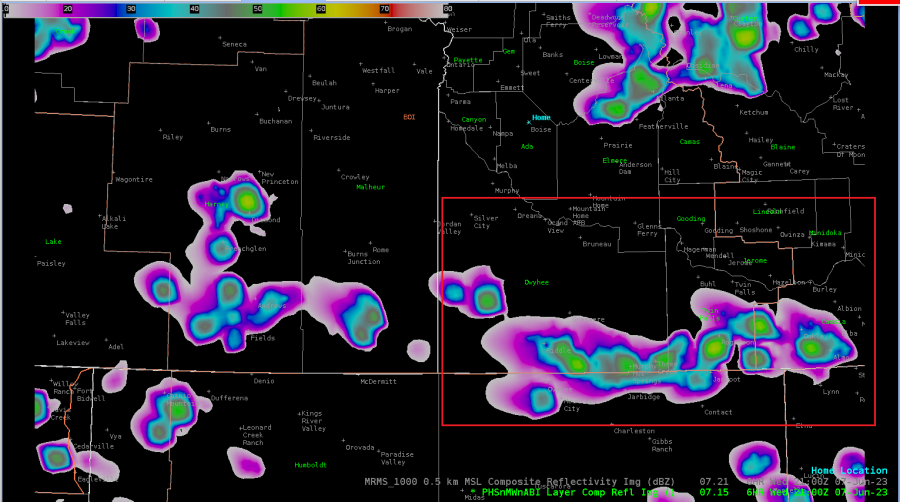
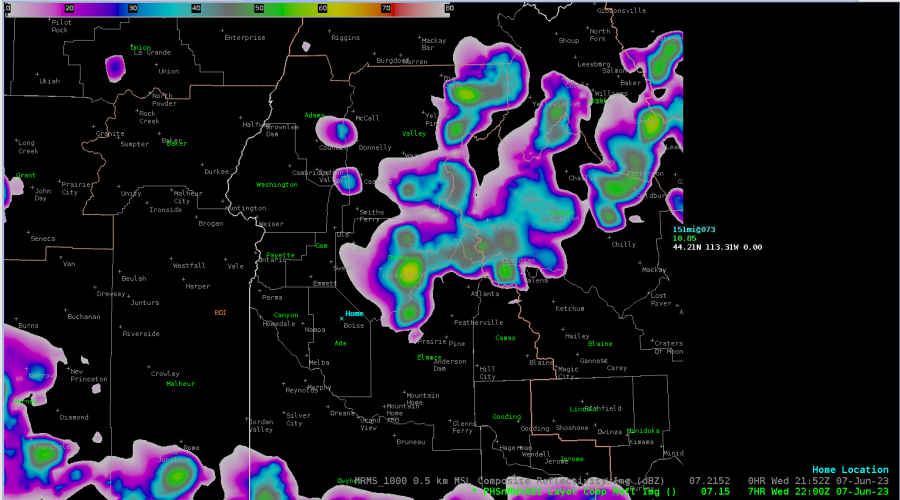
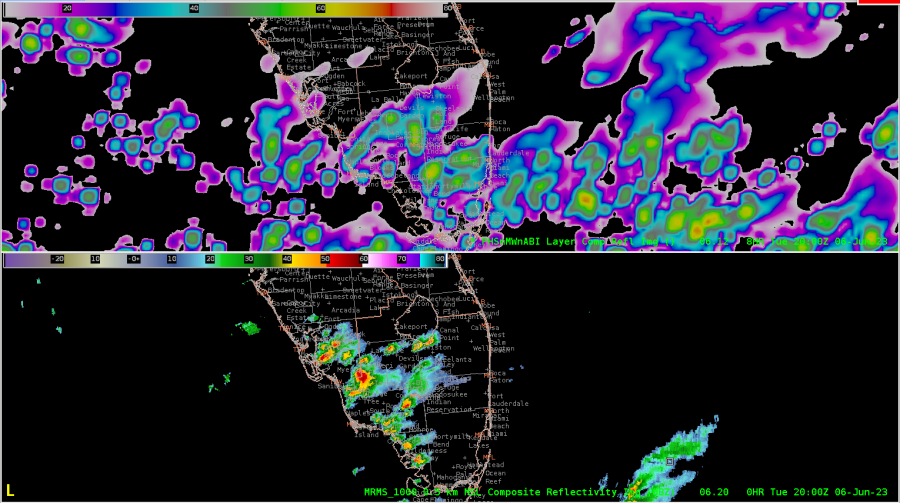
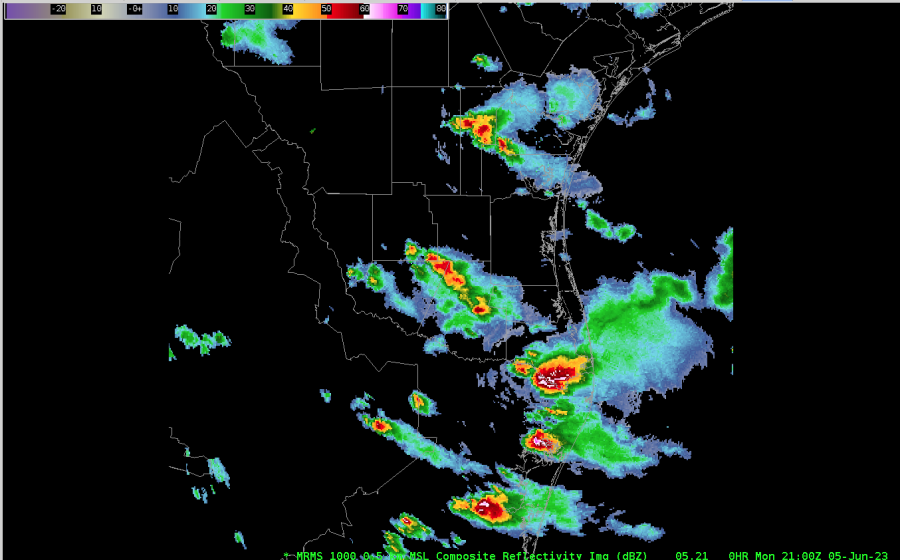
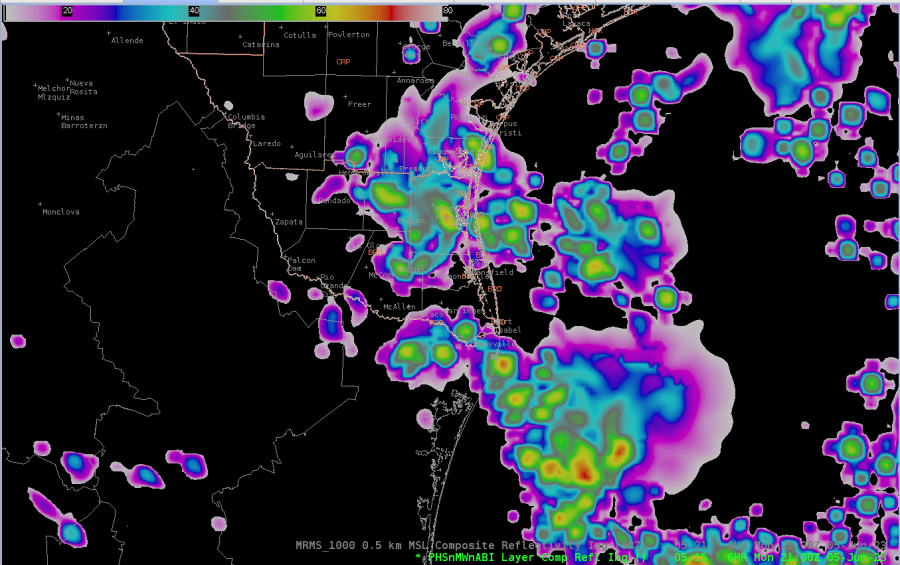
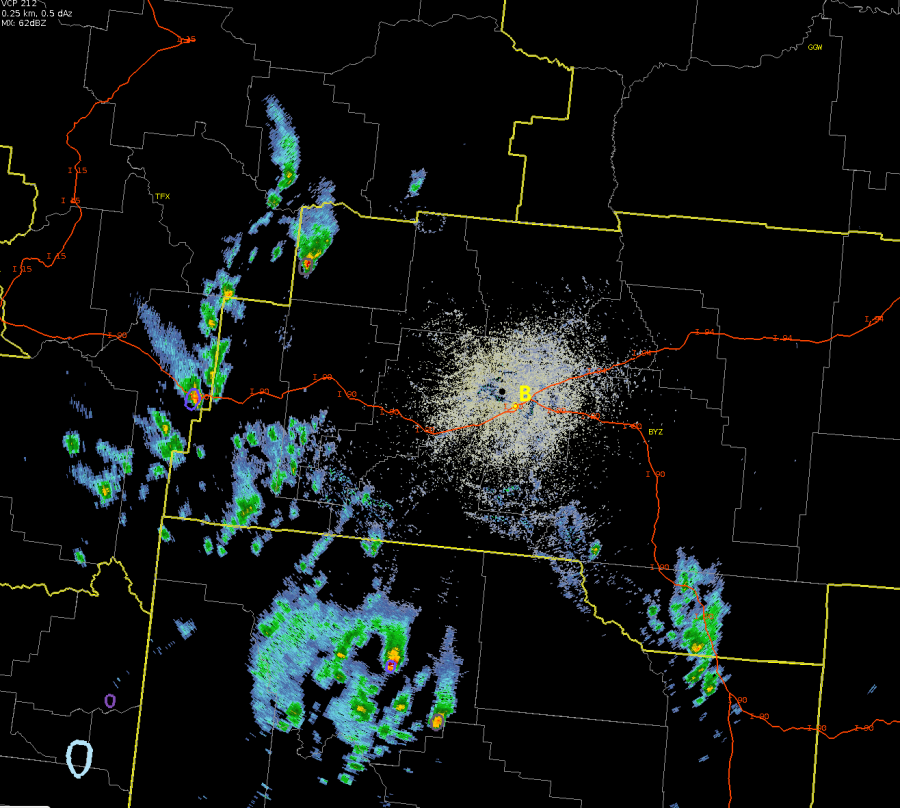
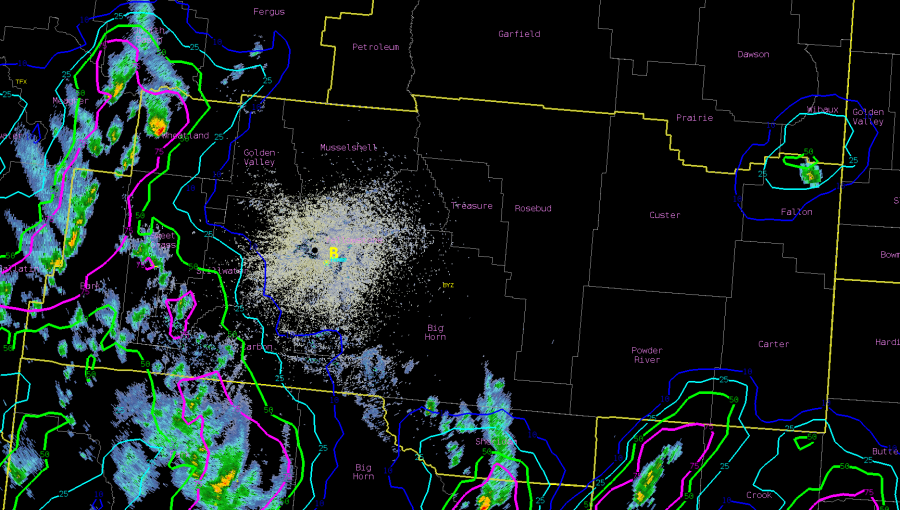
22z PHS Composite Reflectivity (above image) compared to 22z MRMS Composite Reflectivity (below image ) depicting PHS struggling on timing as the cluster of thunderstorms propagate from northwest to southeast.

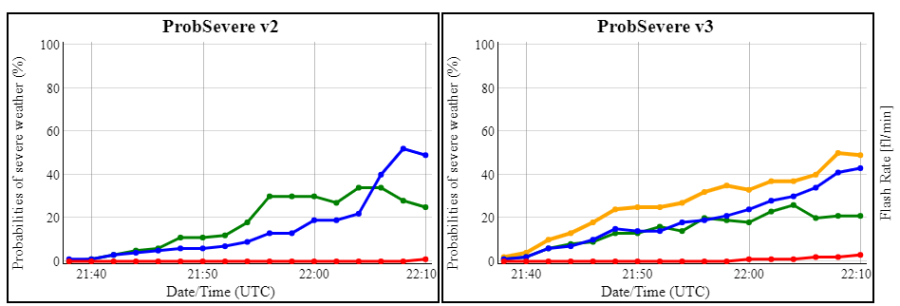
Late in the event, this cell is showing slow strengthening on PS — currently both v3 and v2 have 40% total.

– Edgar and Harvey Specter

Tags: None

MAF Convection

Convection has been slow to initiate in W TX, but we’re finally seeing some vertical extension and greater texture in the CU field on the NE side of the mountains. LightningCast is now showing higher probabilities in this area, after several scans of sub-50% contours.

We are seeing good destabilization. The PHS MUCAPE compares quite well to the SPC mesoanalysis.

LightningCast probabilities continue to climb, and we’re finally seeing a few flashes on GLM imagery.

Our LightningCast meteograms are finally showing some higher probs in the next hour near our DSS site in Fort Stockton.

We’re now seeing more defined features in the Octane imagery, including cloud top divergence signals and cooler brightness temps, down to -63C. But our ProbSevere markers remain low.

Looking at the NUCAPS-Forecast initialization at 19z, the mid level lapse rates are lower in areas NE of the higher terrain, where convection has been a bit slower to strengthen, as compared to the storms to our SW over Mexico, where MLLRs are higher.

The new TPW imagery from NUCAPS shows well the delineation of the moist air to the E and drier air to the W.

The PHS SHiP pattern looks good, but its magnitudes appear way off, compared to the SPC meso page and how SHiP is calculated.

Hail probs are exceeding 80% now on ProbSevere, although our GLM lightning is rather low! Interesting how assumed large hail presence doesn’t necessarily equate to classic charge separation that would prompt high electrification.

21z 700-500mb comparison of SPC Meso (top) vs 21z NUCAPS-Forecast (bottom)
    – Some differences in lapse rates between the two, with NUCAPS about .5-1°C/km  lower than SPC Meso page. 

ProbSevere, Octane, and IR imagery supports warning issuances for Reeves and Pecos counties.

With the warning now out for Reeves and Jeff Davis counties, this storm continues to exhibit high hail probabilities on PSv3.

Up to 120 kts of ST divergence with the warned cell (at about 50 kft).

Interesting how ProbSevere identifies objects. There appears to be 3 separate updrafts in Pecos county, however PS is seeing one object.

– Edgar and StormofCentury

Tags: None

Examination of LightningCast and OCTANE in Idaho and Oregon

Near the Idaho/Oregon border, we observed splitting cells on the afternoon of Wednesday, June 7. We believe we were able to see the first hints of this process get underway with the help of the OCTANE product. Subtle gradients were observed on the left side of the main storm prior to the ultimate cell merger. 

In the image on page 2, we see a nice comparison using LightningCast between an environment characterized by cirrus contamination vs an environment that was not contaminated. On the eastern side of the CWA that was characterized by cirrus contamination, LightningCast probabilities peaked at 50% on a storm that ultimately produced lightning. In contrast, two thunderstorms to the west (developing in a clear, cloud-free environment) both saw LightningCast values exceed 80% on two storms that ultimately produced lightning.

Above, we see perhaps the first instances of a splitting cell in progress, and OCTANE helped give us a first indication of the split (upper left in particular)

Above: LightningCast Meteogram as of 2053z, depicting a small trend upwards, albeit extremely minimal, within the next 60 minutes for some lightning impacting the American Aquarium at Hayden Beverage in Boise (DSS location).

Above: 21z PHS shows development of convection in Owyhee and Twin Falls counties (southern BOI CWA) depicted by a red box; however, the 4 Panel Situational Awareness is indicating that doesn’t seem to be the case, with mere cirrus cloud development. Perhaps the timing is off?

Above: On the other hand, PHS is doing a fairly good job depicting the convection just east of the DSS site. Currently (almost 22z), a few decent cells depicted by ProbSeverev3 (right around 15-18% probability, where MESH values are just over 0.50”)

Above: 2123z: LightningCast indicating just above 50% probability of lightning within the next hour yet the Meteogram is well below 20% for the GOES East reading. It is suspected that this is because the AWIPS readout is Plax-Corrected, whereas the Grafana Meteogram may not be?

Just after 22z, Grafana Meteogram (above) shows GOES East  ProbSevere Lightning to be 67%. This latency further aids in the belief that the Meteogram is not Plax-Corrected.

As of 2220z, downward trend displayed with regards to the Grafana Meteogram (topped at 70%, now showing 54%). This is indicative of the cells east of Boise (DSS area) initially showing signs of weakening…HOWEVER…

Things are starting to get juicy at 2224z with ProbSevere v3 showing the cell south of Idaho City has increased to 36% probability (below).

– Bolt and Harvey Specter

Tags: None

Albuquerque HWT

Storms are exhibiting some decent shearing aloft over NW New Mexico when comparing to NE New Mexico. Something I might not have noticed had I not had this product as I don’t always have time to go into the SPC mesoanalysis and check various levels of shear values. The 0-8km shear values are in the 40-50 kt range, in agreement with the range of values noted on the speed shear values of OCTANE. See below.

PHS really doing a nice job of pointing out peak areas of MUCAPE and where storms will likely develop. Decent scale and resolution results in some good quality comparisons with various other products. This is over the southern ABQ CWA.

Forecast Layer Comp Refl 21Z

Forecast MUCAPE 21Z

Forecast MUCAPE 23Z – Also, noting a sharp gradient in MUCAPE values as convection strengthens over east-central New Mexico late this afternoon into the early evening hours. We will have to see how this plays out.

MUCAPE values seem a bit higher than they should be when compared with the MLCAPE values at the same times over New Mexico. I’m not exactly sure why the values are so high, but the forecast RAP values for the same time frame appear to be notably more displaced to the east and lower.

Example below from forecasted time 02Z.

The 6 hour forecast at 21z of PHS 0-6 km Bulk Shear (first image) is compared against the 21z SPC Mesoanalysis (second image). Overall, the PHS forecast did quite well over New Mexico. There is generally little to no shear across the state except for near the Four Corners in the northwest and far southeastern New Mexico. The values are reasonable in these areas as well, around 16 m/s for PHS which fits in with the over 30 knot SPC values.These differences can be noted in the convection occurring as well (seen in the SPC image). Mainly isolated cellular over central NM, but showing more organization in the areas of higher shear.

-Satellite Steve and Burton Guster


Tags: None

Monitoring South FL Convection for the Miami Open

We’re closely monitoring for CI near the Miami Open Tennis Tournament (location noted by the Home marker). Thus far this afternoon, the deepest convection has been in the west, NE of Naples, where the Band 13 imagery shows high cloud tops with cool brightness temps (-66C), and Octane imagery shows a good divergent signal.

So far, LightningCast has focused on the convection in the western peninsula, with the maximum slowly translating inland and to the N along the inland-tracking sea breeze.

This is further confirmed by the lightning meteogram for the DSS site. Looks like they can keep playing tennis for a little bit longer!

Looking at the storm clusters back west, a NUCAPS sounding near that cell shows plenty of CAPE.

The NUCAPS-Forecast MUCAPE confirms the high CAPE invof the storms.

Let’s see what the forecast shows for our DSS event. By 02z this evening, it shows increasing CAPE invof the DSS event. They are not out of the woods yet!

However, ProbSvr3 and LightningCast continue to provide a general idea that the strongest cell remains north and west of the Miami Open, limiting any impacts during the event.

Looking at the PHS imagery, it shows continued moderate CAPE extending into SW FL invof the ongoing convection, with much lower CAPE near our DSS event.

And the projections for 00z this evening show CAPE lowering further.

20z PHS Composite Reflectivity compared to MRMS Composite Reflectivity persistently highlights a lot of noise. Understanding from a forecaster’s perspective, this can be mentally filtered out, but at the same time, remains to be a distraction from the overall product’s use.

The warned cell over Glades county weakened and merged with other convection, and accordingly, the LightningCast probs declined. But we’re seeing new vigorous convection to the WSW just north of Bonita Springs.

One interesting note. There are new cells developing in far SW FL with lightning noted on GLM, however the cirrus canopy there is too thick to allow LightningCast to detect this convection.

– Edgar and Harvey Specter

Tags: None

Severe Cell in TFX CWA

At WFO Great Falls (TFX), we made use of the Octane speed and direction imagery, plus the IR brightness and day-cloud phase distinction to evaluate a cell northeast of Iliad. This imagery helped us screen the multiple cells over the CWA so we could home in on this particular cell. Characteristics that stood out included the higher anvil speeds on this cell, the diffluent cloud top signal on the Octane direction imagery; the cooler cloud tops (around -62C), and new/robust convection noted by DCPD.

4 Panel OCTANE depiction of severe warned storm near Iliad, MT.

Meanwhile, the cell closer to the Canadian border is becoming stronger. The ProbSevereV3 is trending higher for total severe, up to 19% at 2104Z. The anvil from the storm to the south is beginning to impinge on the cell to the north and somewhat obstruct the view.

The PHS imagery showed a regional peak in MUCAPE in this area.

Looking a bit later, the total ProbSevere continues to climb. It is well above the individual probabilities, which is curious.

Storms have matured with a notable V notch of cooler cloud tops and warmer tops to the north of the notch. Based on Octane speed, there is a notable difference in speeds from the southern end of the anvil to the northern reaches with 35-40 kts increasing to 65-70 kts. PSv3 does indicate a 50% chance for severe with this storm.

Meanwhile, down in CA, northeast of Sacramento, the Octane direction product is showing an impressive divergence signal!

–  Satellite Steve and Edgar

Tags: None

BRO PHS COMPdBZ comparison

Here is a comparison of the 15z  PHS Composite Forecast at 21z to the 21z MRMS Composite Reflectivity. Notice that the PHS has more widespread convection than what actually occurred. However, the PHS did forecast the translation really well (not shown here), which would aid forecasters in understanding where current convection is likely to travel.

21z MRMS Composite Reflectivity

15z PHS Composite Forecast for 21z

– Burton Guster, StormofCentury, Harvey Specter

Tags: None

PHS 0-3km SRH for WY/MT – 5/25/23

PHS 0-3km SRH for WY/MT – 5/25/23

Shear parameters are highlighted for the afternoon time period across Northern WY and far Southern MT (northwestern portions of the image domain). Radar observations later on indicated this product did well, with several cyclic supercells moving NE to ENE across far Northern WY, and entering into Southern MT at the writing of this post. This product demonstrated higher resolution, though similar placement of convective elements from the same product on the HRRR model.


PHS 0-3km SRH – 20Z – 5/25/23

PHS 0-3km SRH – 21Z – 5/25/23

PHS 0-3km SRH – 22Z – 5/25/23

PHS 0-3km SRH – 23Z – 5/25/23

– Rain-Free Bass Guitar

Tags: None

Growing Lightning Threat in Carter County, MT

Growing Lightning Threat in Carter County, MT

LightningCast probabilities steadily increase across Carter County, MT (Far SE MT) through the late afternoon. Perhaps the user could opt to select a more detailed range of probs by using the density radio button option in the product menu. At the moment only the 10/25/50/75% probs are available.

Probailities for lightning are steadily increasing over Carter County as convection forms along the cumulus field observed running SSW to NNE across the county. 

Surface-based CAPE from the PHS product indicate values increasing to 2,000+ J/KG across far SE MT.

– Rain-Free Bass Guitar

Tags: None

Evolution of LightningCast Over Southern Montana/DSS Event In Billings

Upper level flow shows continued SSW flow aloft over the region, thanks to deep troughing remaining over the West Coast. Overall forcing through the afternoon is on the weaker side of things, but models show an upper level jet streak nosing into the area. Scattered thunderstorm activity has already developed (below) to the south of Billings in northern WY, and is expected to expand in coverage through the afternoon. The DSS event is noted by the large yellow “B” over Billings.

The 14Z PHS forecast output (below) showed 19Z MUCAPE values across the area ranging roughly from 1000-2500 j/kg (with highest values in the eastern areas). Looking further into the mid-afternoon hours, outside of MUCAPE values creeping closer to 3000 j/kg in far NE portions of the CWA, the PHS overall didn’t show any notable changes in values. PHS values of 0-6km shear also matched up fairly well with SPC Mesoanalysis at 19Z, and had values increasing to around 35-40 kts through the afternoon.

Below is the 19Z MUCAPE via the SPC Mesoanalysis page.

LightningCast right around 19Z showed the 10% probability contour still about 40 miles SSW of Billings at its closest point (below).

LightningCast right around 20Z showed the 10% probability contour still about 30-35 miles W-SW of Billings at its closest point (below).

Around 2045Z, the 10% prob. contour reached the DSS event(below), but overall activity continues to be slow to push NNE. The LightningCast Time Series is included to show the trend up to this point.

Fast forward to roughly an hour later (~2140Z), there’s been a bit of a jump in the LightningCast Probability/TimeSeries (below), with the DSS event now sitting with a roughly 35% probability of lightning in the next hour.

A few minutes later, another jump up in probability – up to around 50%. Below is an image that has the GLM FED (colored pixels) included with the radar, LightningCast, and ENI Total Lighting Plot.

You likely have already been talking with the DSS contact point, but this jump up in the last ~10 mins may warrant another update, conveying that there is an increasing probability of lightning occurring in the next 60 mins.

Not surprisingly, the LightningCast probabilities have continued to increase, also shown in the time series. Image is from 2220Z.

What’s the best way to pass along this information to the DSS contact point?

With this type of event, where it’s slow to move in (driven more by the upper forcing vs the somewhat random quicker-developing activity that can occur in high CAPE/low shear  and other types of environments) and no significant changes in the overall environment across the area, perhaps you could wait until it’s closer to 50% or more  before expressing greater concern for the threat of lightning.  In those instances where activity may be quicker to develop/strengthen, it’s not out of the question that values closer to the 25% contour would warrant greater concern. No matter the overall environment, I do believe the addition of a shorter-term probability (lightning within 30 mins)  would be beneficial.

– Bubbles


Tags: None