Waiting For Convection To Go

While looking for thunderstorm initiation, my eyes are turned towards anything that informs me whether convection will develop further or decay. There have been several things to note while waiting for instability to move into the region.

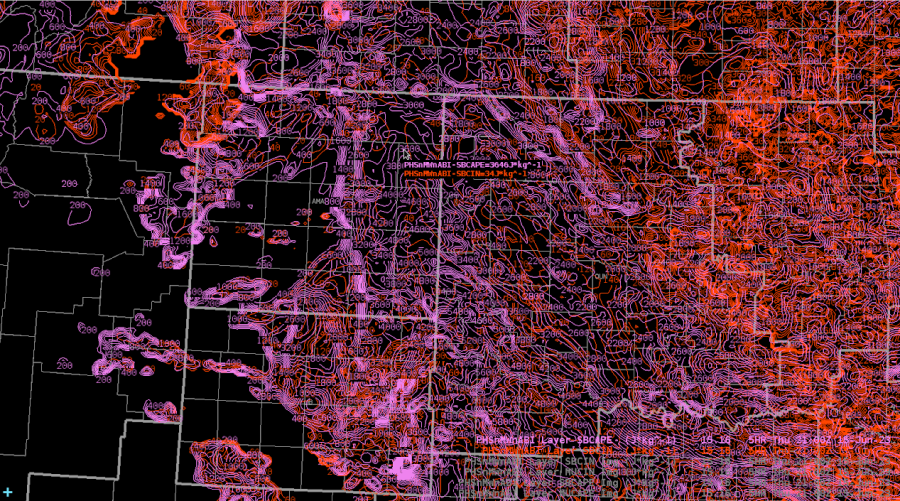
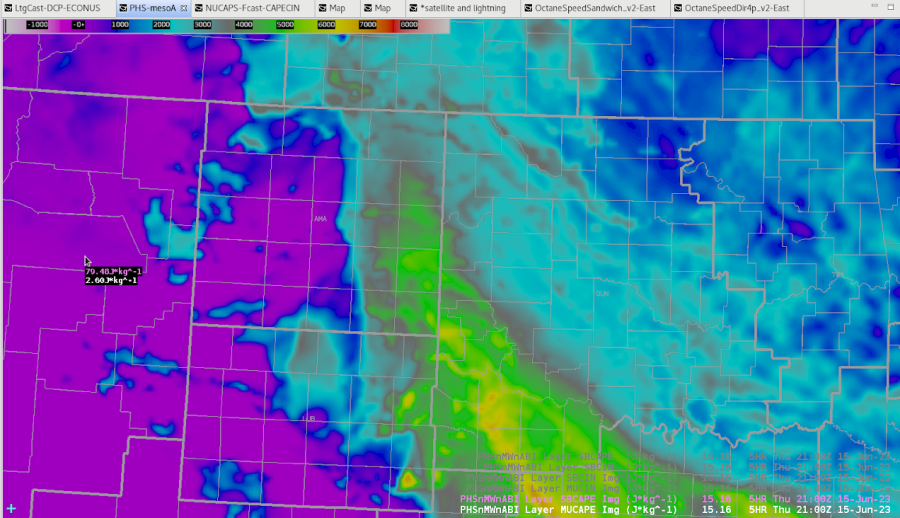
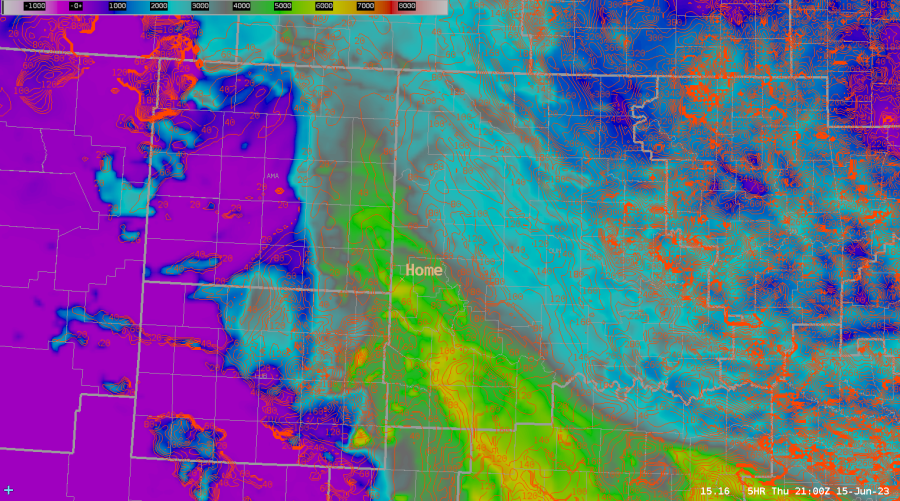
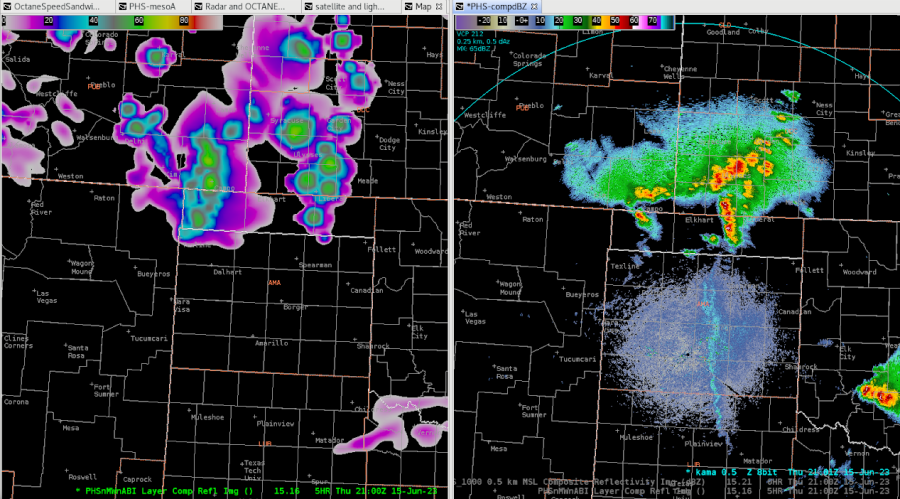
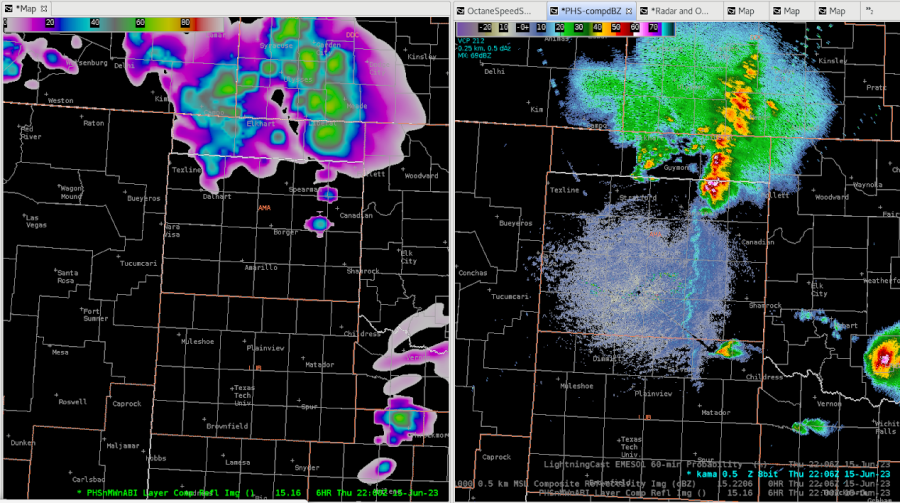
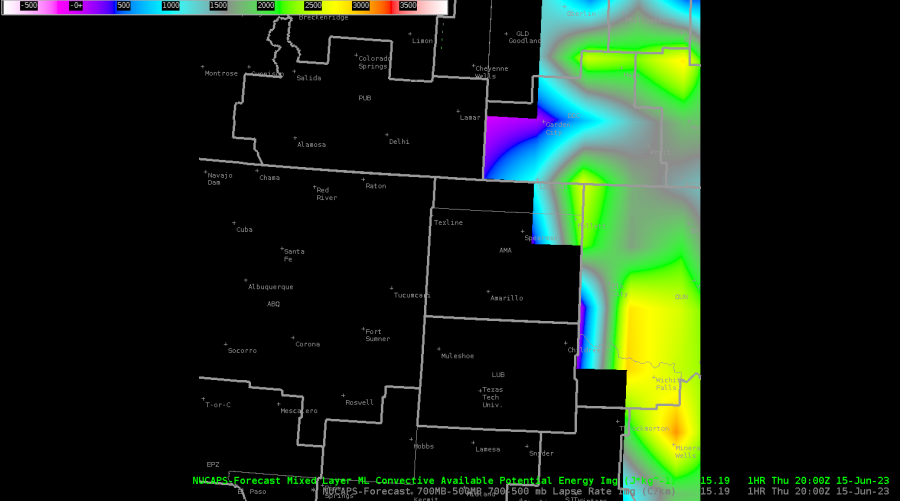
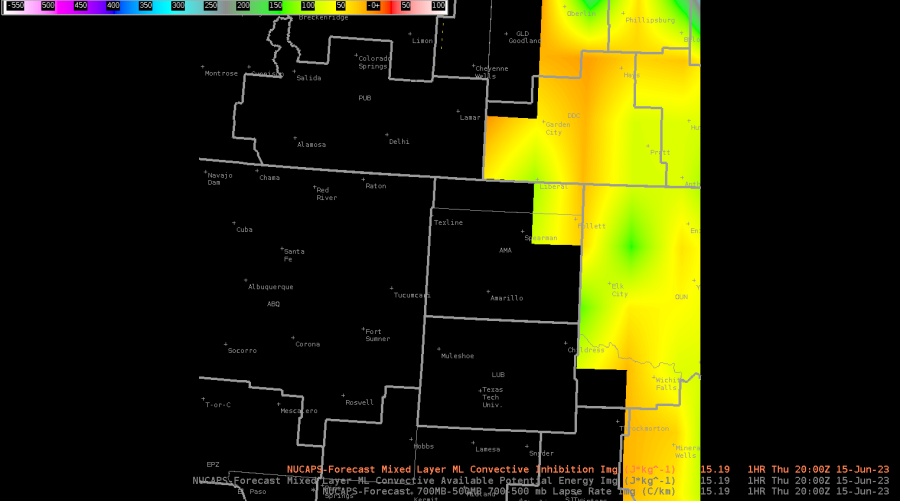
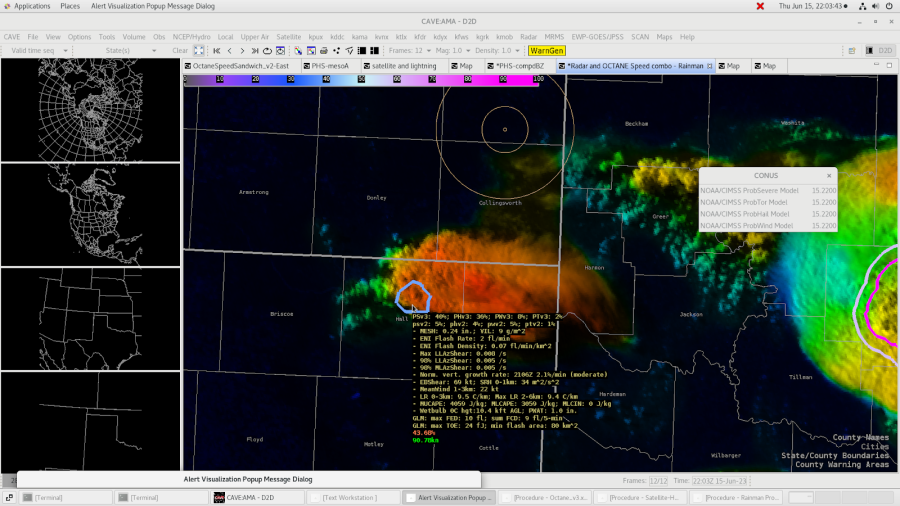
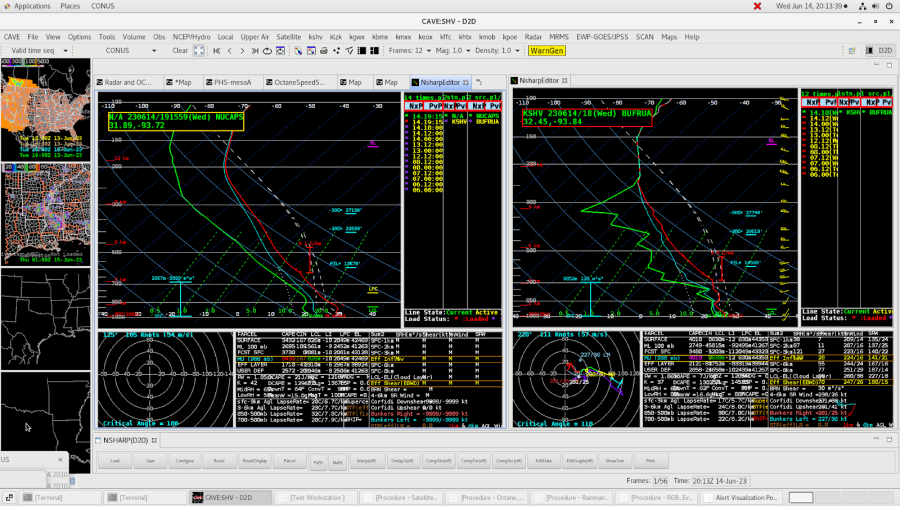
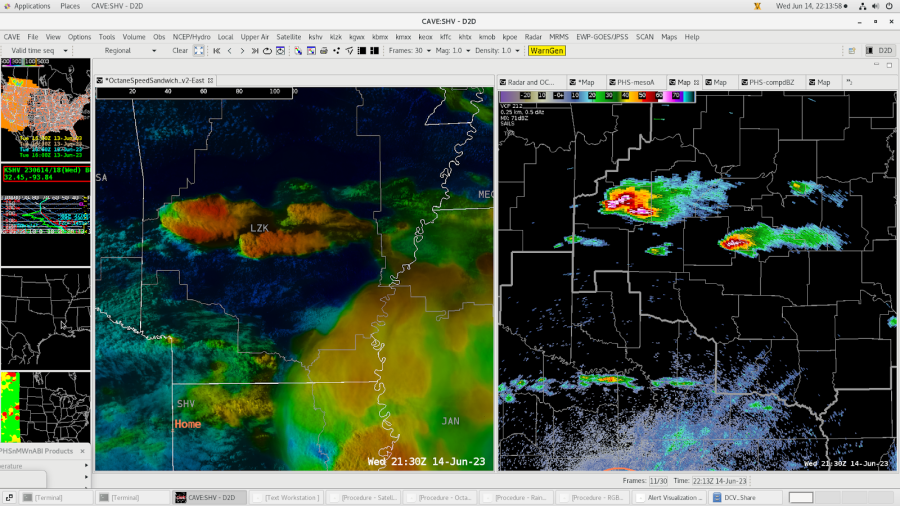
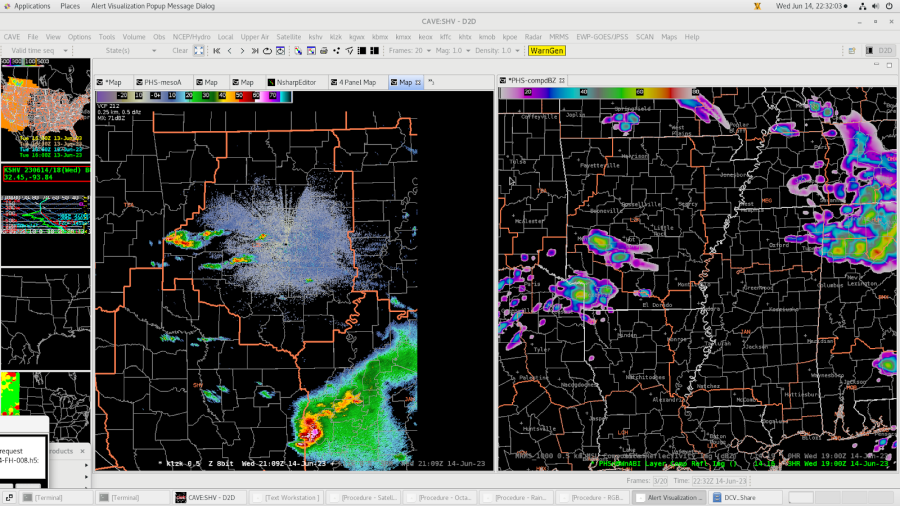
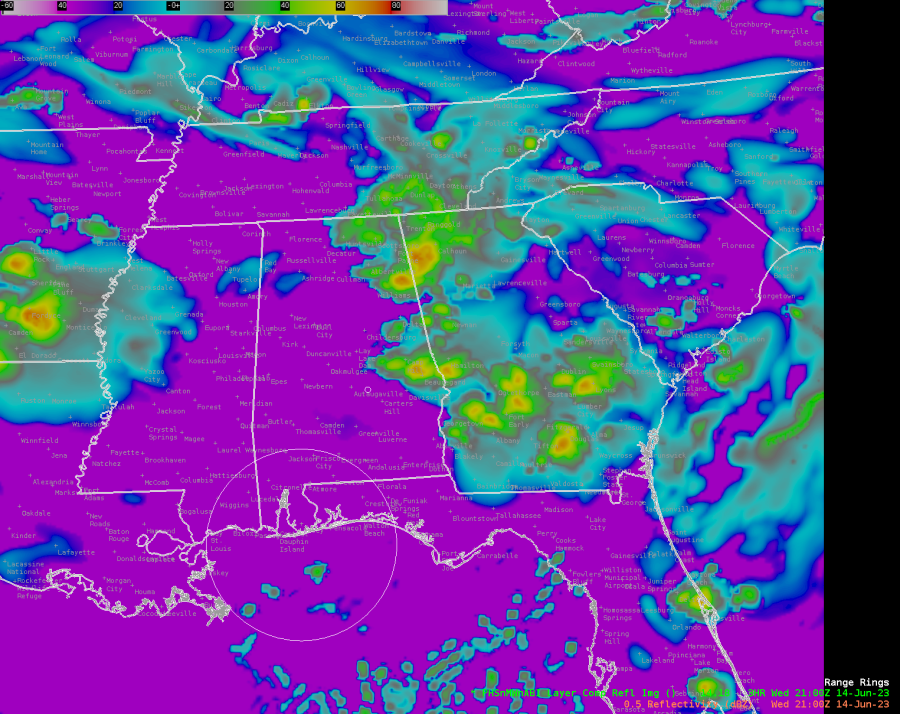
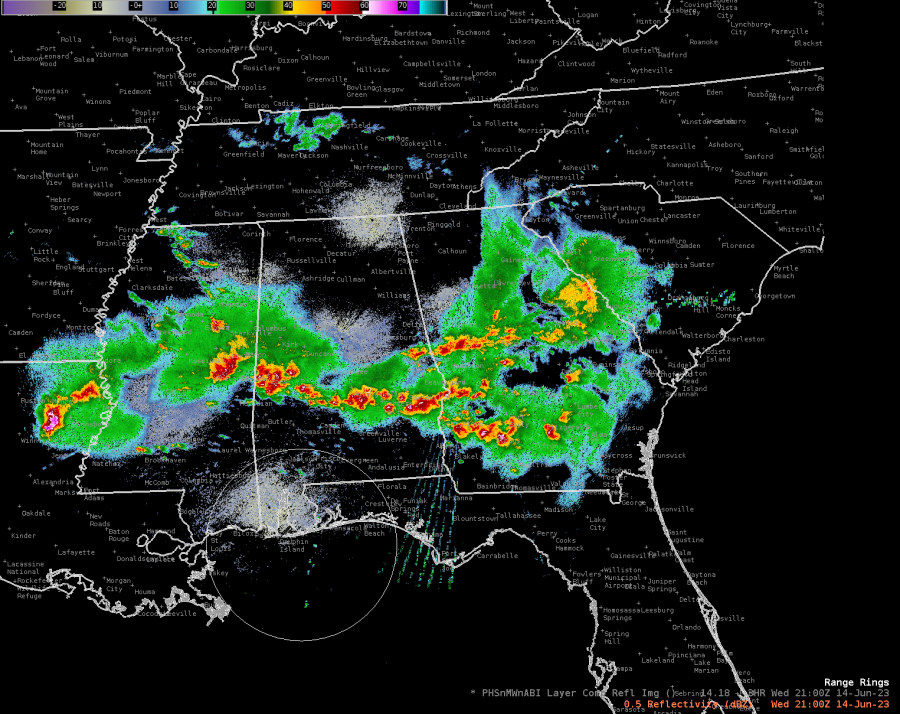
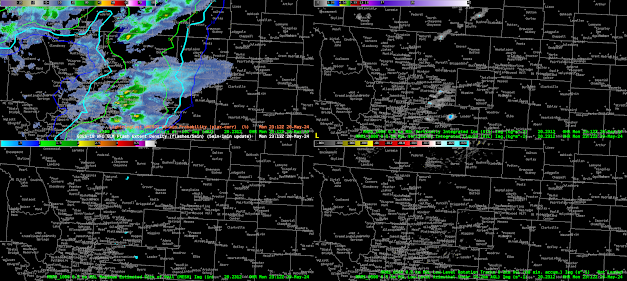
The main forecast challenge is the favorable ingredients to produce severe convection has to be advected into the region. The WRF with PHS data demonstrates that initial convection intensifies later in the day as better instability arrives across the region on the bottom right panel. This also corresponds with better dynamics noted across the others entering eastern Colorado. Model reflectivity on the bottom right increases as a result of better forcing over time. Until then, it’s monitoring at what point things actually start turning the corner and using the new tools available to find that point.


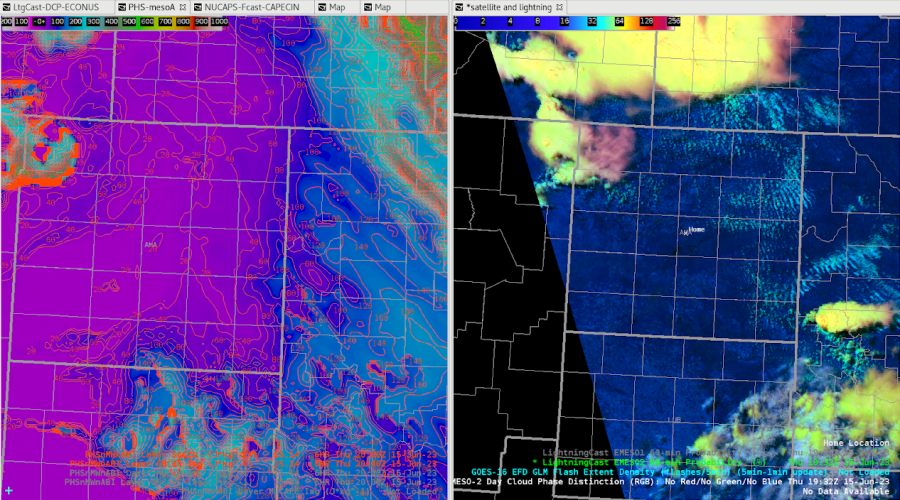
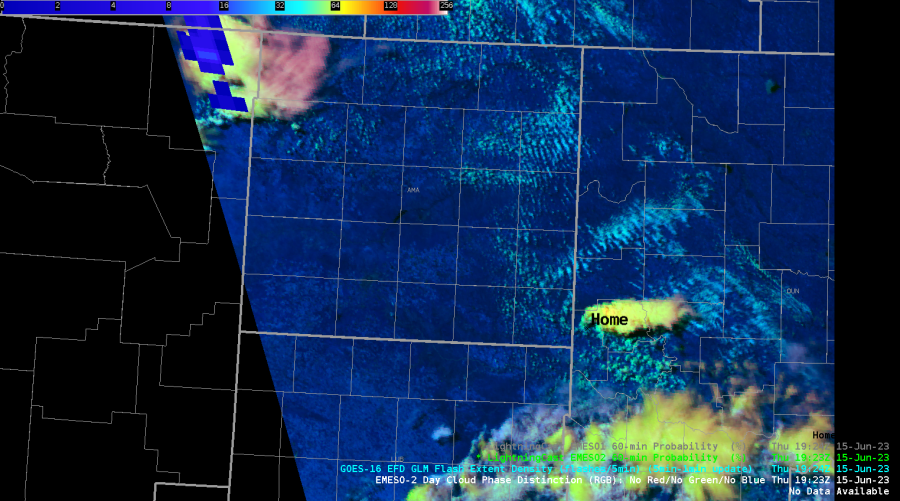
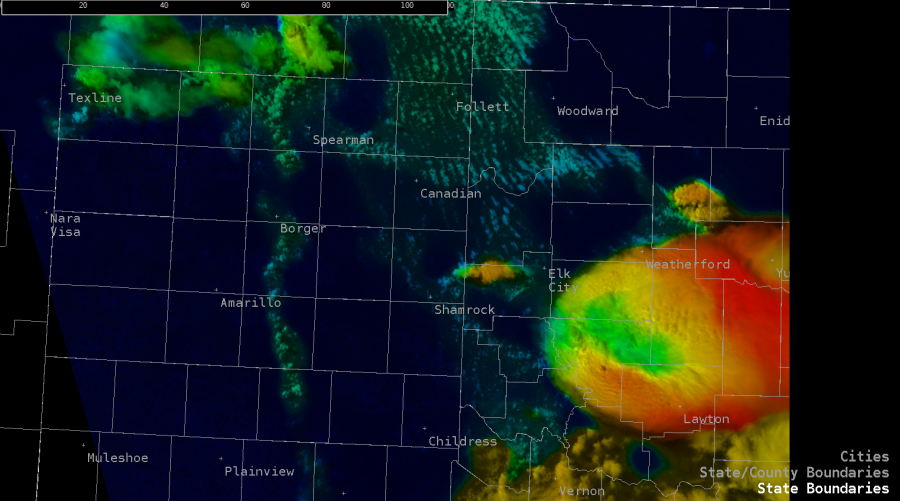
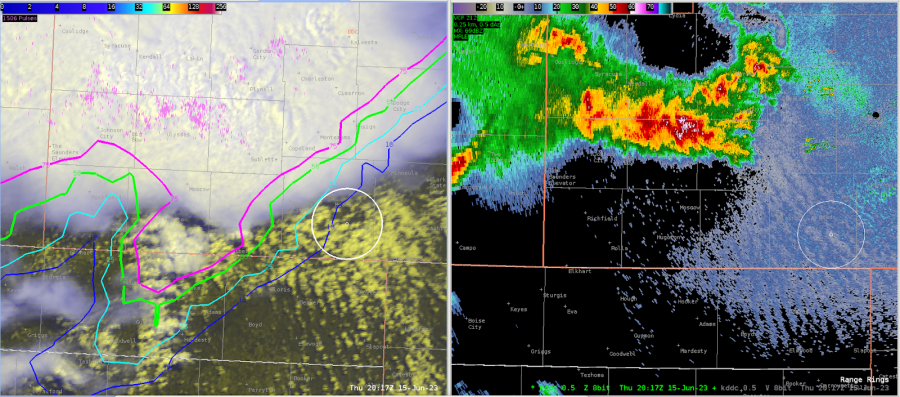
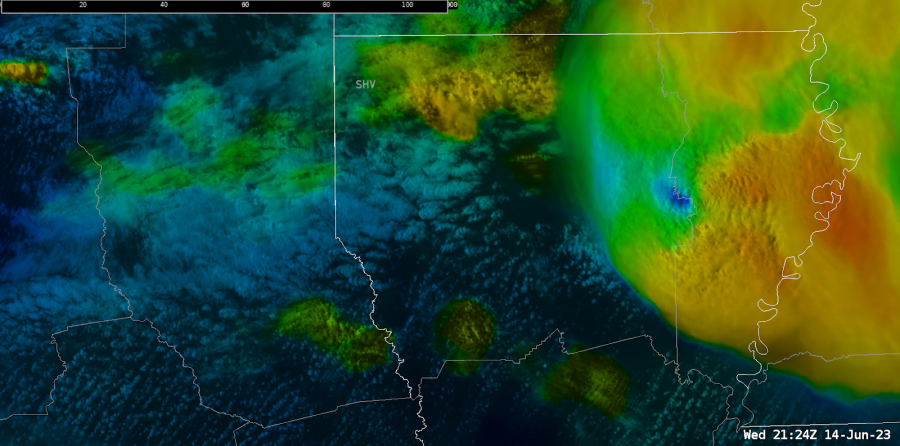
And so far, the things found have been what it’s not. So here are some things being observed in this period of waiting. At the beginning of the day, one of the things I noticed was related to the OCTANE detecting warming and cooling. As clouds moved off snowy foothills, it was apparent on the viewer where water clouds appeared warmer than the snow surface, and caused a pocket of cooling to appear on the eastern foothills once satellite could see the frozen snow, and warming whenever a cloud layer shifted overhead obscuring the snow. In the middle of convection, this would probably be irrelevant, but just a thing to note while we wait.


I like the idea of mashing together several products that we’re testing at once. So, I’ve applied the LightningCast, WRF with PHS CAPE, and GLM. The idea will be to monitor how the storm is pulsing compared to with what information is provided from PHS. It’ll also help track in what area LightningCast is lighting up and whether it is heading towards a favorable or unfavorable environment. With LightningCast aiming for detection within an hour, it began highlight a cell that corresponded with favorable instability. The combination of these two helped me hone in on this cell as being more likely to produce lightning than a similar LightningCast to the northwest. The 10% contour formed just before 20z, and steadily increased leading up to the first flashes on GLM roughly 30-40 minutes later. Nicely done!
While waiting, a small cell caught my eye. The area was almost completely clear, and showed very dark on visible imagery, to being cloud covered near Palmer. This made it appear this was about to blow up, but then you can see the OCTANE tool quickly reverse course once it becomes clear it will not develop and it begins to come down on visible.
Off to our west, there were a couple cells. Analyzing the tool on GREMLIN, the southern cell was less intense on GREMLIN compared to MRMS, and reversed for the storm to the north. However, neither are particularly intense, but it does indicate to keep a watchful eye and use other products like GLM to assess intensity.
As we move past 22Z and how the WRF with PHS data, it has done an excellent job forming the convection near the Denver Airport, but by Shamrock/Leader/Adena, that cell has not formed. This is creating a region of spurious data due to convective feedback. Some of the model appears to drive convection by the cold pool from this storm meeting instability advecting in from the east. It then focuses on this cell over the others, but this appears unlikely to verify at this point given how it is performing so far. By 00z, the 0-3km SRH bullseye creeps above 1600 m2/s2 moving towards Fremont. I won’t put the image of the new cycle that just came in, but the bullseye got more dramatic over 2000 m2/s2. Not sure if how much those magnitudes are in the realm of possibility.
One of the interesting behaviors lately has been a few storms forming in the cold pool as we approach 23Z. There has been convection developing on the western side of decaying cells. This has me thinking about how this would look for backbuilding precipitation. Would it have this look of the cool purples remain anchored in place while reds for new convection continuously appear to upstream that rides atop the areas of divergence? The signals may not appear robust, since there may not be fast storm motions.
Looking back at LightningCast, I have noted the known limitation of the forecast trying to bridge separate pieces of convection. The gap seems quite large though, and I wonder if there may be other means to QC the LightningCast with existing radar without making it slow to process. Or we can trust that the human eye is capable of noting that radar will confirm the lack of reflectivity at -10 C or higher.

That’s all I have today!

Kadic
Tags: None

Columbia SC: Trucks with Food

Protecting the Foodies

A Severe Thunderstorm watch that covered most of Columbia’s CWA was where we concentrated our forecasting efforts today. We found ourselves with no radar and were forced to make decisions on warnings with satellite only. As a result we made some modifications and combined the power of GREMLIN and OCTANE. Here’s what that love child looks like:


One of the issues we had in making decisions based on GREMLIN data was the lack of information it provided. GREMLIN provides a radar emulation and given that it’s a satellite based product it would be nice to see more information in the sample tool of what’s being shown. Values like temperature at highest reflectivity and echotops could be inferred by GREMLIN to help forecasters make better decisions if radar wasn’t available. The other issue we had with GREMLIN was the latency. Products were running anywhere from 15-20 minutes behind the rest of the satellite products that we were using.

A few minutes later we issued our first SVR warning for the eastern edge of CAE CWA for winds over 60MPH and nickle sized hail (sub severe).


As our storm moved out of the CWA we allowed the SVR to expire and took a look at the PHS Forecast model and compared it to the HRRR to prepare for the next round of thunderstorms. But both models seemed to agree that more TSRA was unlikely:


Storms in GSP came together and eventually created a good line of thunderstorms from GREMLIN’s point of view. GREMLIN was picking up some areas of higher DBZ and a lightning jump through the line was consistent with what we’d expect to see on radar for a SVR. A warning was issued on a line of storms:


The line started to fall apart as soon as it hit the CWA border. We allowed the warning to expire without feeling the need to re-issue downstream. After that, storms no loner had access to some of the peak daytime heating that allowed them to become sub-severe during the afternoon.
-Charmander
Tags: None

Using PHS to analyze an area of surface based convective potential

The potential for surface based convection will be important for the severe weather coverage in the CYS CWA this afternoon/evening. The 19Z PHS model is forecasting a northwesterly push of instability which is depicted above in the left panel moving into the far southwest counties of the CWA. To the north of that instability axis the PHS is depicting still elevated convection that is going on this afternoon. Additionally it is depicting surface based convection in northern Colorado, which may impact the moisture feed further north into the CYS CWA. I would highlight the far southeastern portion of the CYS CWA for a severe thunderstorm potential in my DSS/public messaging, with more uncertainty further north.

-Joaq
Tags: None

6/15/23 HWT – AMA

What appears to be a nice distinction between sheared / lesser sheared convection across the Octane window. Stronger shear across SW OK producing much different appearance versus SW KS convection.  Nice quick visual distinction for operational use. The idea of a quantifiable divergence contour and/or grid would be welcome also.

Octane data from Goes west meso sector was zoomed in along the inflow region across the SW OK supercell (not our CWA but I had to look). The upper right panel is the directional component and the color scale was changed to highlight approximately 210 – 150 degree range. The increasingly warm colors represent a backing of flow at approximately 4.5 kFt. This level of storm integration (if appropriate) would be advantageous to warning operations.

ProbSevere time series plots do not sample. I would like sampling tied to the cursor as in the parent CAVE window. The element assignment within ProbSevere did cause a problem with the time series information with a storm that strengthened on the southern end of a developing line. The storm initially had a defined area for the region of interest but once ProbSevere assigned it to the larger line the probabilities became much less representative. This impacted ProbTor values which were being monitored ahead of an eventual tornado warning in the Tx Panhandle. I was the warning forecaster today and used ProbSevere extensively for my decisions. It is not the deciding factor but it certainly weighs into the decision process.

PHS model output was interesting and the Updraft Wind element was noted as something not usually seen with model output. It was viewed initially but I didn’t monitor the model output once storms developed and warnings were being issued.

NUCAPS forecasts were unavailable until the very end of the operational window. I did view the 19z overpass soundings and found the familiar  trends of errors at the boundary layer when compared to nearby surface observations. This limitation continues to impact my confidence in the product.

– jbm

Tags: None

6/15 HWT OUN SuperCell

A very intense supercell formed across western portions of OUN CWA. This cell underwent many transformations including splitting and merging at other times. Octane was very interesting to watch as this cell went through the various processes before eventually producing a tornado. Octane was able to show the storm splitting before it occurred on radar.  PHS was also showing corridors of stronger 0-3 and 0-1 SRH; SPC Mesoanalysis was showing this as well but I did like how the PHS was able to highlight exactly where these occurred. Seeing that and a near stationary boundary did increase my confidence that if a storm was able to latch on it would become tornadic. Probsevere/MESH did struggle to catch on to how large the hail actually was initially before finally picking up on the hail size.

4 Panel with Octane on the top row; appears to be two distinct divergence signatures occurring

Radar Loop of storm splitting shortly after Octane signature…. Notice how the left mover dissipates.

Using the 4 panel with Octane, IR and Day Cloud Phase it was also beneficial to see the upper divergence signature on Octane correlate with the cooling cloud tops of IR and Day Cloud Phase. Although it didn’t seem to create any additional lead time with that aspect; at least that I was able to notice. It was overall a very interesting storm to watch for this experiment.

4 Panel Intensification of storm.  Note the rapid color gradient to blue (upper level divergence)on Octane towards the end of the loop.

Radar loop around the same time as the 4 panel above   

– Tor Nader

Tags: None

6/15 Feedback for AMA

PHS

The surface based CINH at 20z lined up rather well with the satellite imagery showing the slightly more stable clouds over the eastern CWA.

When sampling an image versus contours, the contour sampling has the entire product name in the readout

PHS captured the initial convection just east of AMA well, even though the convection started an hour earlier than PHS indicated.  Image on right is PHS SB CAPE and contours are PHS SB CINH.  Home is roughly where the storm is located.  Satellite image is around 1930z and PHS forecast is 21z when CINH dropped from 80j/kg to 40 j/kg.

PHS did a reasonable job predicting the general storm coverage by 21z from the 16z run.

Toward the end of the exercise, the storm coverage was well captured by the PHS 16z run.  Should have taken this into account for my public graphics when describing the storm evolution.

NUCAPS

This is a NUCAPS sounding in the TX panhandle near AMA vs. a RAP40 sounding at the same point.  The RAP has the same trend in the dew point profile as NUCAPS, but is lower.

Noticed the NUCAPS sounding didn’t have the lower dew points around 400 mb as shown in the special sounding.  NUCAPS did have a hint of the weak cap near the surface though.

NUCAPS 700-500mb lapse rates from the gridded data was a constant 34.17 C/KM across the map.

NUCAPS forecast for ML CAPE was slightly less than what SPC mesoanalysis had at the same time of 20z.

NUCAPS ML CINH was higher than SPC Mesanalysis for 20z, with some parts of the CWA having almost 90j/kg of CINH south of Liberal, KS.

The 700-500mb lapse rates matched well with SPC meosanalysis for 20z.

OCTANE

OCTANE showed the cumulus developing along the dry line and warm front well.  Can also distinguish which clouds are becoming taller.

OCTANE highlighted where convection was taller, and Lightning Cast started to show probabilities for those same updrafts.

ProbHail

Noticed what could be an above anvil cirrus plume with the storm in question.  Prob Hail only had a 35% chance for severe hail at the time.

Prob Tor

Noticed the Prob Tor jumped up depending on what cells it was encompassing.  Took three screen shots to denote the trend.  Seemed reasonable for it to increase since the end cell was ingesting the dry line at the time the probabilities increased.

-Rainman

Tags: None

Day 4 Review of Products & Operational Applications

Today, I took on the role of mesoanalyst during operations. I first looked at PHS fields (mainly MUCAPE and bulk shear) and compared them to the SPC mesoanalysis of said fields. The two agreed well, though I do have a suggestion – PHS bulk shear fields are given in m/s, but knots or mph would be better for quick comparison to SPC mesoanalysis and most model output.

I then looked at OCTANE imagery and immediately took note of the divergence signature associated with an especially robust storm over western DDC (Figure 1). This signature was easy to identify as the environmental winds aloft were relatively light.

Figure 1

As the operational period wore on, LightningCast indicated a high likelihood of convection over the southwest portion of DDC well before any radar returns actually appeared (Figure 2). My group used this information to create a DSS graphic that highlighted this area for likely storm development later (which did in fact end up happening).

Figure 2

OCTANE Direction later captured what at first glance appeared to be a couple divergence signatures over southwestern DDC (Figure 3). Upon closer inspection, however, these signatures were co-located with relative minima in OCTANE Speed. The proximity of these signatures to areas of missing pixels (where winds are likely <5 kts) in OCTANE Direction suggests very light winds and/or lower quality data, per the developer.

Figure 3

– Vort Max

Tags: None

PHS and SPC Mesoanalysis, 0-6km Shear

I noticed that there was a big difference in 0-6km bulk shear values between the PHS MesoA and SPC Meso page. The gradient was similar but not the values. Highest values from the PHS MesoA was in the mid 30s. Highest values on SPC’s page was in the 60s at around 20z.

– SATGLM_84

Tags: None

SHV Feedback for 6/14 and some feedback from LZK CWA

NUCAPS

Noticed the SHV special sounding was very similar to the NUCAPS sounding done an hour later.  NUCAPS on the left and SHV on the right.  The surface and near surface environment did not match as well.

OCTANE

Neat to see OCTANE highlight the taller clouds that are developing behind the main storm activity over the western CWA.  Lightning Cast started highlighting this area too for a lightning threat.

Very nice divergent signature on the updraft.  However, the 80 kts of divergence seems underdone given the MESH of 1.51”.  I know the speeds are dependent on the environmental winds, but just seemed odd given the hail potential.  Calibration would be helpful to help determine the hail size potential based on updraft divergence.

OCTANE captured two updrafts from a splitting storm over LZK’s CWA.  This helped to see the potential split earlier than when viewable on Radar.

Here is when OCTANE first denoted the split vs. what radar had at the same time.

PHS

Handled the storm location and timing rather well at the start of the exercise for SHV.

Noticed for the LZK CWA PHS was about 2-3 hours early with the storm activity, but had the location correct.  Radar image at 21z, PHS image at 19z

– Rainman

Tags: None

BMX Severe Thunderstorms

Overall, I used OCTANE, PHS, ProbSevere 3 and LtgCast today. NUCAPS wasn’t really accessible. Worked the DSS event, an Air Show, which was canceled due to severe thunderstorms all afternoon producing tornadoes, large hail and damaging winds. DSS for this event would have been done days ago.

Below is a shot of LtgCast on a radar background and ELN measured lightning, the +/- are positive and negative ground strokes, and the cyan dots are in-cloud. It is interesting how the 75% probs lead out into southwestern Georgia though the showers there are more stratified and lightning isn’t expected, yet it gave about 45 minute notice of lightning strikes; that’s a good thing. But how useful is this? It predicted a few single lightning strikes tens of miles apart scattered across 100 miles which isn’t really useful; would you stop all outdoor activities across ¼ of Georgia for a few stray strikes? Would you clear the baseball field because a lightning strike will hit in the next hour somewhere within 50 miles? Not likely, but knowing there is some chance is valuable information for an event coordinator for risk analysis. If they can make minor changes to activities with little or no impacts, it helps, especially if it’s an area where lightning isn’t expected. What would be a big plus would be an estimate of flash density/frequency expected to go with the probs. That gets back to tracking the convective cells to predict areas of dense lightning. We have radar and ELN’s for that.

PHS composite reflectivity vs radar at 21Z… I find little value in the PHS composite reflectivity product. Below you see PHS composite reflectivity compared to the radar returns at 21Z. It’s not doing too well and I haven’t seen a time when it has done well predicting where the storms will be. The HRRR, NSSL WARF, HRef, NAM Nest and other high res models do much better.

PHS Bulk Shear 0-1 km below on the left and 0-3 km below on the right both show a line between areas of lower and higher shear along the boundary where the severe storms were tracking, but this occurred after the convection started. I don’t see a pre convection signal pointing to where the training storms formed.

The Bulk Shear 0-6 km below shows more promise with the 19Z  frame showing a boundary where the training severe storms formed/tracked (what did it look like at 16Z or 17Z?). I would need to see more of this pre convection to really make a judgment, and would need to see positive validation/verification to have any confidence in it as a tool.

– Super Bolt

Tags: None