Utilizing AzShear and Velocity

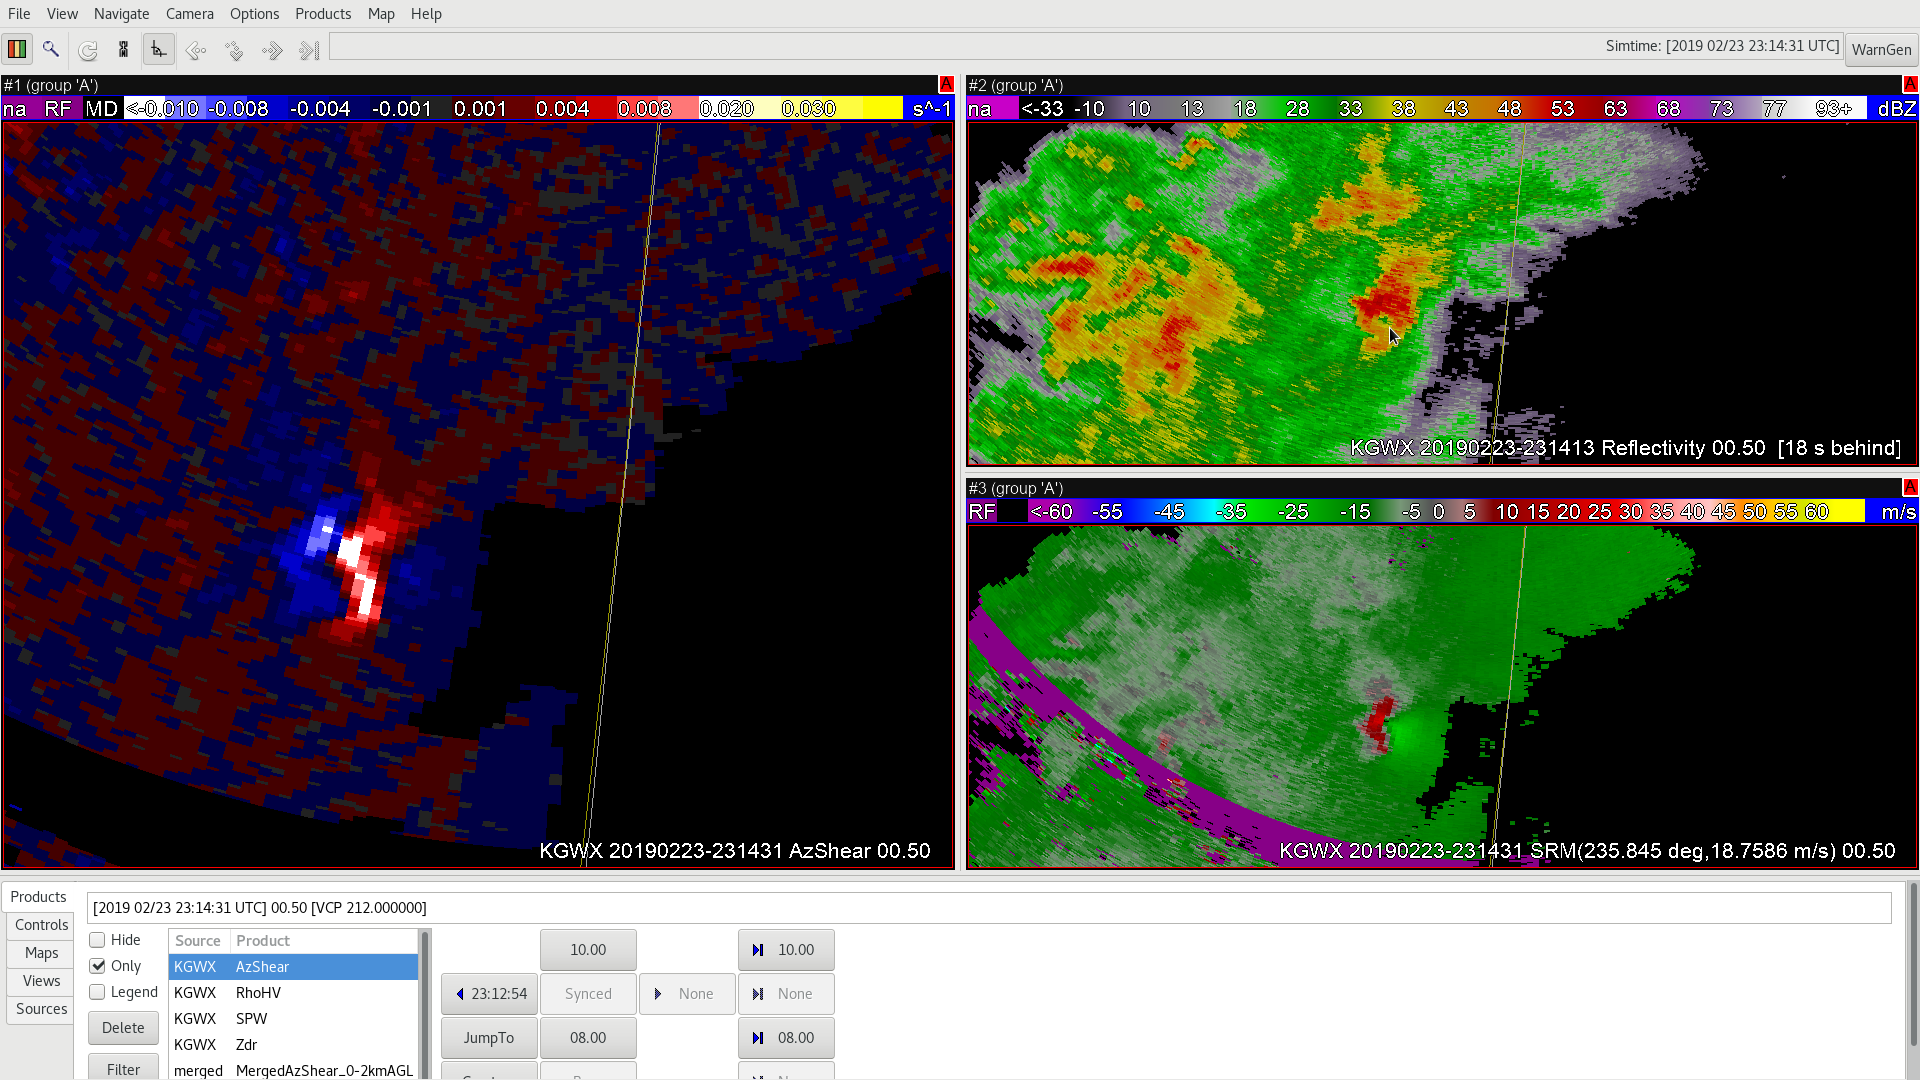
We’re comparing AzShear to velocity, SRM, and reflectivity data. I started off focusing on the cell with the longest touchdown near the Mississippi Alabama border. If I was forecasting this event real time the AzShear would help to increase my confidence in length of the period the tornado was on the ground. That’s due to the comparison between the AzShear and SRM.

The rotation signature on the SRM alone appears to weaken as the cell gets closer to Alabama.

Meanwhile, the AzShear holds onto a stronger signature longer aligning more with the actual touchdown. In that case it’s more helpful. 

The only difficulty for me is reprogramming my brain to not look at AzShear the same way I look at velocity. I’m accustomed to finding the couplet, and it’s tempting to do the same with the AzShear product.

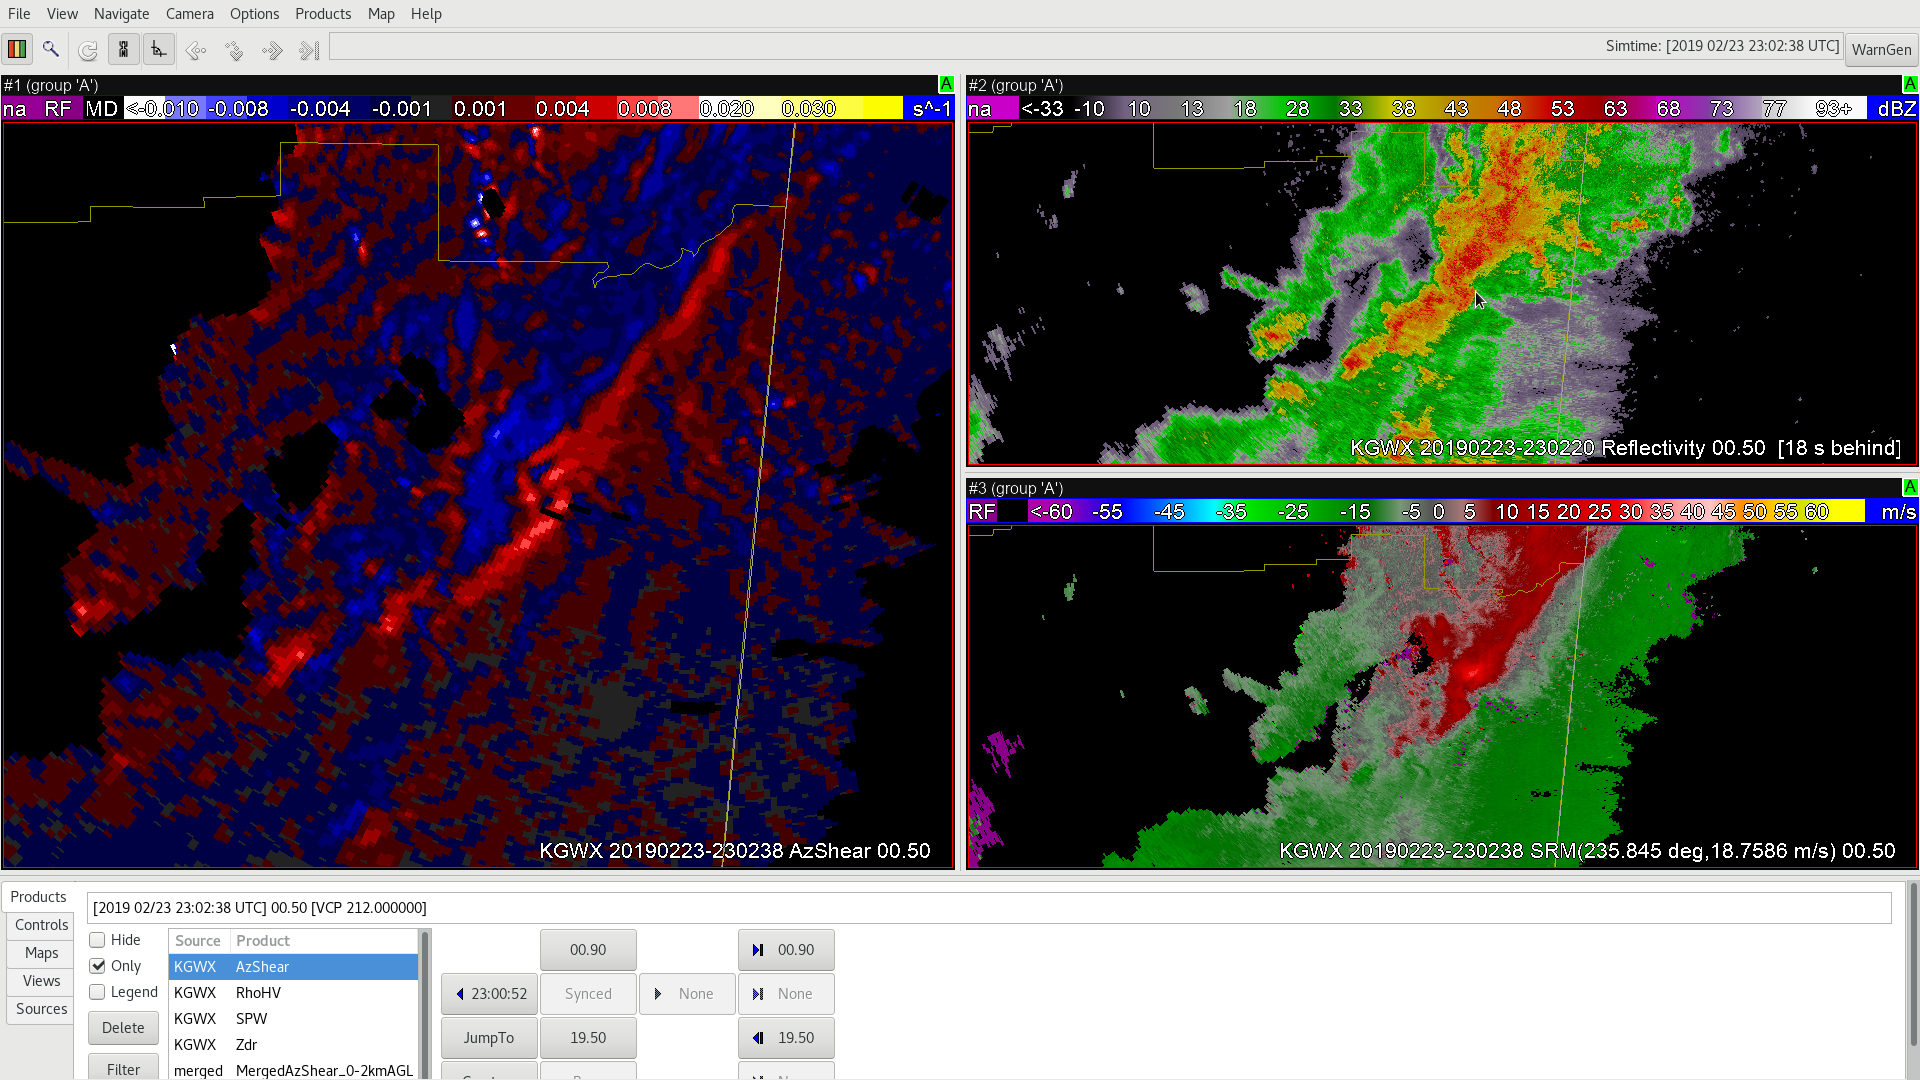
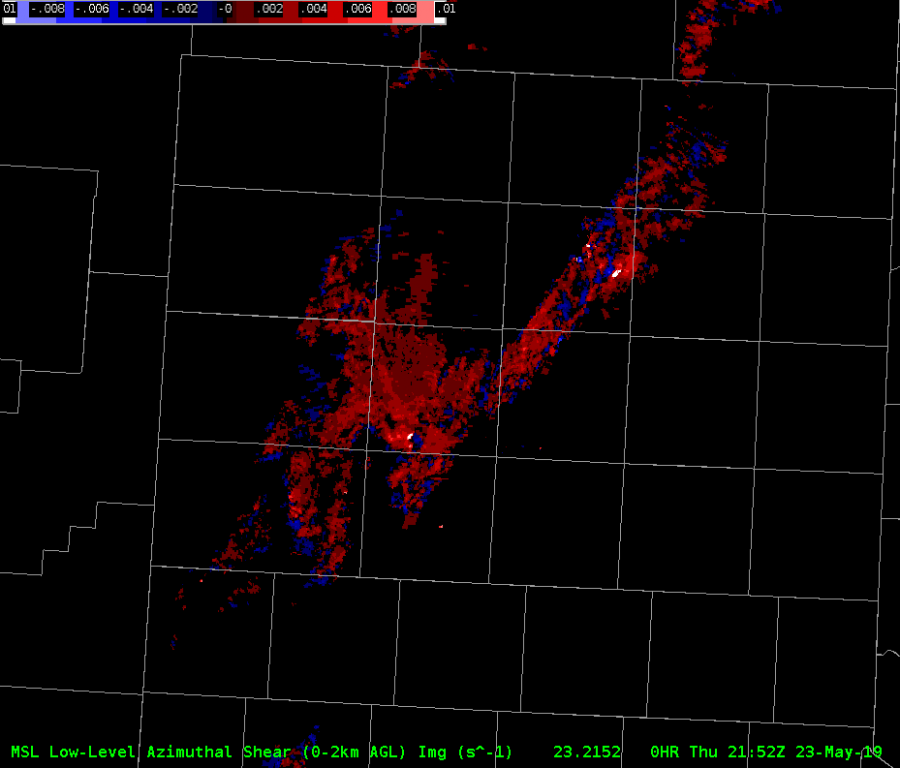
AzShear was also helpful in analyzing the southernmost cell that was also showing rotation. Since it was farther from the radar site my confidence in a possible tornado was increased due to the max in the AzShear.

It stands out more in comparison to the velocity data. The cell doesn’t have your typical look of a supercell so reflectivity wasn’t as helpful.


Taylor Johnson


Tags: None

Gate to gate!

Right in the middle of the reflectivity curl is a gate to gate circulation…also a peak in AzShear.

TDS showed up too.

Charley

Tags: None

Bounded Weak Echo Region

Southern discrete cell has a BWER on the 0.5 degree tilt. AzShear way up to 0.018…cannot believe a stronger/longer-tracked tornado wasn’t found with this cell.

Tags: None

QLCS with front end nub

Front end nub showing on QLCS…with 700 mb winds from the southwest…that part of the line is going perpendicular to the 0-3 km shear (~45 knots).  AzShear has persistently shown a high value for that part of this track as well (.009).

Charley

Tags: None

All Three Meso Detection Algorithms Struggle to ID Lone Supercell

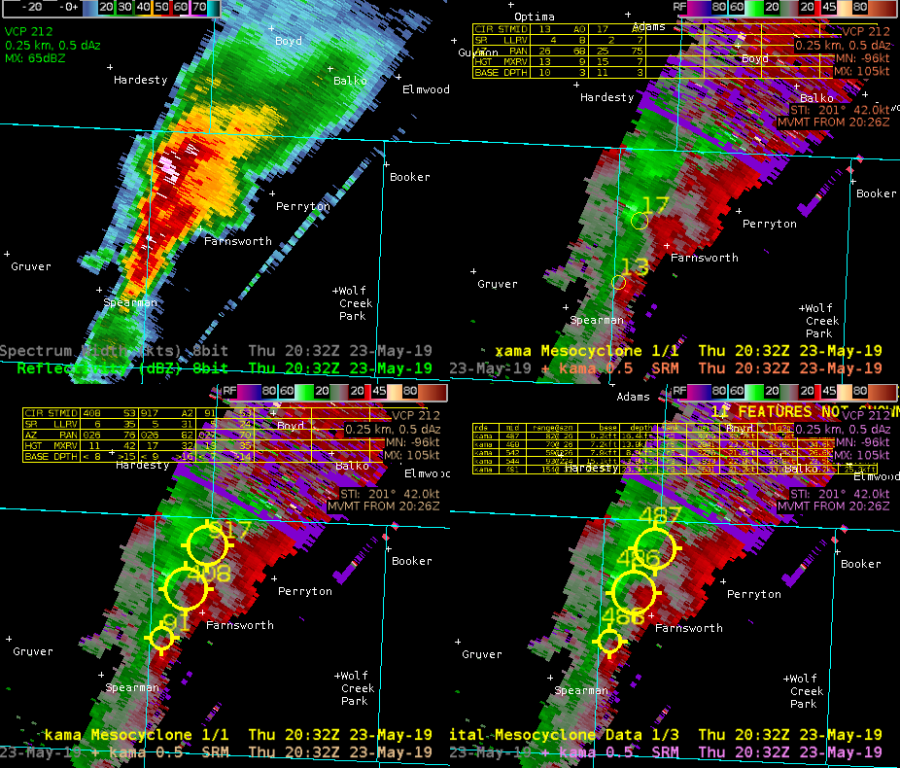
CPTI upper left, New MDA upper right, legacy MDA lower right, digital MD lower left.

A discrete supercell tracked out of the Oklahoma Panhandle into southwest Kansas from 2120Z to 2220Z on 5/23/19.  During the first portion of this loop, the mesocyclone detection algorithms had a very difficult time latching on to one dominant meso, plotting up to four separate IDs for the same storm.  Eventually, both the legacy and new meso algorithms resolved one primary circulation, while the digital version continued to jump around a bit with the ID number and location.  For the last 15 min. of this animation, the MDA data completely dropped out.  The main point here is it was nearly impossible to utilize this product operationally because of the meso identification and data dropout issues.  It’s worth a mention that the legacy and new MDAs had about a 15-20 min. window of good meso tracking after the consolidation to one ID and before the data was lost. -Roy

Mid-Level Mesos

The merged AzShear product has done a solid job keeping up with low & mid level rotation tracks so far this afternoon in the Texas panhandle. Most of the storms over the last hour have exhibited weak low level rotation but much stronger mid level rotation. The merged AzShear product showcases it well with much hotter values on the mid-level product compared to low level. This also matches well with the threats observed so far with several reports of large hail, but any tornado threat has yet to materialize.

Dave Grohl

Comparing NUCAPS Modified Soundings and 18Z RAOBs

A satellite pass at around 19Z allowed us to compare NUCAPS modified soundings with 18Z RAOBs. A comparison of a NUCAPS sounding near Amarillo seemed to reasonably represent the mid and upper levels with the 18Z KAMA RAOB. The NUCAPS sounding had slightly lower freezing level and -20C and -30C heights compared with the RAOB (10.9, 19.0, and 23.2 kft vs 12.2, 20.8, and 25.4 kft, respectively). The midlevel lapse rates were comparable at around 8.0 C/km. However, the NUCAPS sounding appeared to struggle with the lower levels, not representing the subsidence inversion evident on the RAOB, and being too cool and dry at the surface (T/Td of 20/17C on the NUCAPS compared with 24/19C on the RAOB). This led to lower CAPE estimates from the NUCAPS than were observed by the RAOB.

Similar results were seen in a comparison of the 18z KLMN RAOB with a NUCAPS Modified sounding near Lamont, OK:

Ron Dayne

Significant Difference Between Operational and New MDA

Thursday afternoon convection continues to cook in the northern Texas panhandle. Several mesocyclones were detected by the different algorithms along a broad, down radial shear zone. The values from the operational MDA (bottom left) and digital (bottom right) were very high, topping out at 24+ LLRV for all three mesos detected at the lowest scan. That is much higher than values seen for some tornadic supercells earlier in the week, and does not match the velocity data with no strong, tight couplets evident. The new MDA is much more restrained and actually has the strongest RV values above the lowest scan, which matches up with the velocity data much better as the values should be lower with broad, weaker areas of rotation.

Dave Grohl

Comparing the modified and unmodified NUCAPS sounding from Western Oklahoma on May 23

While waiting for any convection to develop in PA, I ventured into western Oklahoma to do a comparison of unmodified and modified NUCAPS soundings in an area under an enhacned risk of severe weather. The soundings examined were near the Texas border (point E below).

We’ll first look at the visible satellite and observations at 19Z.

Notice that point E is near a WSW/ENE oriented boundary. Obs near the point show temperatures in the mid 70s, with dew points in the mid 60s. So let’s take a look at the unmodified NUCAPS sounding first.

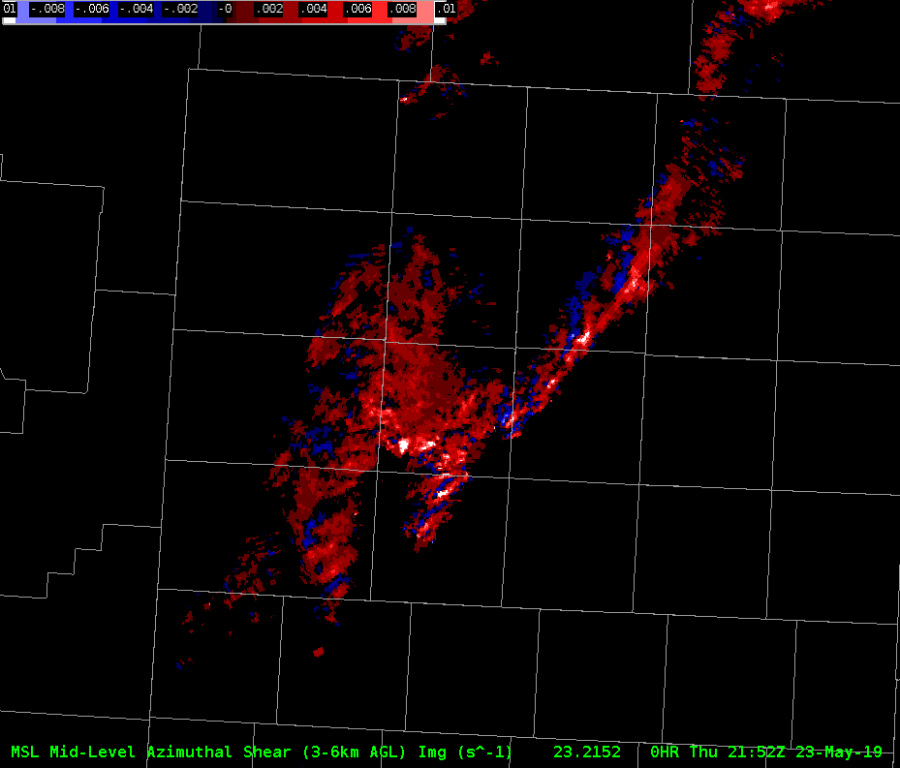
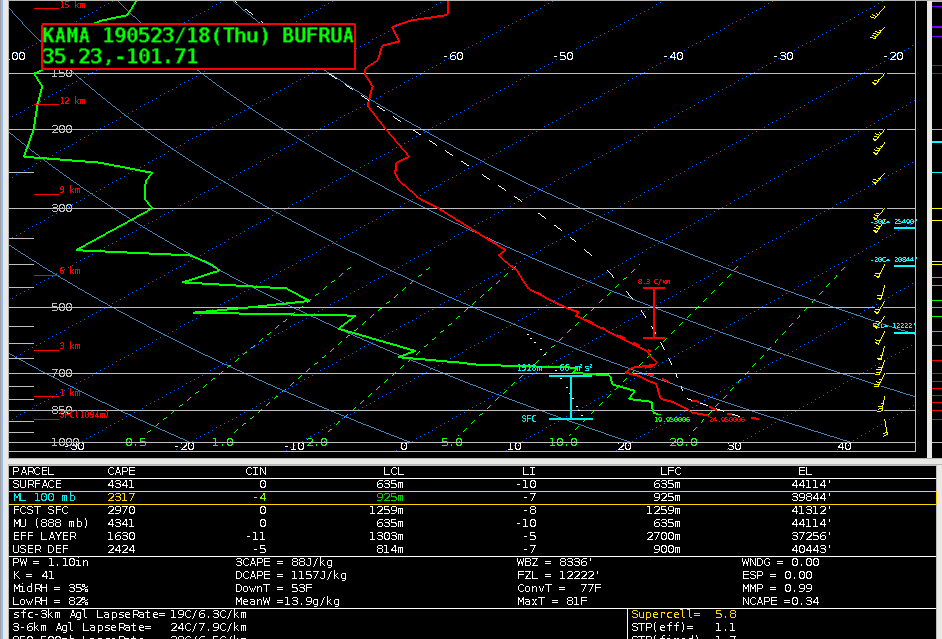
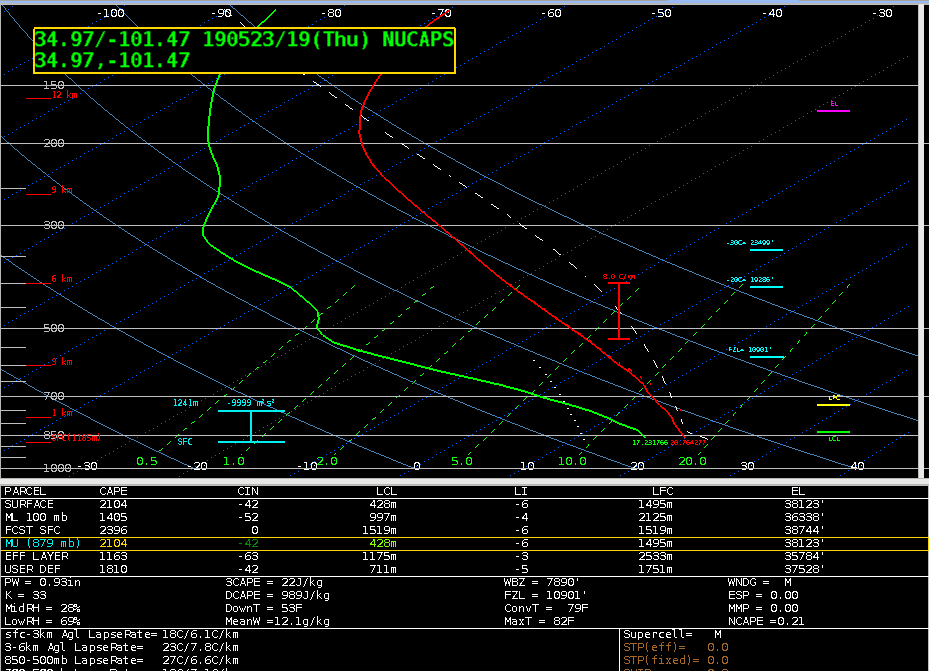
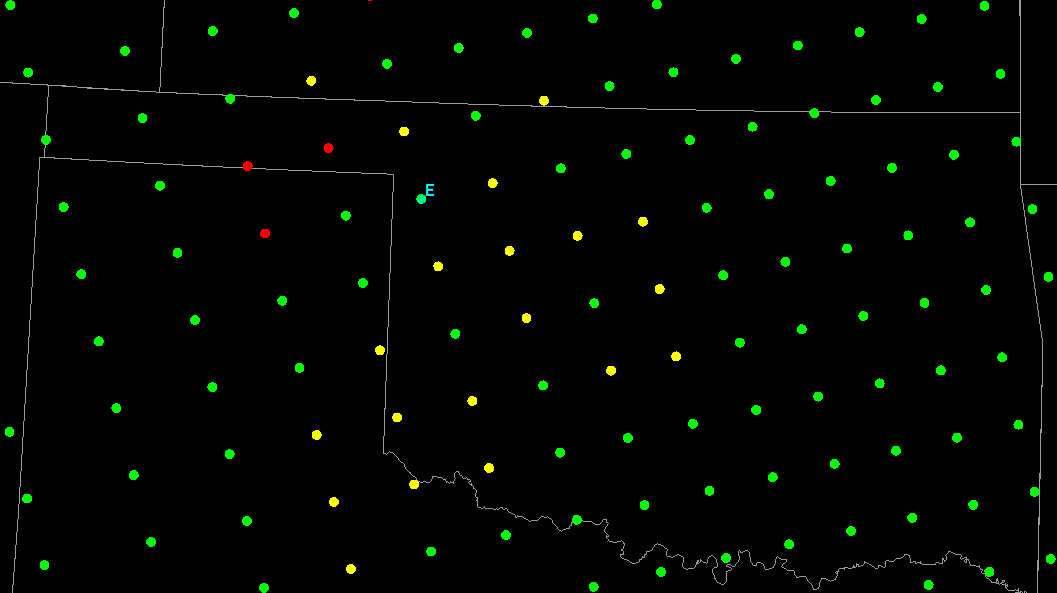
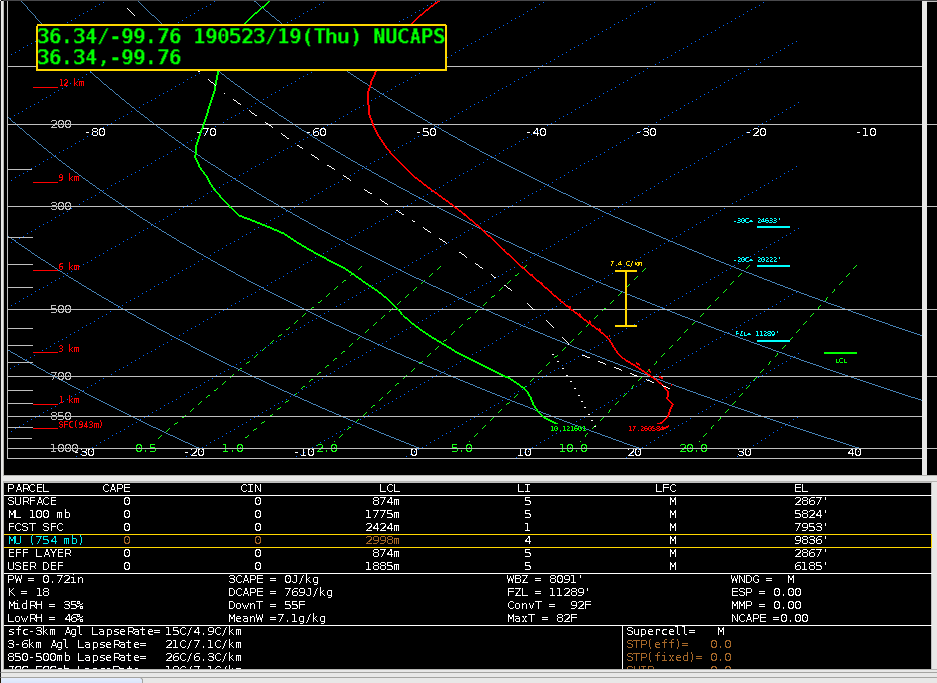
It uses a surface temperature of 63F, and a surface dew point of 50F, both more than 10 degrees below the nearby observations. These inaccurately low values give, as one would expect, no sign of instability (CAPE=0). Looking at the modified NUCAPS gives a different picture, however.

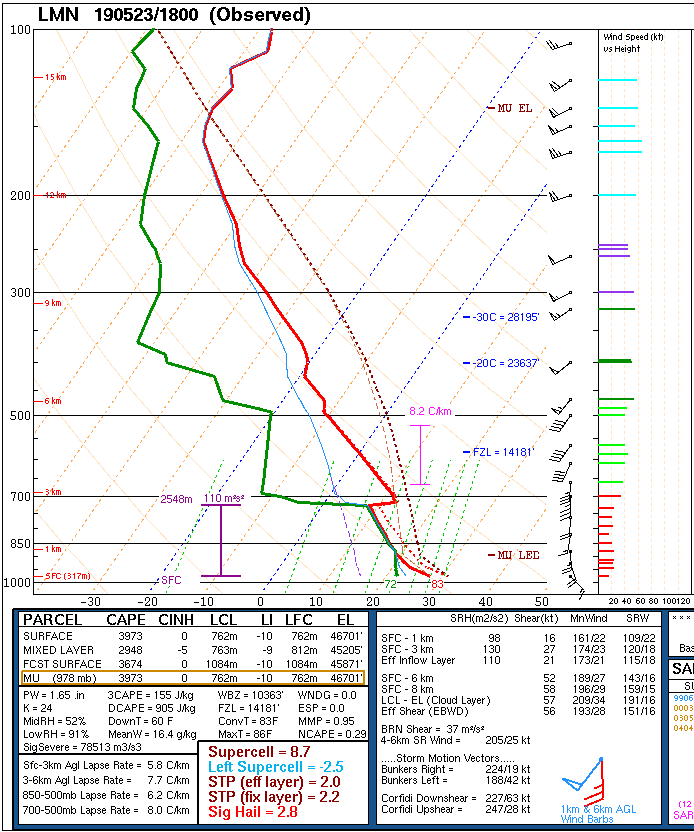
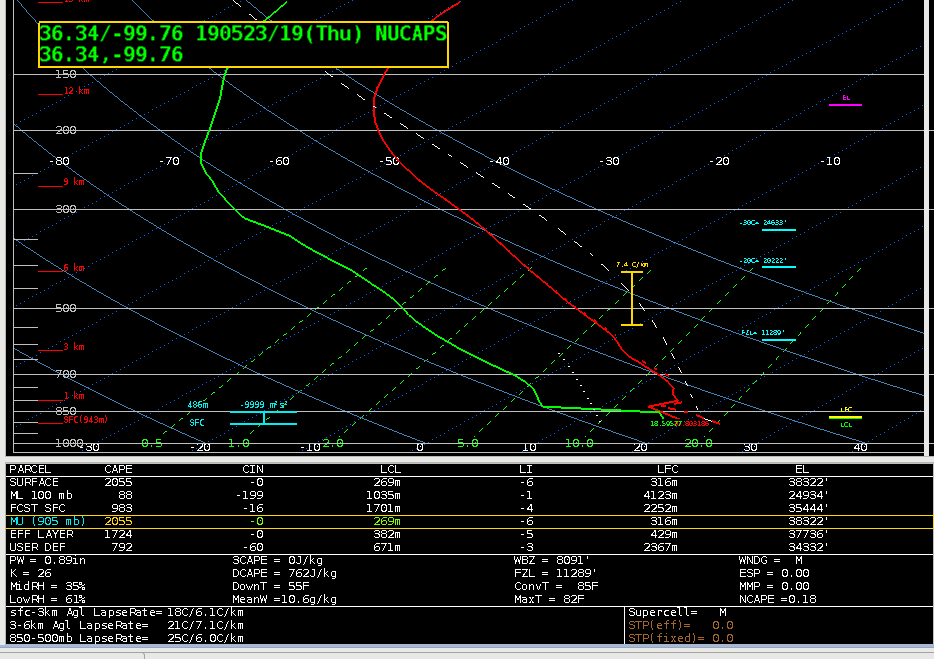
In the modified sounding, the surface temp is 69, and the dew point is 65, which is much closer to the observed surface obs. This changes your surface-based CAPE to 2055 J/kg, vs. 0 from the unmodified. It also has a sharper low level inversion, which one wood expect based on the stratus deck in place.

To “verify”, let’s look at the SPC mesoanalysis.

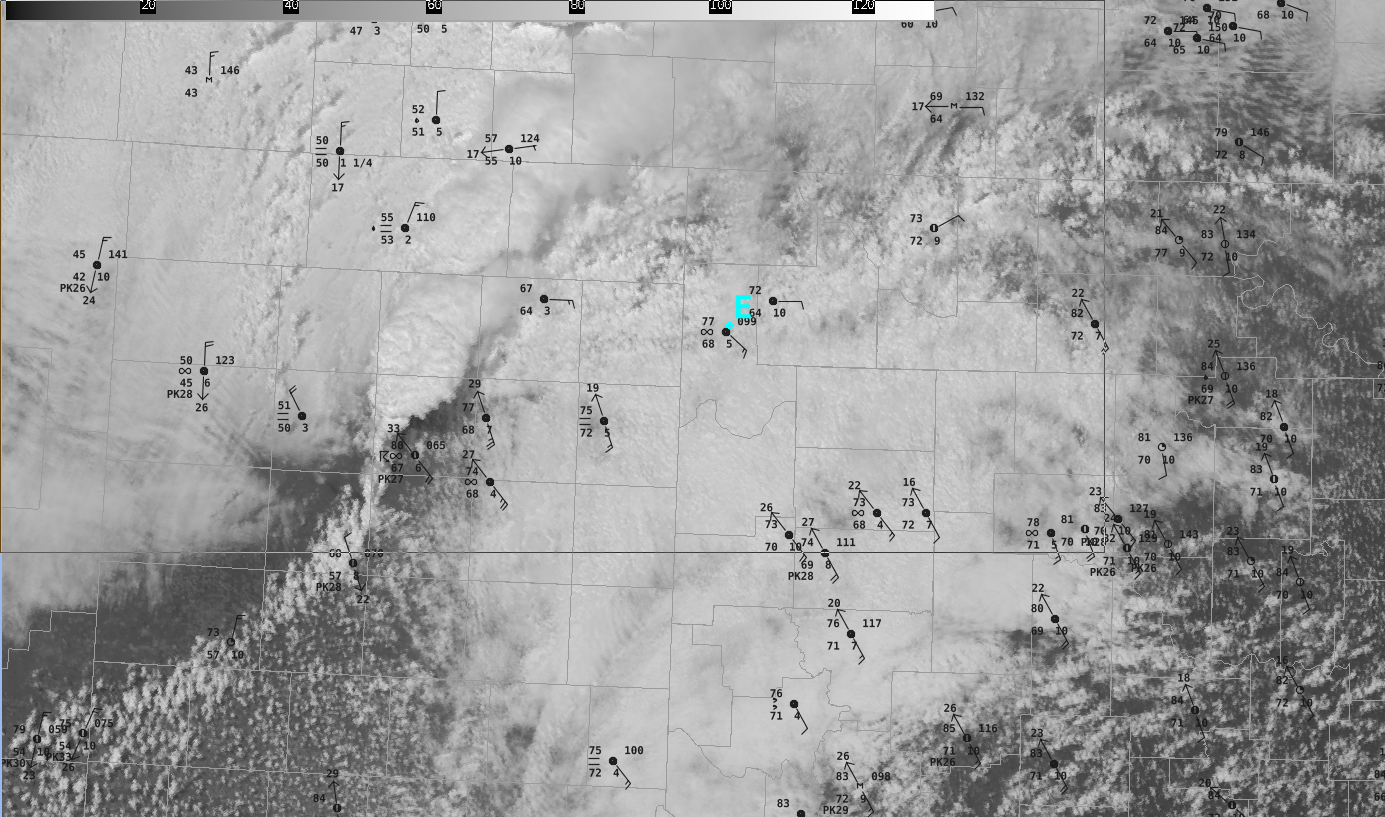
Sure enough, the mesoanalysis shows CAPE at around 2000 J/kg.   Clearly, this is another case where the modified NUCAPS sounding is a noticeable improvement over the unmodified sounding.

Thorcaster

NMDA Tracking well thus far in Tx

Below is a loop of NMDA on the top left, and the operational MDA on the top right. The NMDA seems to be tracking the mesocyclone moving north of Amarillo fairly well as object 2. It does occasionally identify spurious mesos as well (the smaller circles which pop up), but it does seem to have done a better job of identifying and  tracking the primary meso when compared to the operational MDA.

-64BoggsLites