An official website of the United States government
Here’s how you know
Official websites use .gov A
.gov website belongs to an official government
organization in the United States.
Secure .gov websites use HTTPS A
lock (
) or https:// means you’ve safely connected to
the .gov website. Share sensitive information only on official,
secure websites.
Despite moving atop an increasingly dry boundary layer (ref. to dewpoint readings in the mid to upper thirties), the strong to severe thunderstorms keep their strength. The GOES vertical theta-e difference (low-mid) product highlights the moist and unstable air mass nicely with 500-1000 J/kg (another product) present. In fact the thunderstorms really increased in strength when approaching and eventually crossing that plume of unstable air. For this event, the product by CIMMS helped a lot to get a feeling about how supportive the air mass stratification would be ahead of the thunderstorm despite decreasing boundary layer moisture. In the near future we should see a potential increase of a downburst risk with inverted-V profiles to the E/SE of the storm. A marginal hail risk continues with that storm. Helge
Comparing the simulated satellite from NSSL-WRF/GOESR/CIRA on the right to the actual IR on the left at 23 UTC on May 12 depicts general good agreement. The simulated satellite imagery overdeveloped isolated convection over southern Idaho, Montana, and Wyoming, and was a bit to quick/far to the east with the cooler/deeper moisture plume from far northern California to Alberta. The simulated IR verified very well with post-frontal cold air cumulus depiction over western Washington and northwest Oregon. Michael Scotten
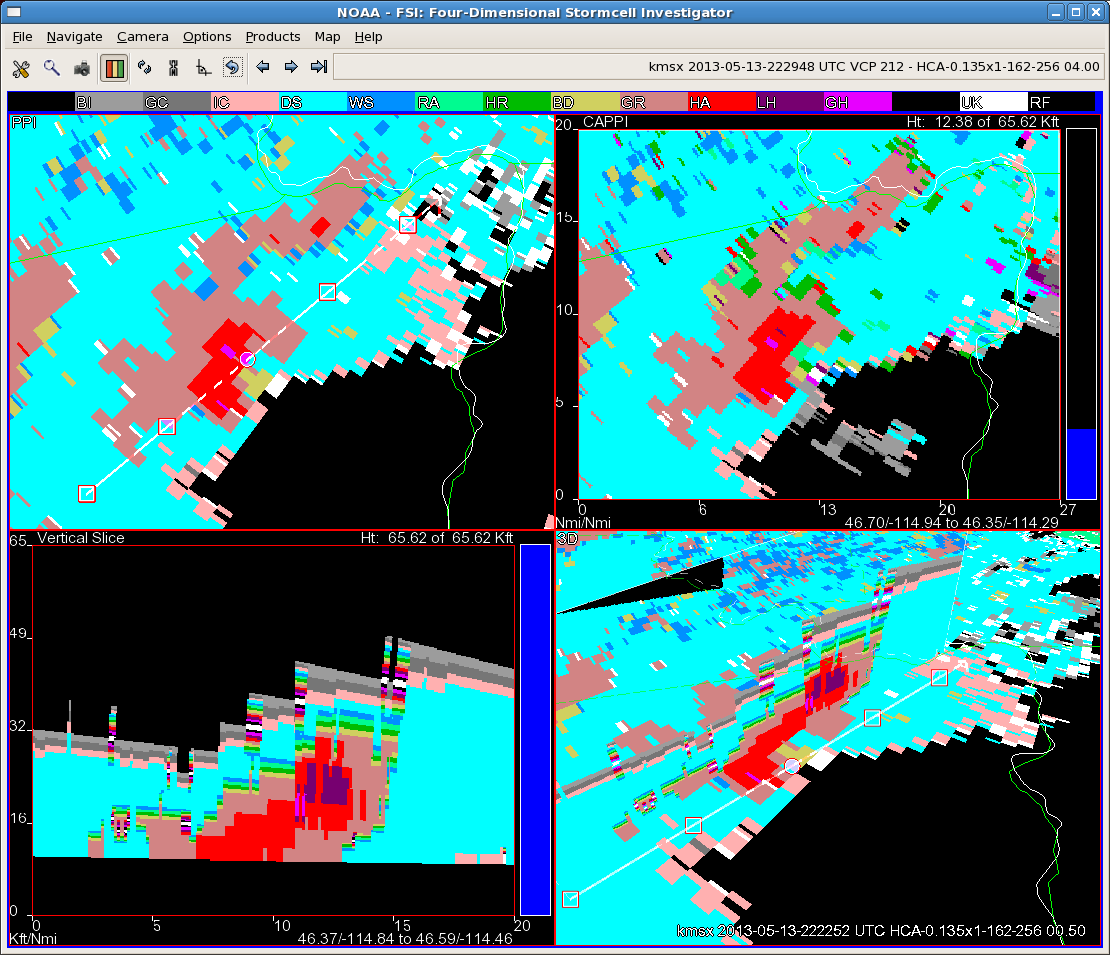
Finally have a storm with decent returns aloft that gives us a chance to investigate the new HSDA (Hail Size Discrimination Algorithm). The image is a four panel from FSI. Note the bottom left panel showing a cross section of the storm. The red color is the usual dual-pol rain/hail mix signature. The purple between 20 and 25 thousand feet is one of the new hail levels…in this case, indicating “large” (between 1 and 2 inch diameter) hail. Of course, with the warm and dry surface layer across much of the area, this hail would likely have a hard time surviving to the surface. We’ll see if we get any hail reports from this storm, but from what I saw to this point, I would be hard pressed to warn on this storm…perhaps an SPS for non-severe hail would be in order.
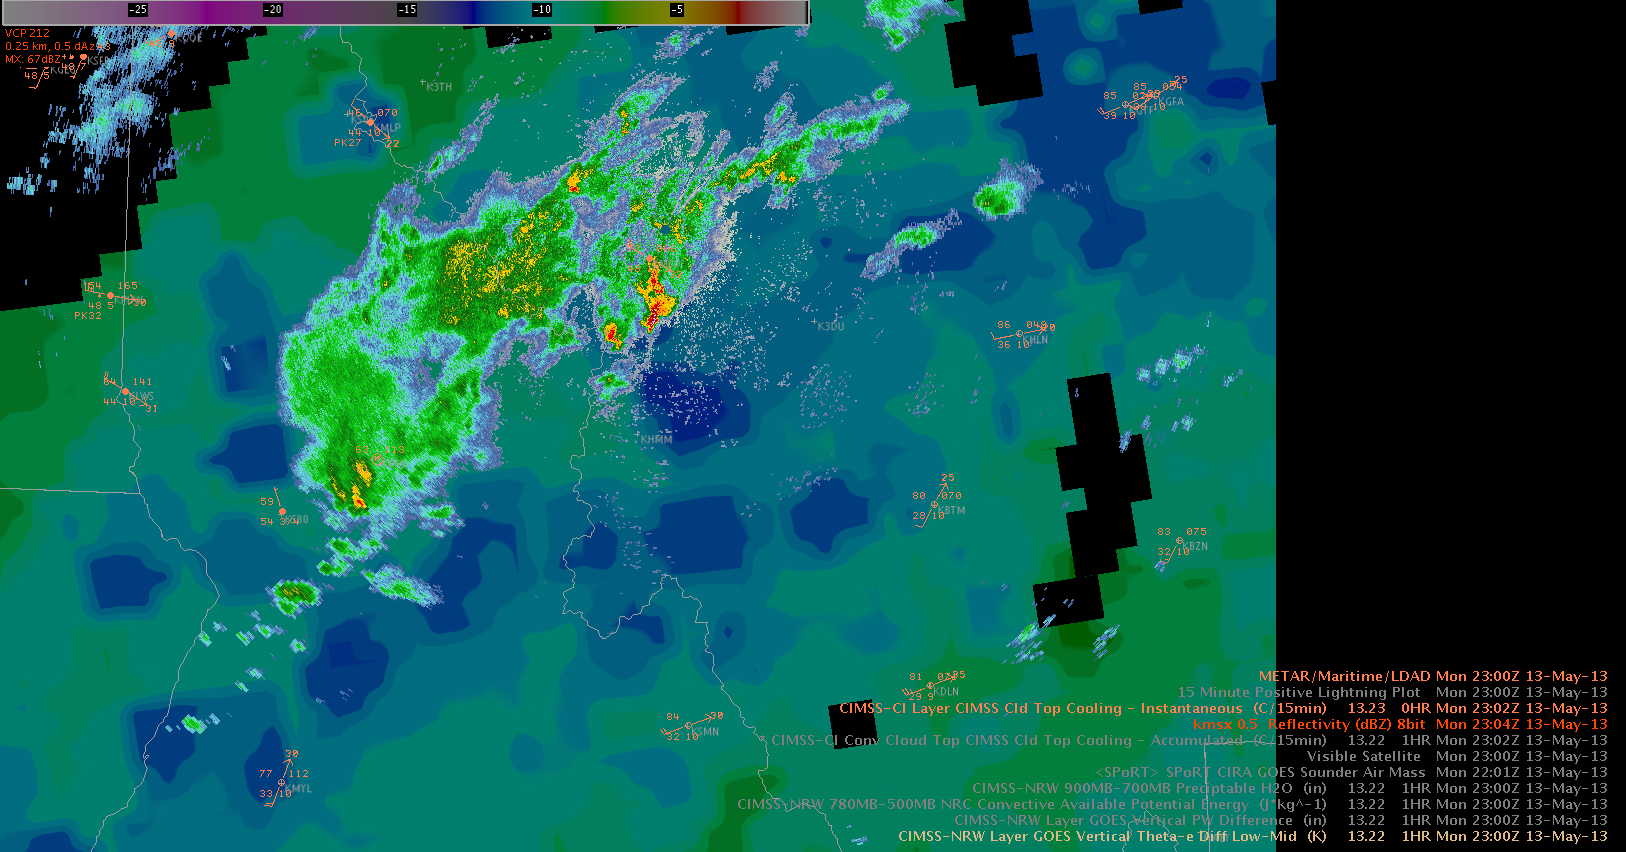
We’re monitoring a few showers/weakly electrified storms over N-central Idaho. Using the cloud top cooling product, the focus for cooling was found to be along the northeastern fringe of that cluster. Using VIS imagery and keeping strong SW-erly shear in mind, the northeastward blowing cirrus shield (increasing in strength due to strengthening convective activity) caused the strongest signals for cooling (e.g. -20K/15min) along the NE fringe of that cluster. However, the most healthy looking cells eventually evolved just to the south of the cirrus shield, where some clearing occurred. It seems like this “messy situation” with rapidly clustering storms may mask local areas with better conditions for initiation.Reflectivity data beneath the cloud top cooling product.
Isolated to scattered high based storms are struggling to develop (with highest reflectivity cores 45-50 dBZ up to 25 kft MSL) as they move northeast across Idaho in a minima in 700-300 mb Precipitable Water Values (PW) according to CIMSS-NRW. Wonder if the storms will intensify if they moved into higher PW values. Michael Scotten
Not expecting a gangbusters severe day. The only area of real risk is across ID/MT today. We are starting out in the Missoula CWA and I have been checking out the GOES-R SATCAST CI product. There have been some weak cells already showing some modest CTC signals…that one in the upper right panel is around -10C/15 min. The SATCAST product in the upper left has shown plenty of weak CI signals and a few stronger ones. Of particular note are all the pink areas on the SATCAST product. Those are “snow contaminated” areas…particularly widespread for this time of year! I find it neat that one can use the SATCAST in concert with the visible image to discern the real signals from the snowy noise. Continuing to wait for interesting storms.
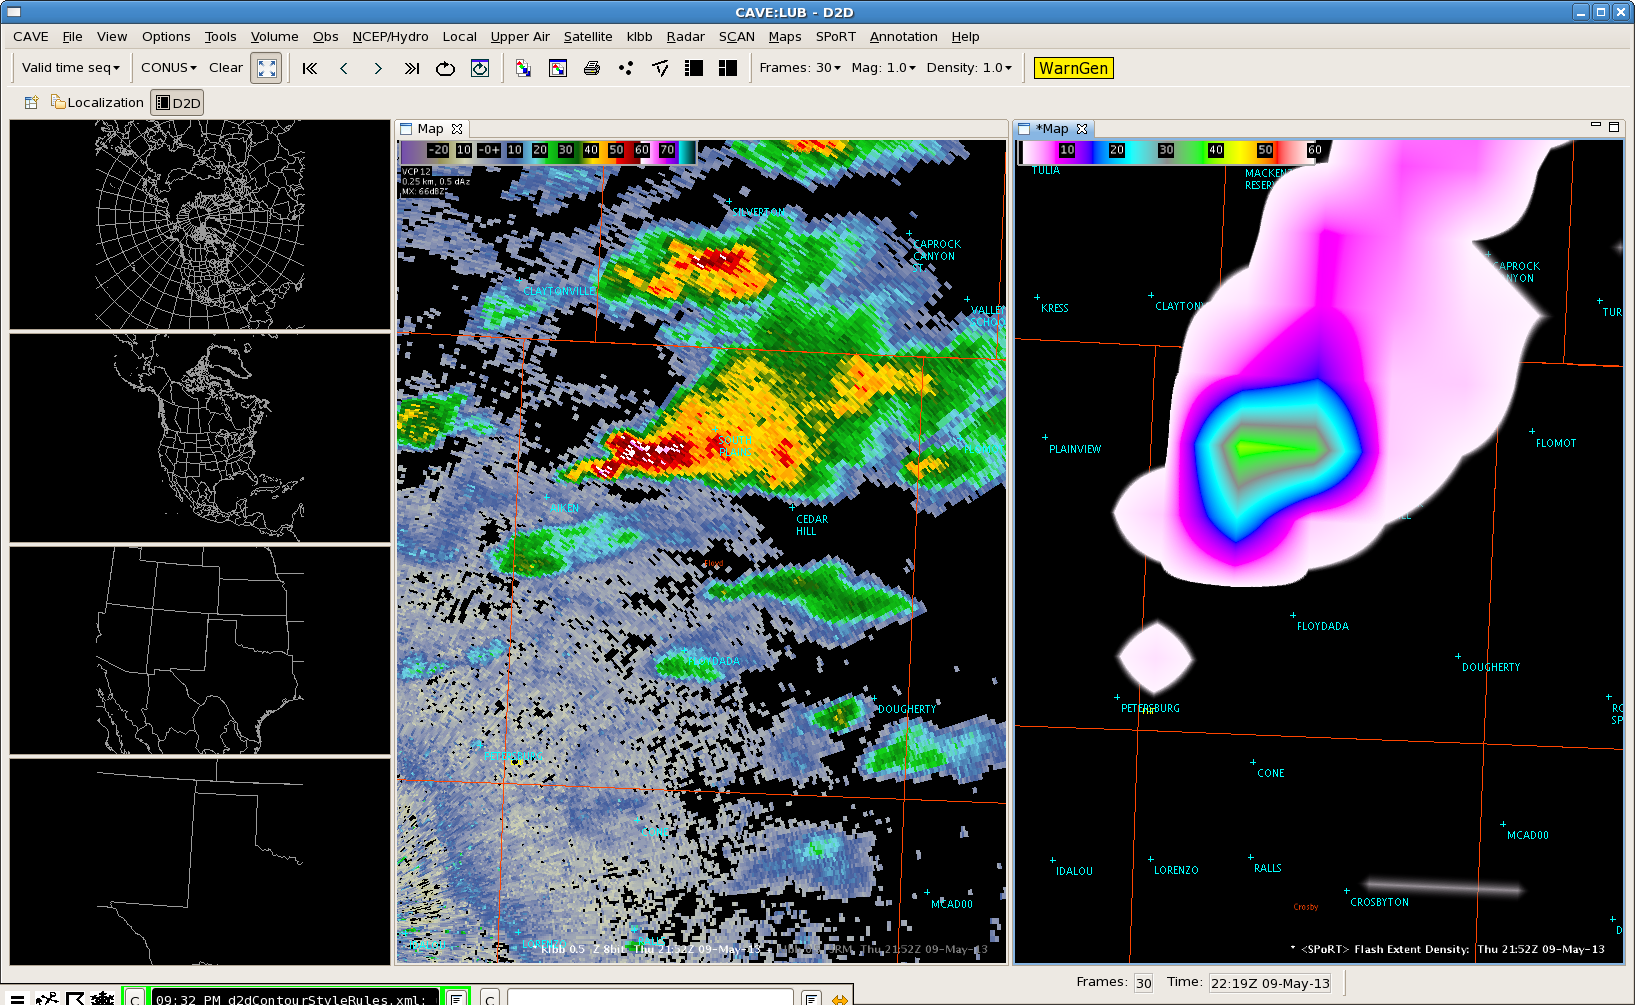
The PGLM flash extent density product was useful at picking out areas of more severe convection in a linear storm segment. While the lightning “jumps” were not all that impressive (~20 to 30 flashes/min), they were still significant enough in conjunction with MESH near an inch to issue a warning. This is evident in the four panel image below which shows FED, Comp Reflectivity and MESH.
A supercell thunderstorm developed north of San Angelo TX at about 2030Z, and became severe as it moved east. After the storm made a hard right turn and began moving southeast, it grew to an extreme level of intensity, especially with regard to hail potential.
DYX radar showing an intense TBSS signature at 2137Z.
About a half hour later, t he storm continued to strengthen, now showing a TBSS with > 30 dBZ and a 70 dbZ core that extended to over 25k feet.
DYX 0.5 degree reflectivity at 2210Z, showing an intense TBSS signature.
The HC product showed giant hail at numerous slices throughout this period of very high storm intensity. Here are examples from the 2210Z volume scan.
DYX HC at 0.5 degrees (2210Z).DYX HC at 1.8 degrees (2210Z).DYX HC at 4.0 degrees (2210Z).
At the time of these images, we received reports of baseball size hail, and numerous reports of golf ball size hail.
Here is a look at a plethora of MRMS products at 2210Z.
MRMS at 2210Z (part 1).
MRMS at 2210Z (part 2).
MESH showed a maximum hail size of over 2.75″ in this image (and actually peaked at over 3″ near the same time). This is in the top left of the first MRMS image.
POSH (which is directly proportional to MESH) reached values of 100% when MESH indicated about 2.5″ or greater. This is in the top left of the second MRMS image.
Reflectivity at -20 degrees C (top right in the second MRMS image) is over 70 dBZ. The 60 dBZ echo reached over 20k feet above the freezing level (bottom left in the second MRMS image). Vertically Integrated Ice (bottom right of the second MRMS image) is over 50 kg/m2, too high for the default color scale.
This data helped provide forecaster confidence in the fact that hail was extremely large in this particular supercell.
We finally had storms develop within the West Texas LMA. The strongest updraft this evening showed marked ramp up of flashes to 40 just as the storms 50 dBZ core reached 26.25 kft briefly before coming back down about 10 minutes later with the flash density also subsiding back to 15 to 25 flashes. Although the storm didn’t reach severe criteria, it was beneficial that the Flash Extent Density updates in 1 minute intervals, which lets the warning forecaster monitor for rapid updraft development between radar volume scans. This storm resulted in a report of dime size hail.