

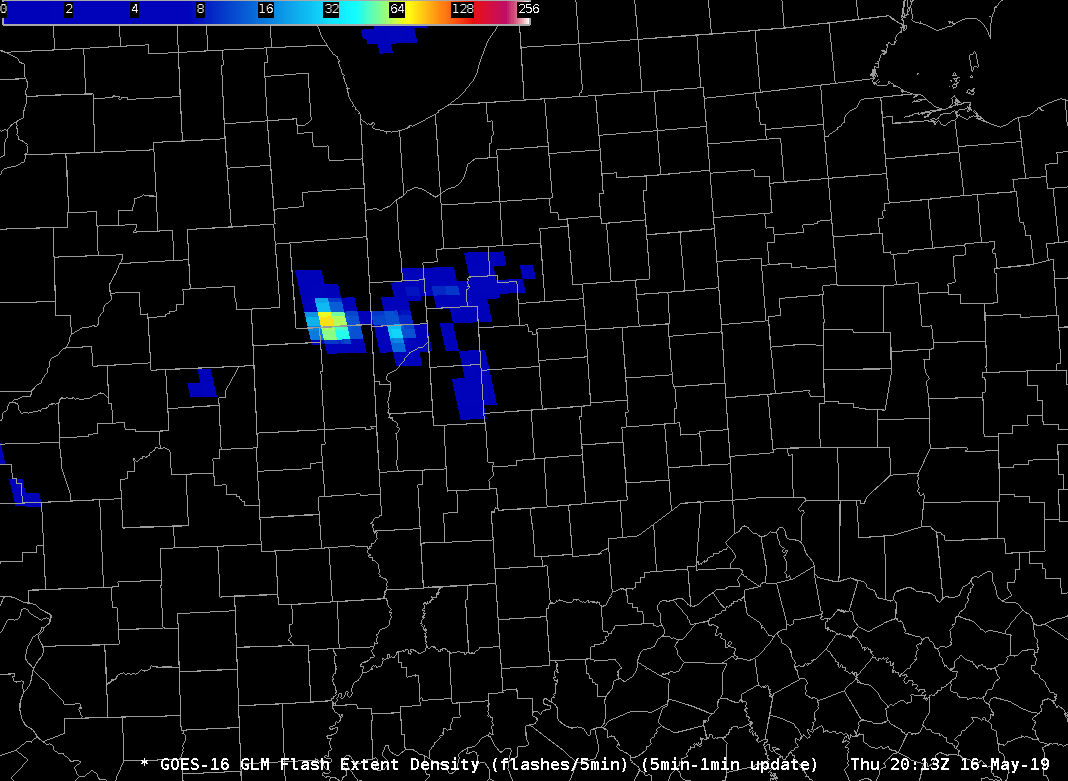
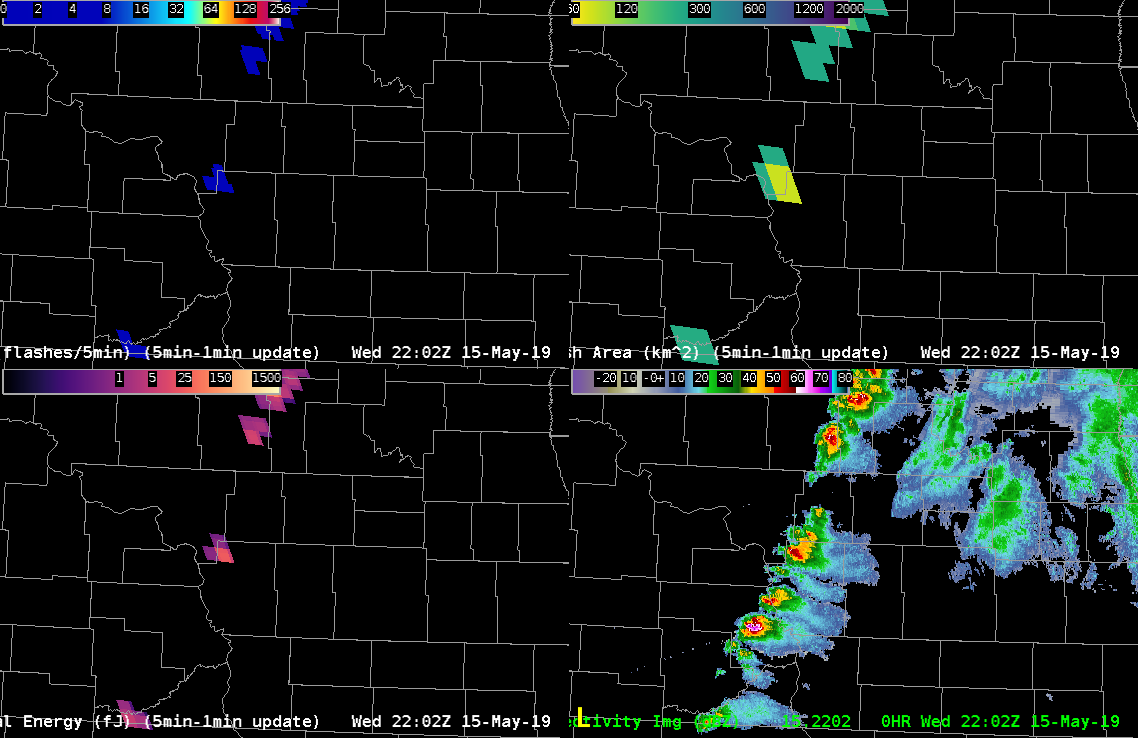
Testing a new colormap for FED using the Rainbow colormap in Python. The first image depicts the modified 5-min FED with the modified colormap. There is more variation on the lower end of the 5-min FED. Will this colormap depict the variation in the more intense convection. The second image is the original 5-min FED colormap. – Jonathan Wynn Smith (ESSIC/UMD)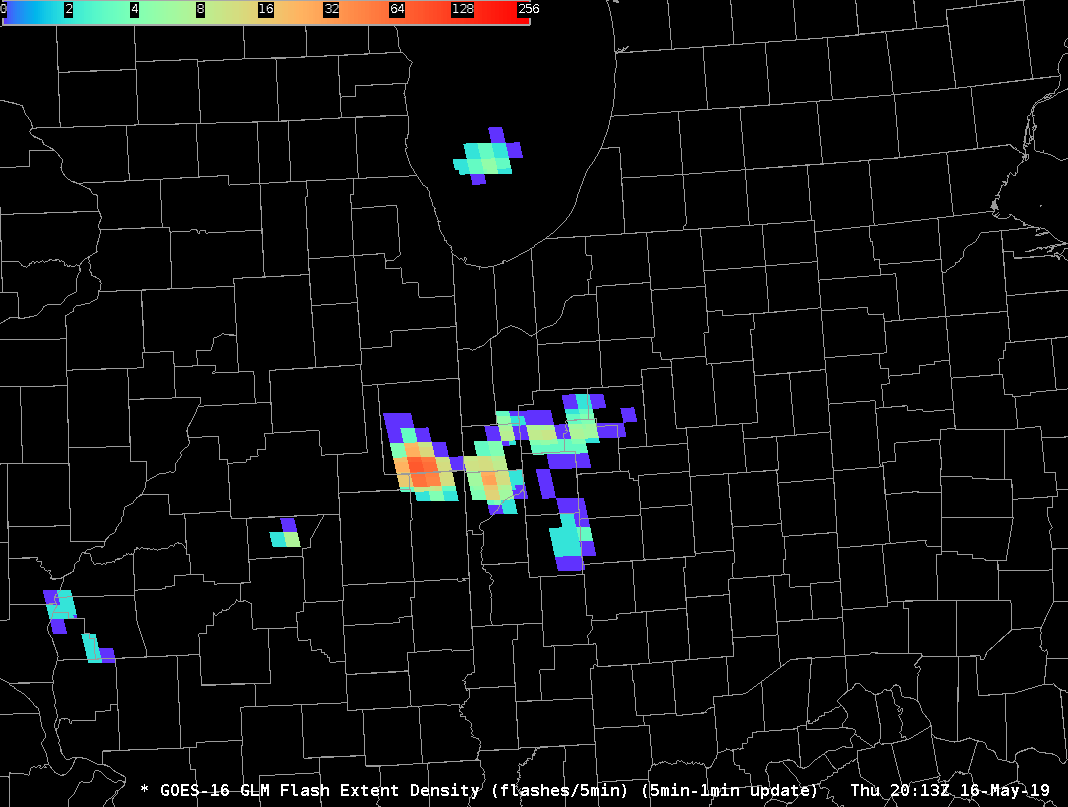
Category: HWT
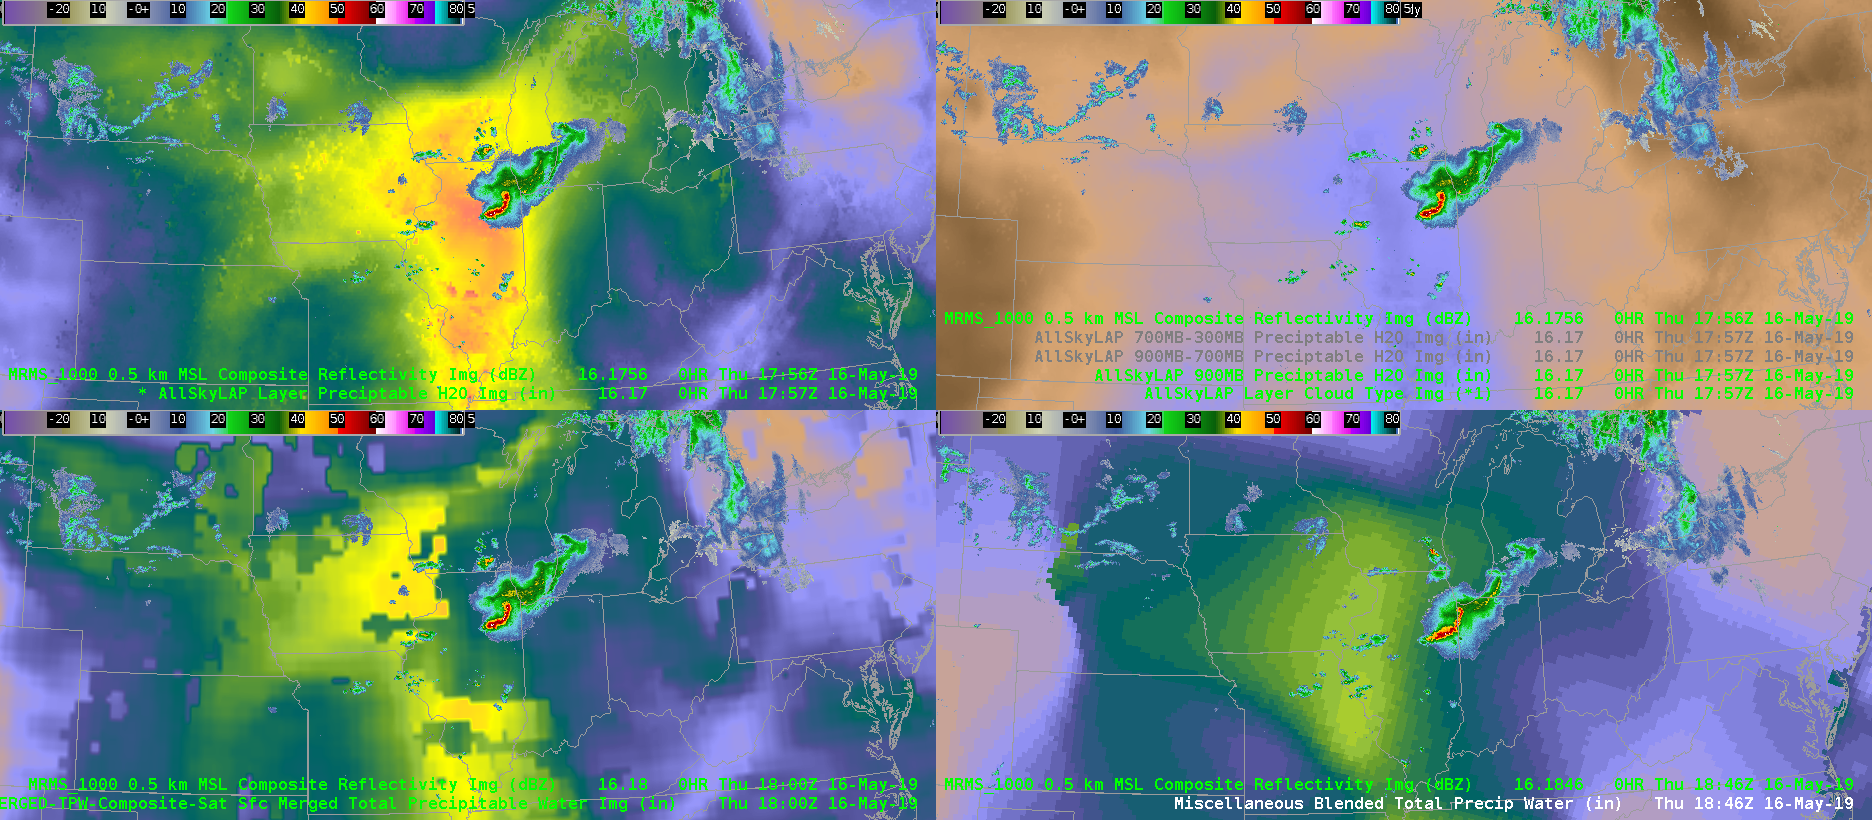
Love the AllSky TPW!
Here’s just a quick example of today’s TPW over the Midwest where a complex MCS and discrete supercell are located. The blended TPW is very low-resolution and therefore you miss the enhanced values that might be located over IL compared to the rest of the upper Midwest and southeast U.S. The AllSky products in IL are mostly using GFS, which may or may not be reliable, but at least it gives a better emphasis and resolution in where to focus your attention….as well as data underneath the severe storm complex. Over central IL, the TPW values are around 1.5 inch vs. the 0.9 inch for the blended TPW.
Animation below shows: Upper Left AllSky All Layer TPW, Upper Right AllSky sfc-900mb TPW, Lower Left Merged TPW, Lower Right Blended TPW
Below is a screen shot of the MRMS loaded at a similar time over the TPWs to see the impact of the cloud cover.
messing around with NUCAPS in the volume browser
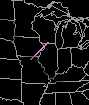
A first cut at depicting the added value of the volume browser in AWIPS for NUCAPS soundings is shown below. I messed around with vertical cross-sections and time series of NUCAPS soundings in the upwind area of the MCS in northern IL that is expected to contain some potential for new convective initiation. Below is the transect of the cross-section.
Here is the cross-section of equivalent potential temperature from NUCAPS at 18Z, NAM-12 at 18Z, and the HRRR at 18Z.
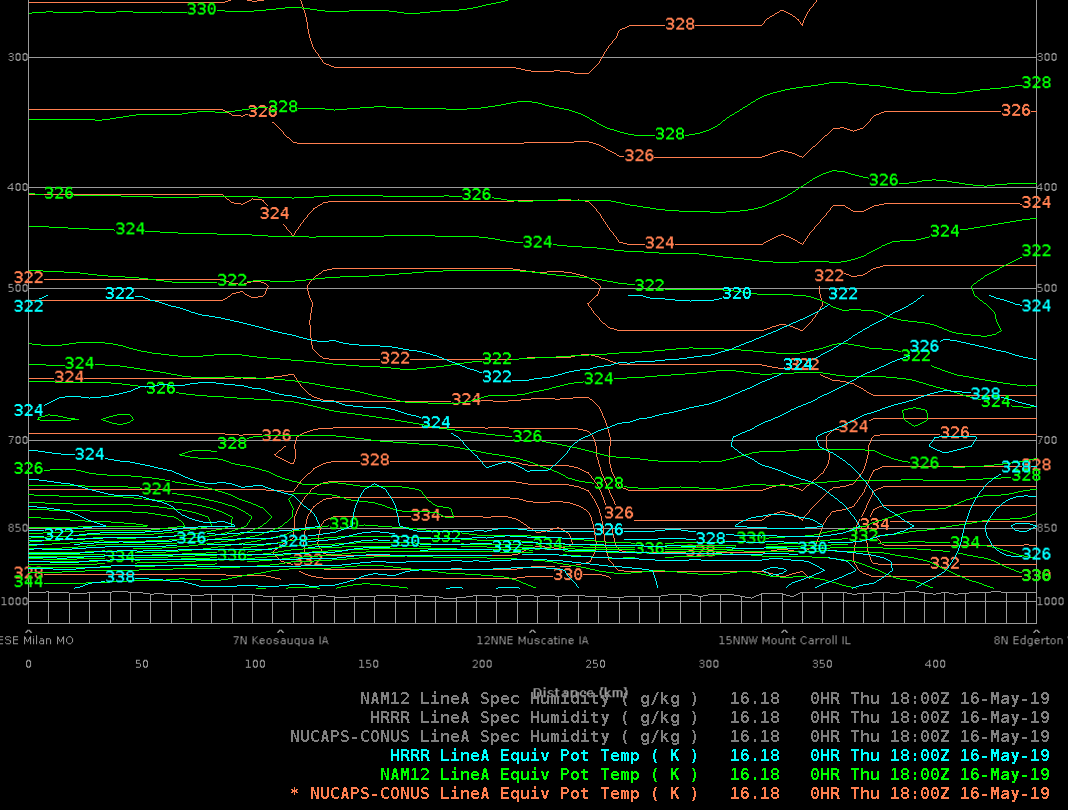
The two models and satellite soundings are in very good agreement at altitudes above 700 hPa, in less agreement between 700 and 850 hPa, and in poor agreement between 850 hPa and the surface. NAM12 is the highest with theta-e values between 336 and 344K, with HRRR about 5-10K colder, and NUCAPS still colder in the SW portion of the cross-section, and slightly warmer in the NE portion of the cross-section than HRRR. Is it because of temperature or moisture differences? It appears dominated by moisture discrepancies as shown below:
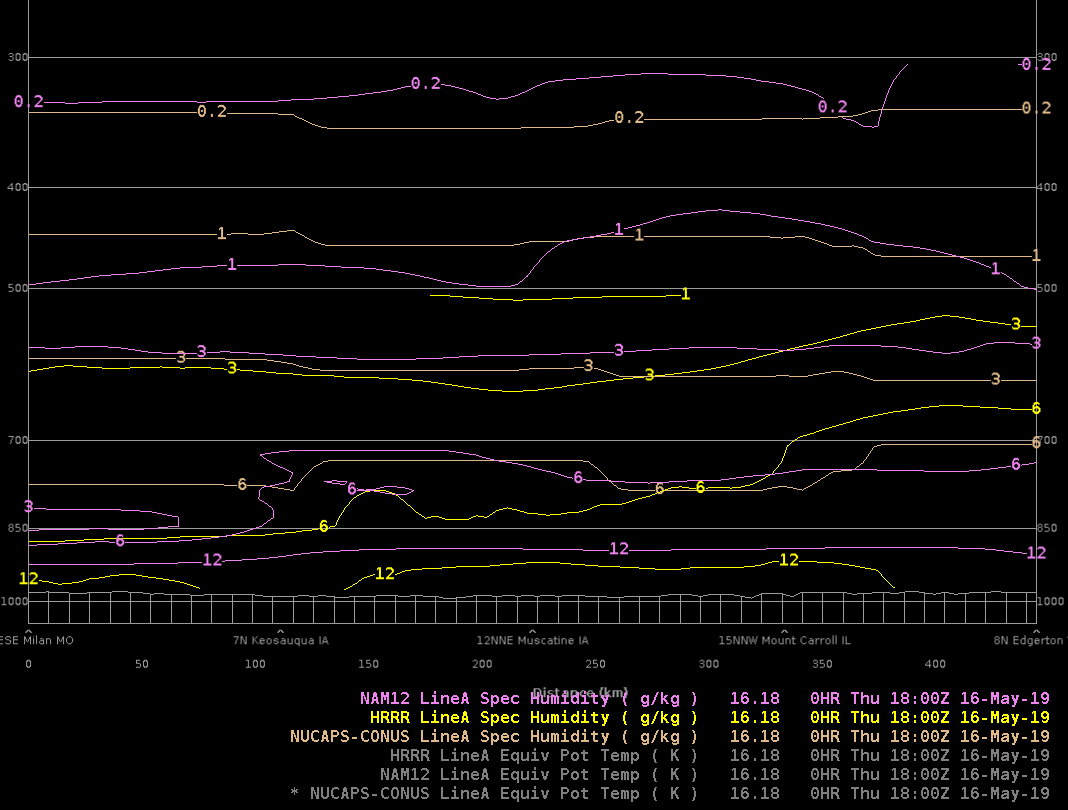
I can’t quite figure out how to plot additional (or fewer) contours (AWIPS newbie here) but its quite clear that NAM12 is the moistest and NUCAPS is much drier near the surface. The 12Z Quad Cities RAOB had 7-8 g/kg for water vapor mixing ratio but with the six-hour discrepancy it is challenging to establish ground truth.
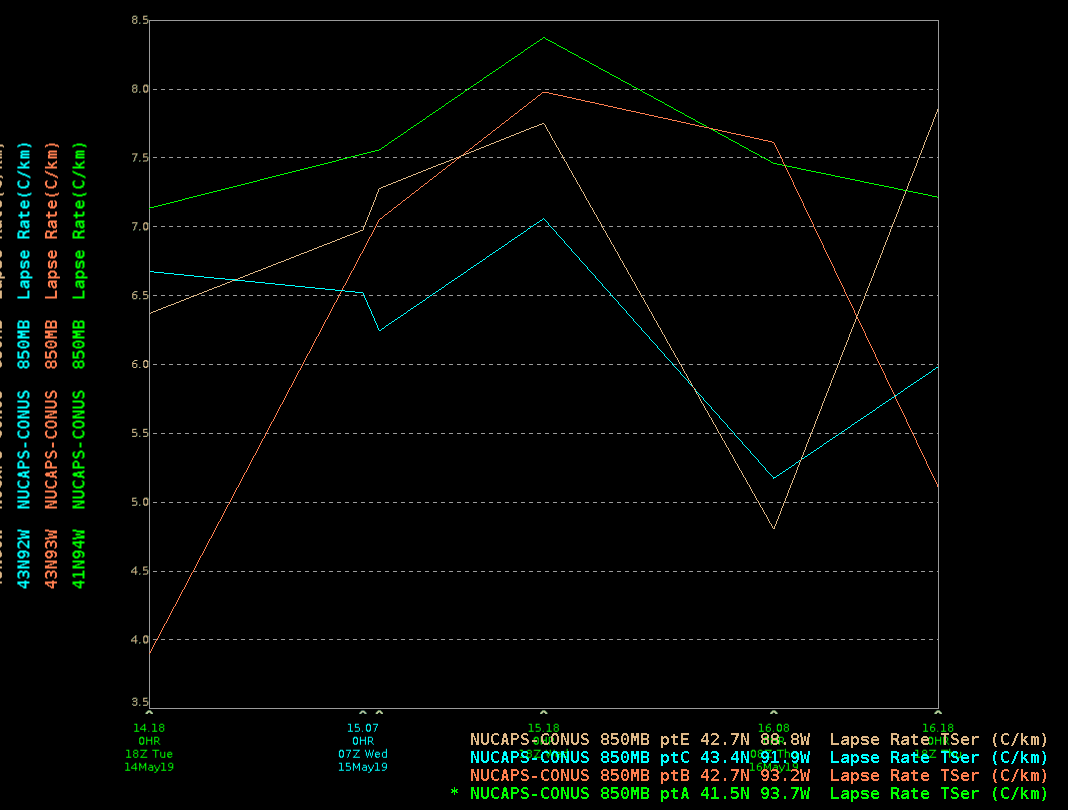
The volume browser is capable of making time series plots too. Here is a ring of points depicting time series of 850 hPa temperature lapse rates over the last few days of soundings:
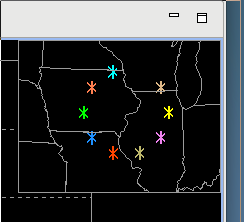
The time series plot is shown below. A two-day time series of sparse satellite soundings isn’t all that insightful, but using this for 0-6 hour NUCAPS-FCST products (in comparison to model output) might be quite valuable for forecasters.
Brian Kahn
Using AzShear to Forecast for Large Areas
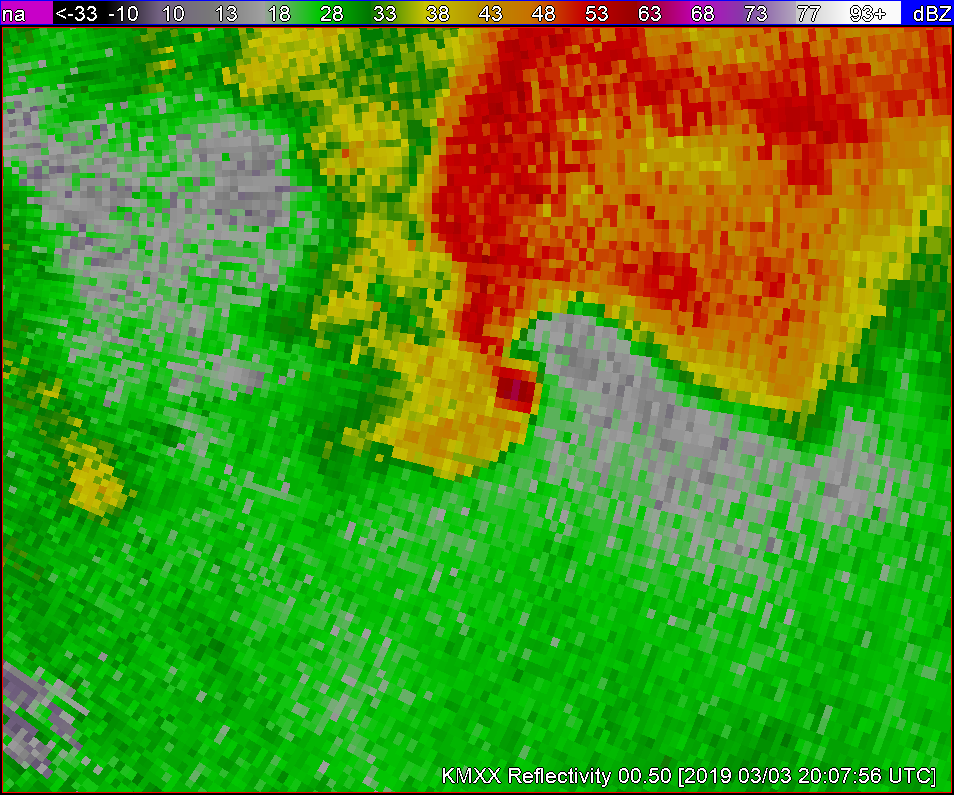
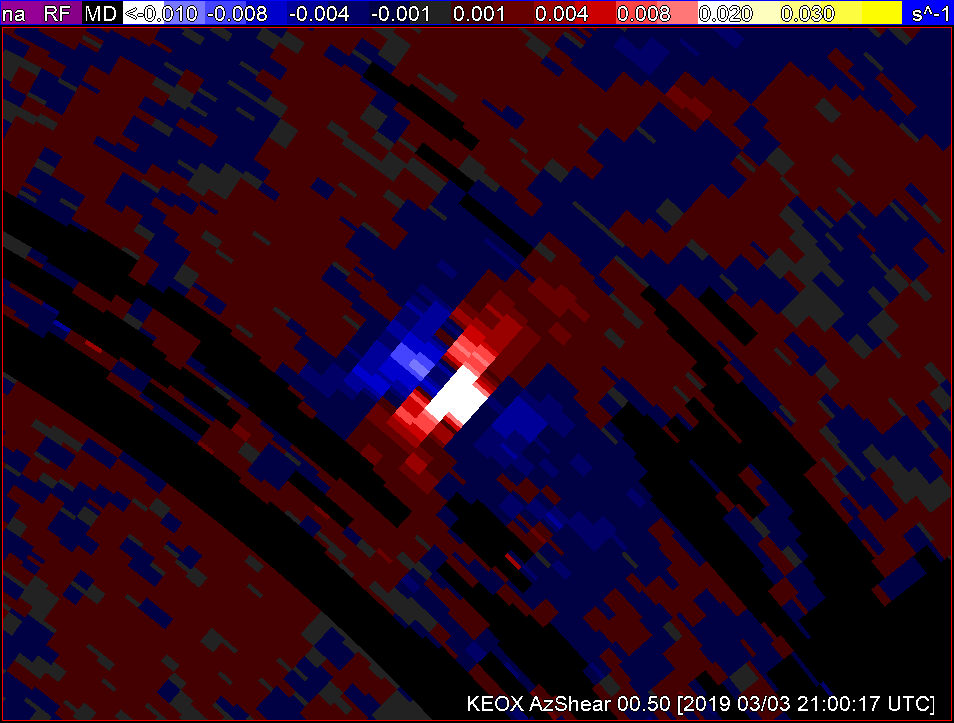
Analyzing the tornadic signatures on the KMXX RDA. This storm is quite obviously already tornadic with an apparent hook echo on reflectivity as well as very strong gate to gate velocity couplets through multiple levels. If I were to use AzShear in conjunction with the plethora of other available tools I would want the product to help me identify areas that are not as well developed as others.
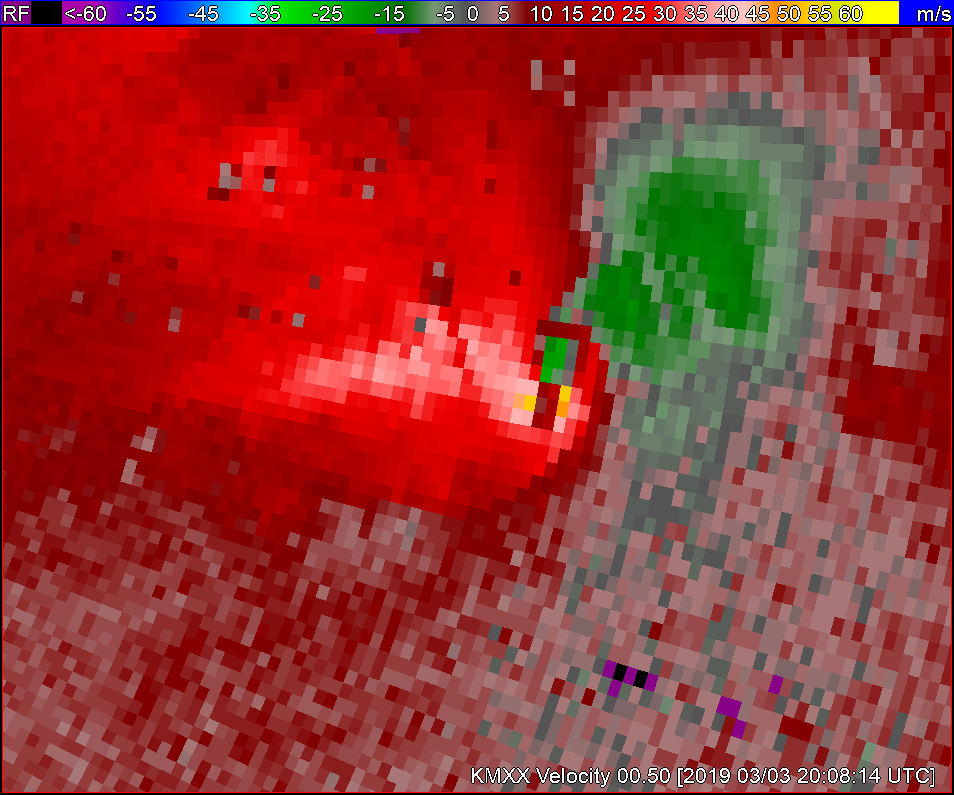
In a case like this I’m not sure how much AzShear would help me forecast what is an obvious tornado. But as I am usually responsible for a very large area to METWATCH I decided to switch to the KEOX radar and zoom out to see if AzShear would help to identify areas that aren’t such a ‘slam-dunk’.
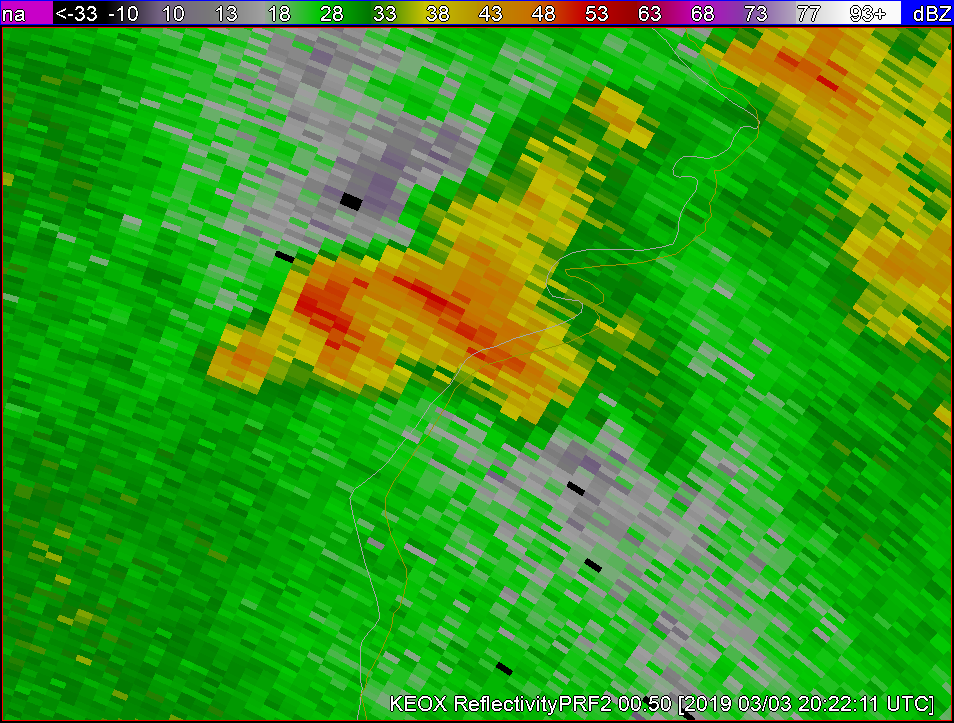
This storm to the NE of the RDA doesnt appear to be anything more than a lower threat general thunderstorm on first glance, especially when compared to other storms in the area.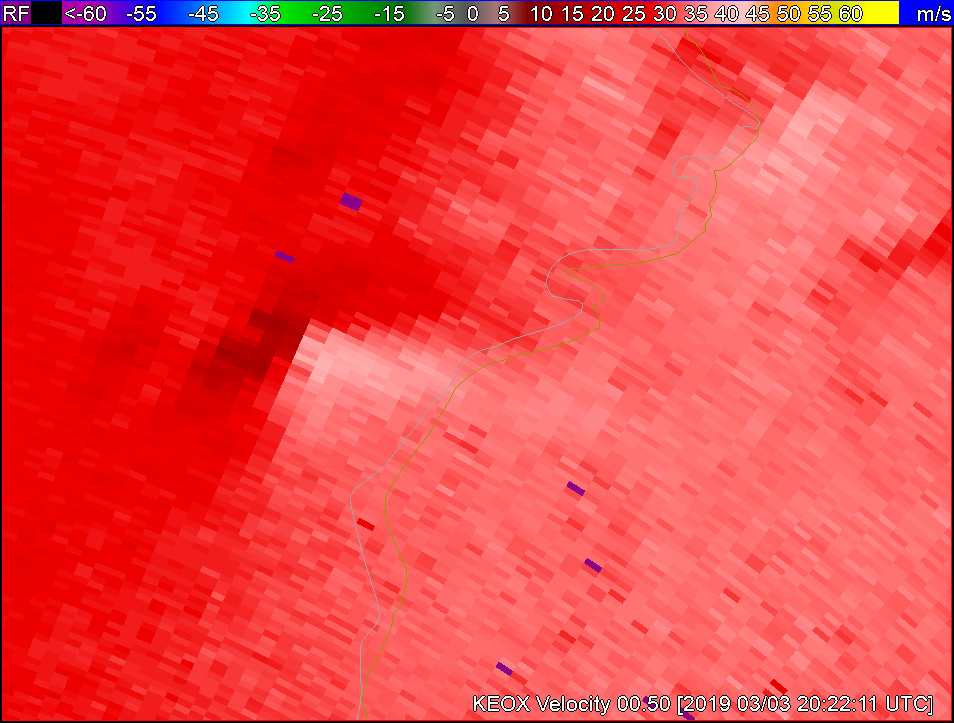
Velocity doesn’t show anything too crazy either.
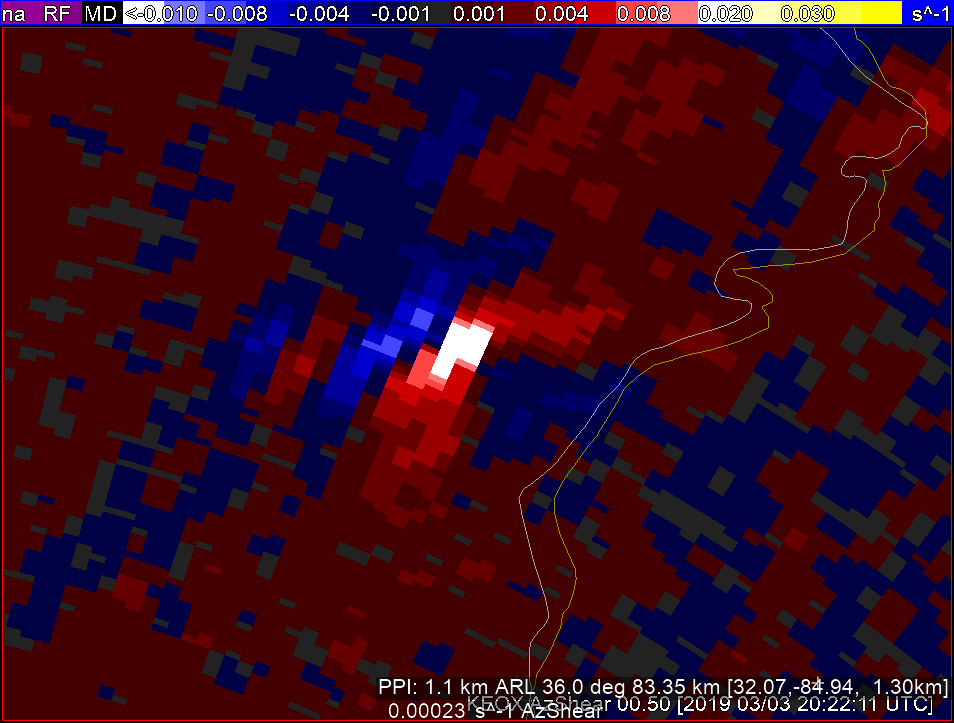
BUT when I look at KEOX AzShear there seems to be an area of shear that may lead to something…Lets see…
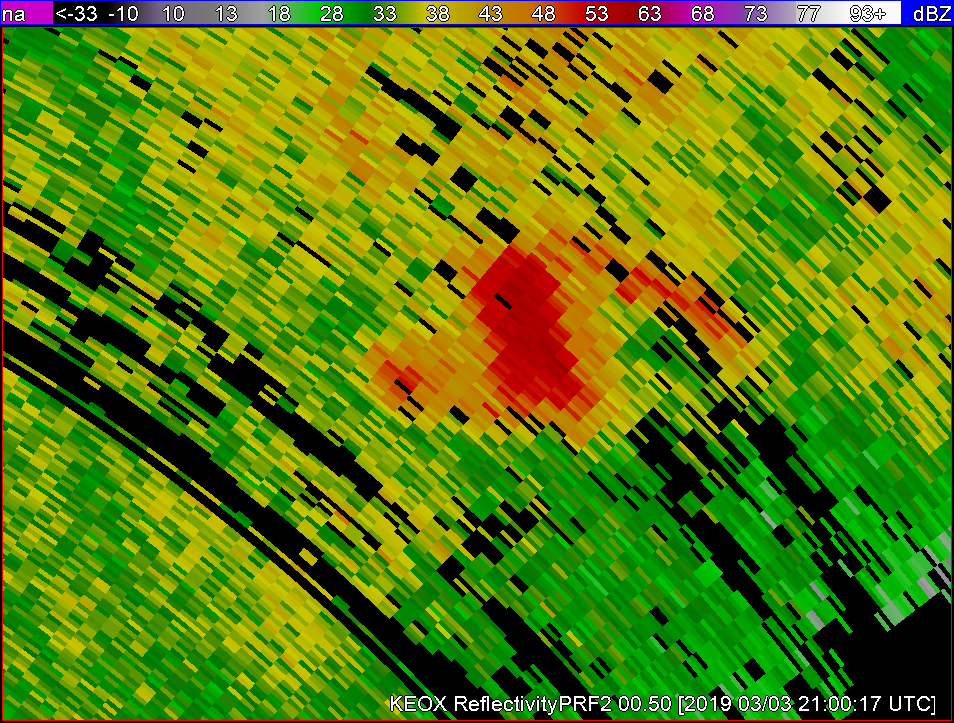
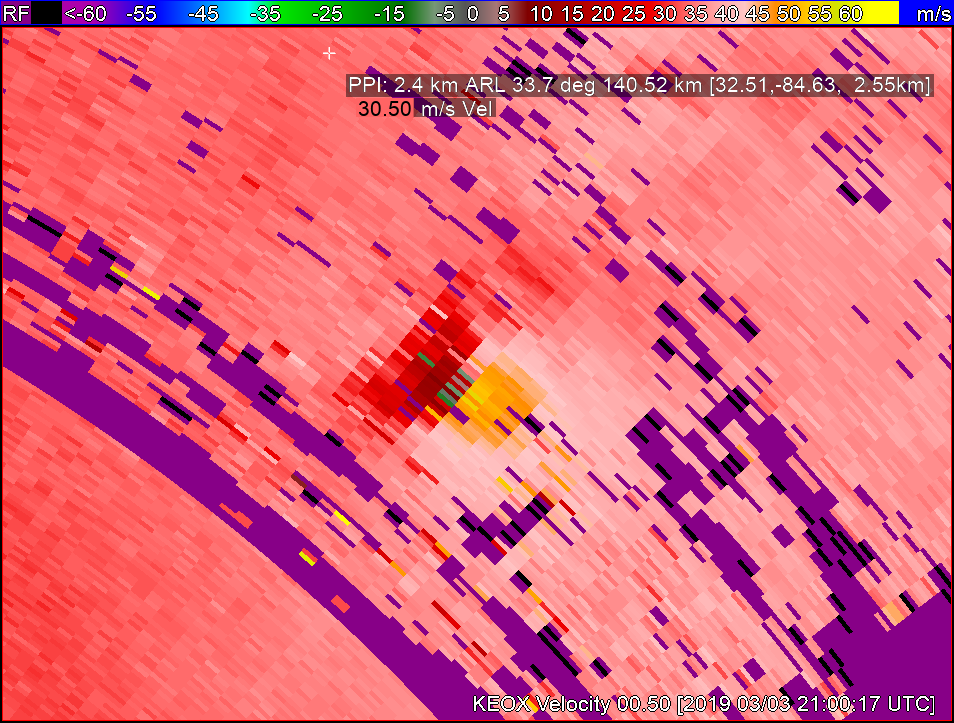
Following the same storm for 40 minutes I noticed the following: The storm developed into a possibly severe thunderstorm with reflectivity dBzs in the low to mid 60s, significant velocity couplets as well as continued higher AzShear.
For the purposes of how I am required to warn customers, generally 1.5hr required lead time icelyfor a hit within 5nm, this 40 min advanced notice of a storm that has increased severity significantly would be invaluable when added to my stable of available tools to use.
***Desmond***
NMDA sensitivity issues. No anticyclonic detection either.
This will be a great case study to follow up on with the NMDA:
As we were watching the differences between the NMDA compared to the MDA and DMD on a QLCS/squall event over east-central Illinois/northwest Indiana, we noticed some differences in circulation detection. Particularly, it was noted that the detection sensitivity was poor when there was a strong anticyclonic circulation present aloft (KIND ~100nm southeast of storm; 0.5deg; 12kft AGL). Interestingly, all 3 of the algorithms picked up on the weaker cyclonic circulation instead; all with different sizes and intensities.
See below 1847Z: MDA upper left, DMD upper right, NMDA lower left.
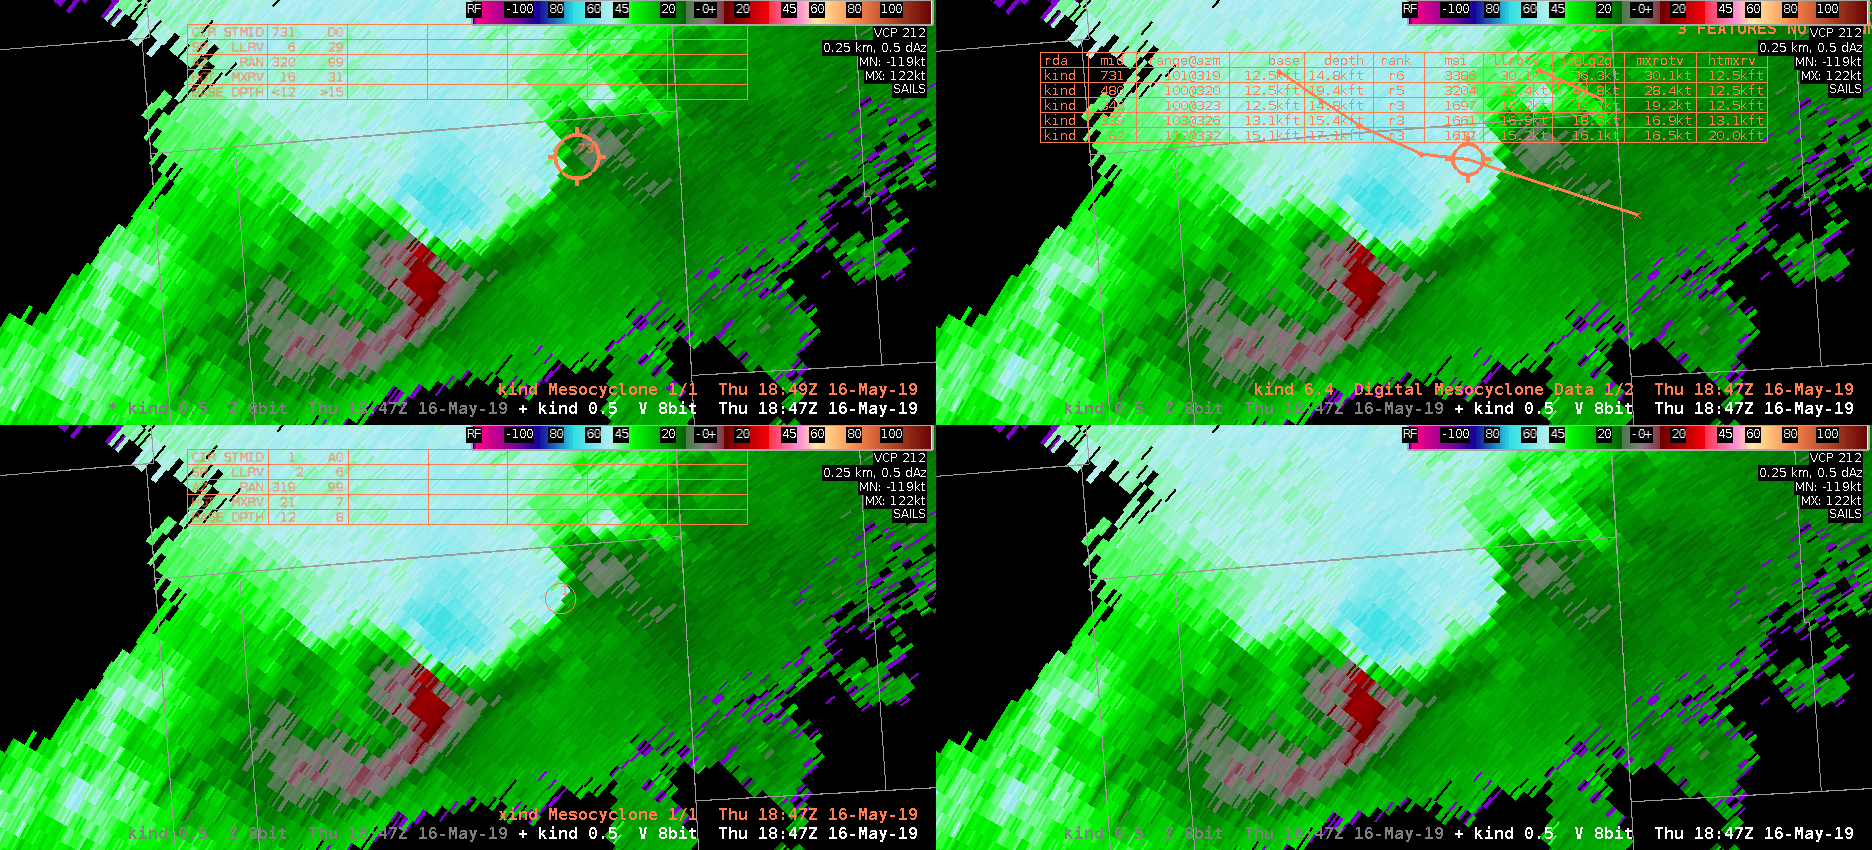
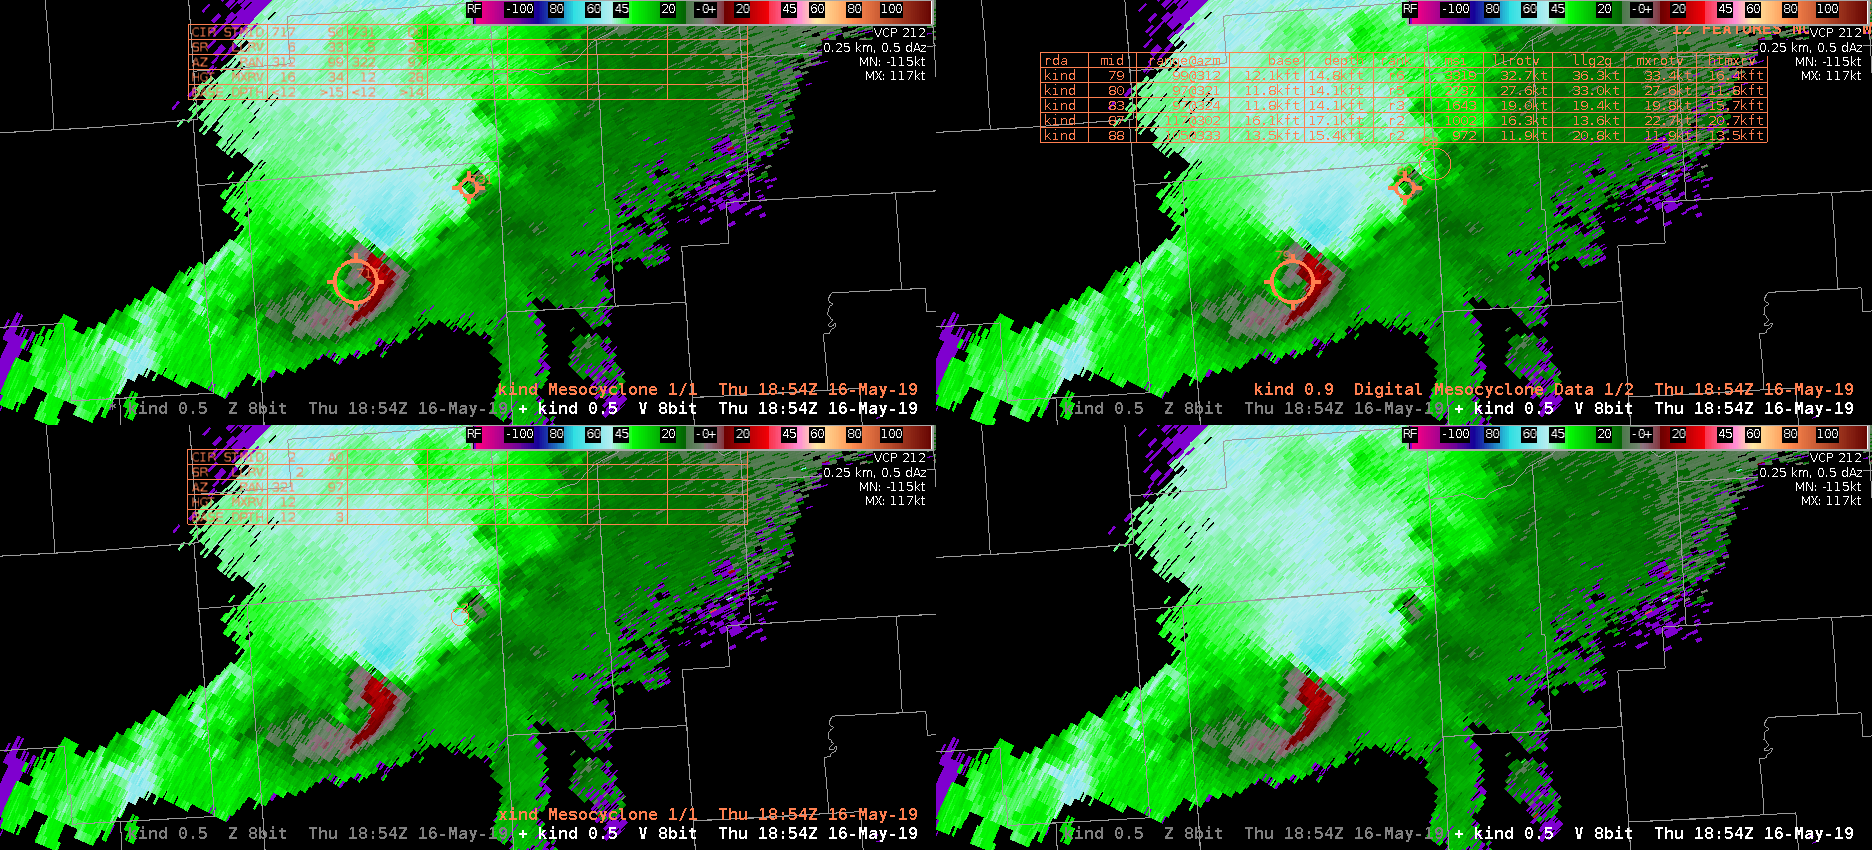
Image below 1854Z: As the storm progressed and started having a cyclonic rotation associated with the area of interest right next to an anticylconic area of rotation, the MDA (upper left), DMD (upper right), picked up that particular circulation first. The NMDA (lower left) was still slow to grasp onto this very strong circulation aloft that could have a Severe lead time significance as the rear inflow and convergence strengthens.
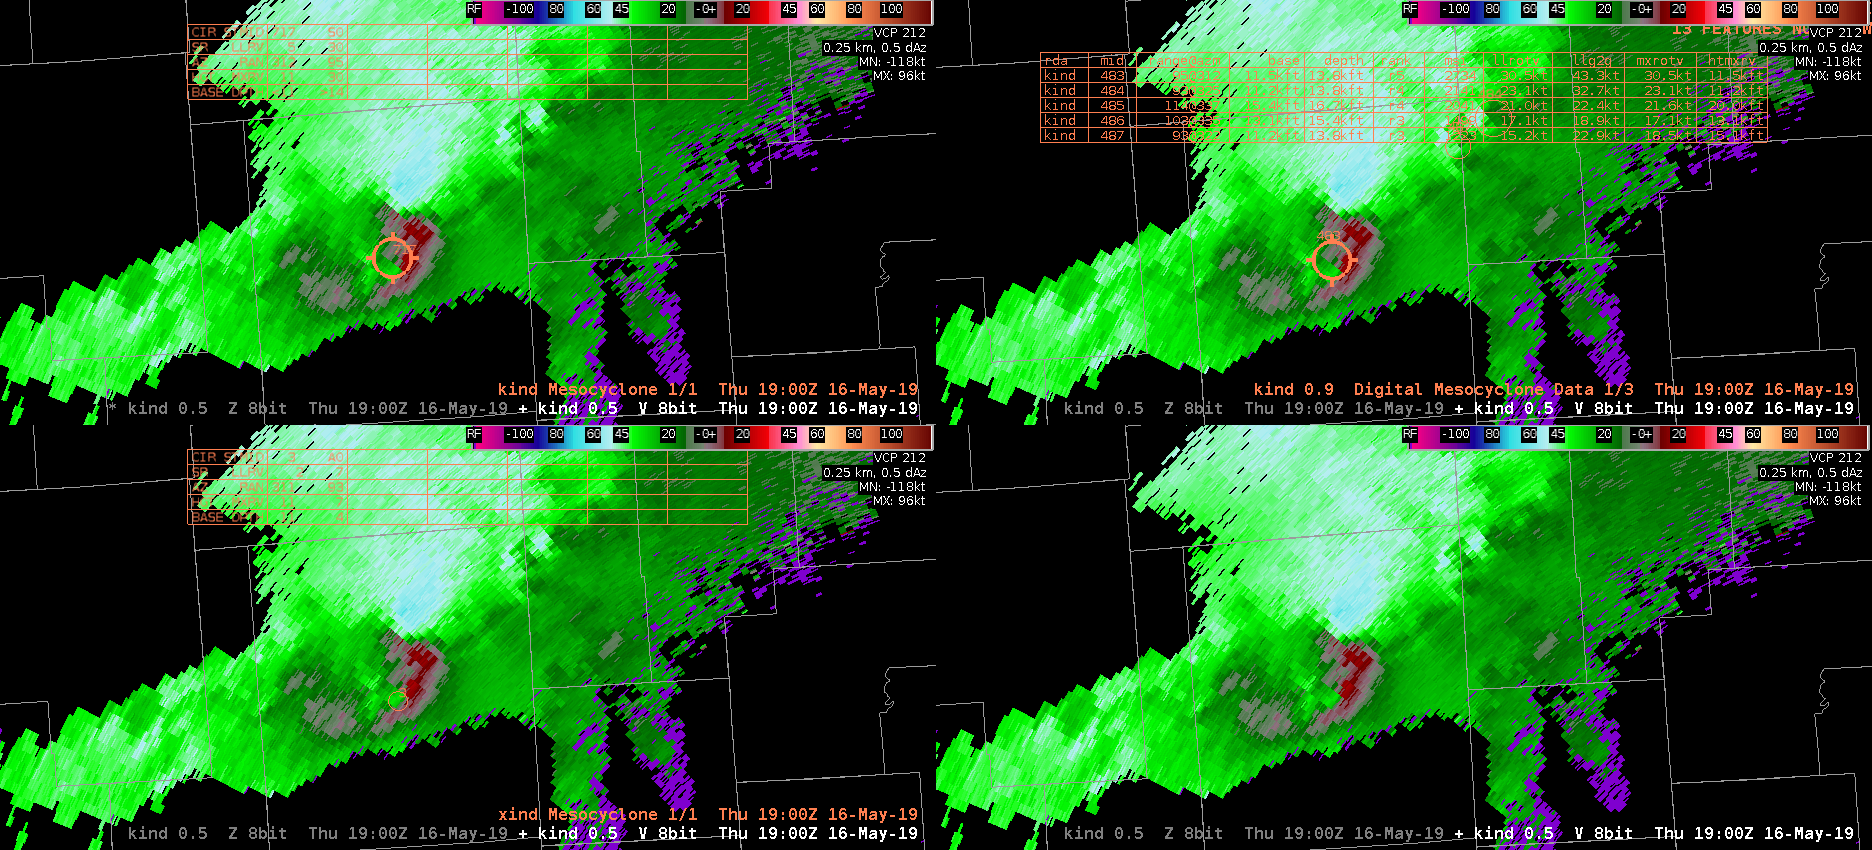
Looking several radar scans forward now below (1900Z), the NMDA finally recognizes significance of this large feature (see below; lower left panel). However, it is still does not signify a strong circulation as denoted by its tiny circle. I’m curious about LSRs during this time.
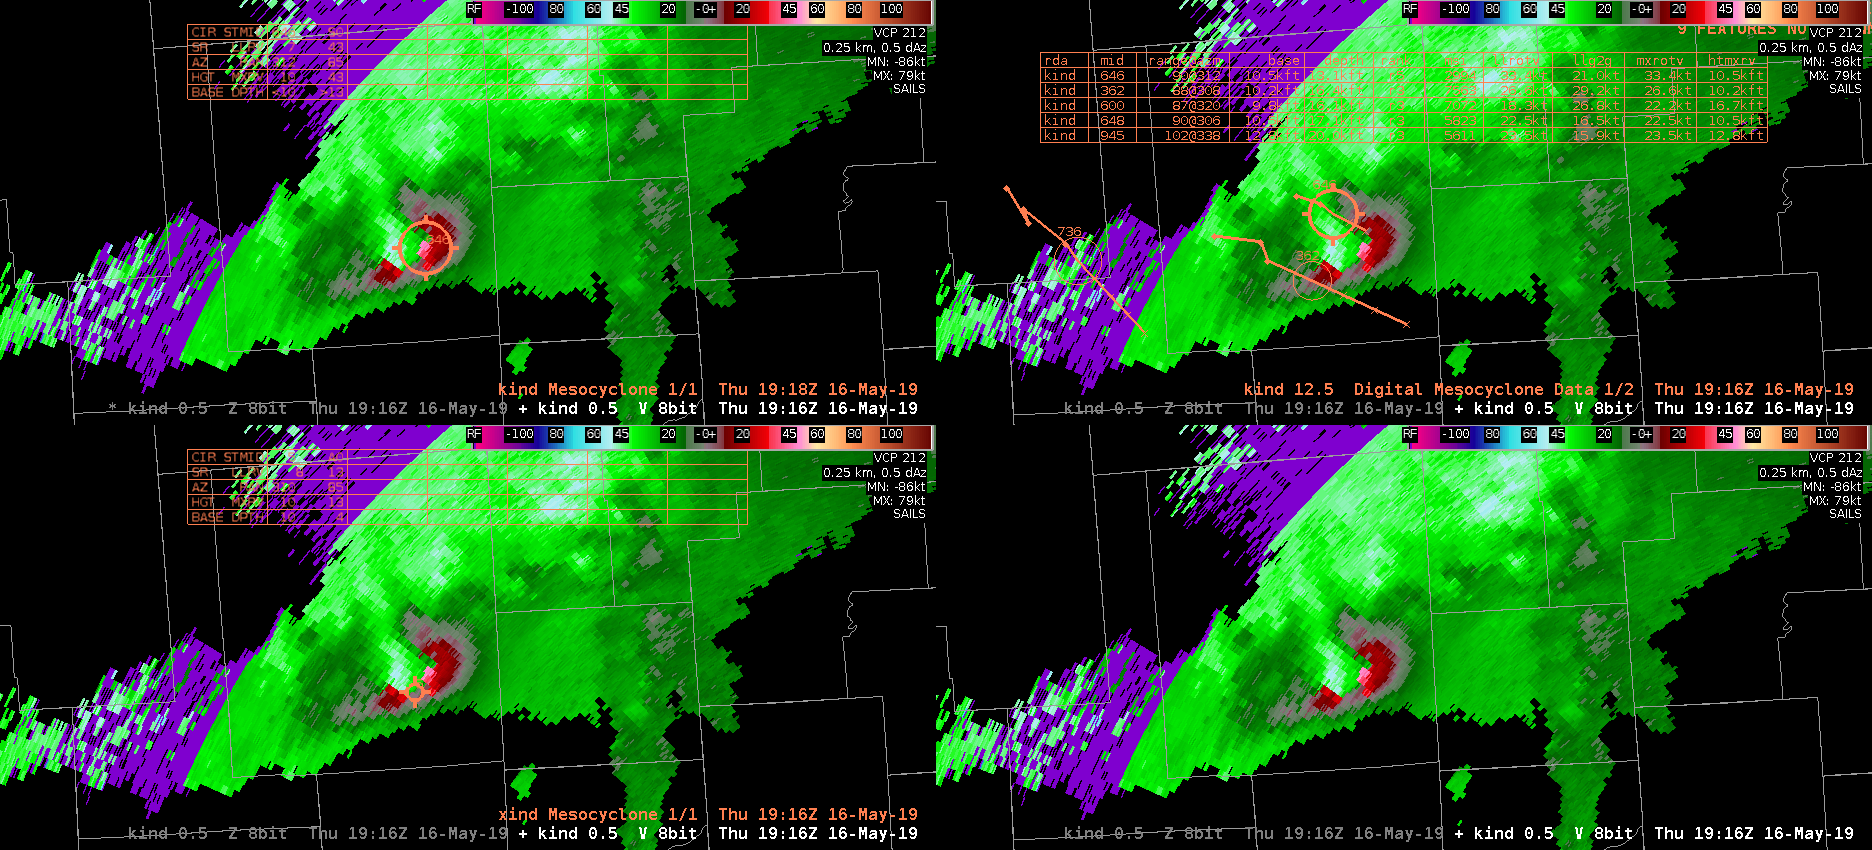
Finally, 16 min later (1916Z see below; 11kft AGL), the NMDA finally shows a significant circulation center due to a strong descending rear inflow jet/notch. I would suggest that the NMDA does not give me a lot of lead time confidence in issuing a severe thunderstorm warning in this instance (probwind showing over 90% at this time). NMDA only seems to help give confidence once it detects the feature after it has already evolved. What’s also interesting to note from the below image is that the DMD and MDA picked their denotations on (only) the cyclonic circulation, whereas the NMDA only seems to centrally focus on a weird convergence region and not the cylconic side of this lowest scan velocity data (i.e. more localized for NMDA). None of the products seem to attract to the anticyclonic side, which actually strengthens with time due to the descending notch. -shearluck
IDSS Usage from GLM/Minimum Flash Area
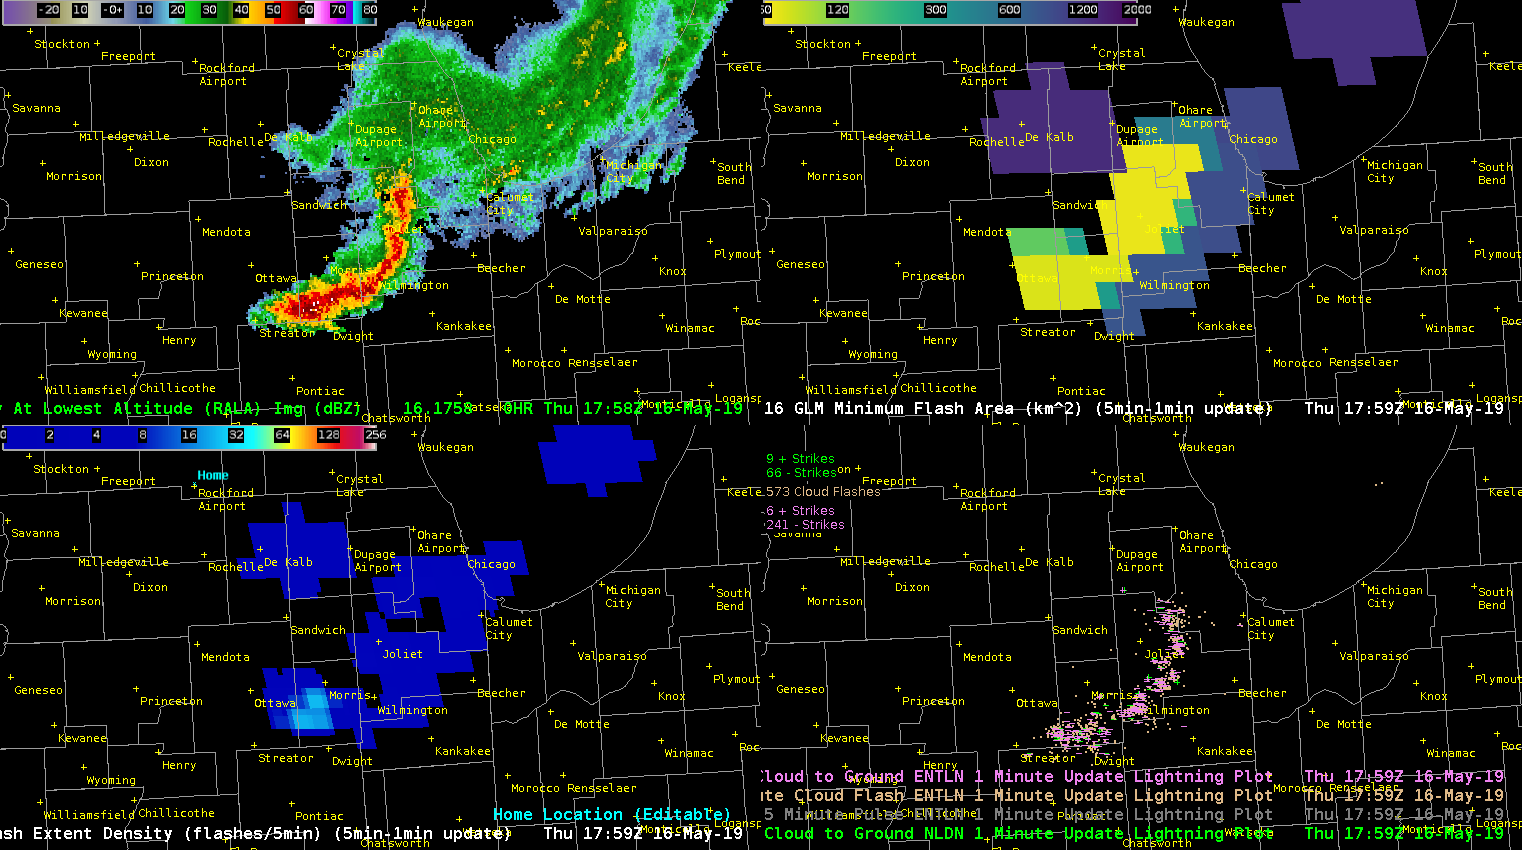
An MCS shifting southeastward across northern IL was producing quite a bit of lightning, and much of it was moving through the southwest portion of the line per Flash Extent Density. From a IDSS standpoint, the Minimum Flash Area and FED proved that it’s necessary to look at both GLM products and ground based lightning products to see the “total” picture. The GLM products captured a larger flash that extended out into the stratiform area behind the main line that is not seen in the ENTLN and NLDN products. This information can be especially important for Airport Weather Warnings and/or outdoor venues. You can easily see that the flash extends almost back to the Rockford Airport, while the main line and most of the flashes are ~80 miles away. In other words, areas near Rockford Airport are not out of the woods yet for lightning.
-Tempest Sooner
Slight Risk West and East
Operating across the CONUS today with one team of forecasters located in Idaho/Montana in MSO and the other in Illinois (ILX). The forecasters have also been encouraged to investigate the environments nearby their official CWAs including the ongoing MCS currently crossing the Chicago CWA.
For those in Illinois, the environment remains supportive of development off of outflows from the ongoing MCS or other possible convection. Though it remains likely that the MCS will continue to remain strong and pose a threat for strong winds at least across the NE section of the CWA.
For Idaho, it currently remains rather calm, but the CAMS have consistently latched onto expected convection later in the day including supercell storms.
-Kristin
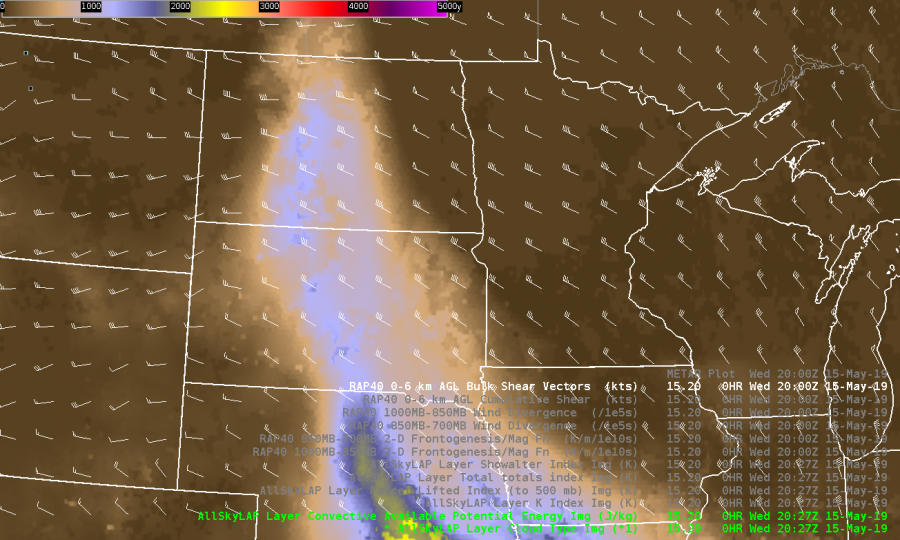
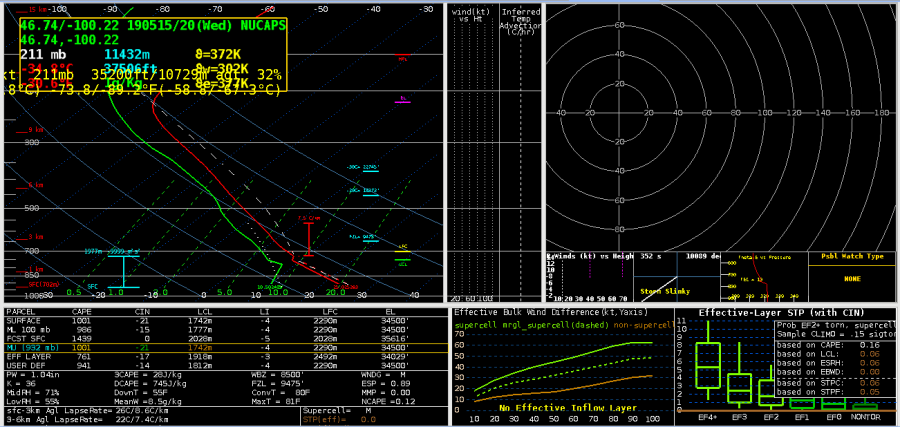
NUCAPS and AllSky Helpful in BIS
NUCAPS and AllSky both were helpful in tracking the afternoon destabilization over North Dakota today. Both data sources provided what seemed to be fairly accurate assessments of CAPE values. Clear sky and GFS retrievals in AllSky were similar, with the clear sky retrievals very closely matching the NUCAPS retrievals. Having a plan view depiction in AllSky was very helpful when combined with RAP shear vectors in accessing afternoon storm potential.
NUCAPS Sounding:
— warmbias —
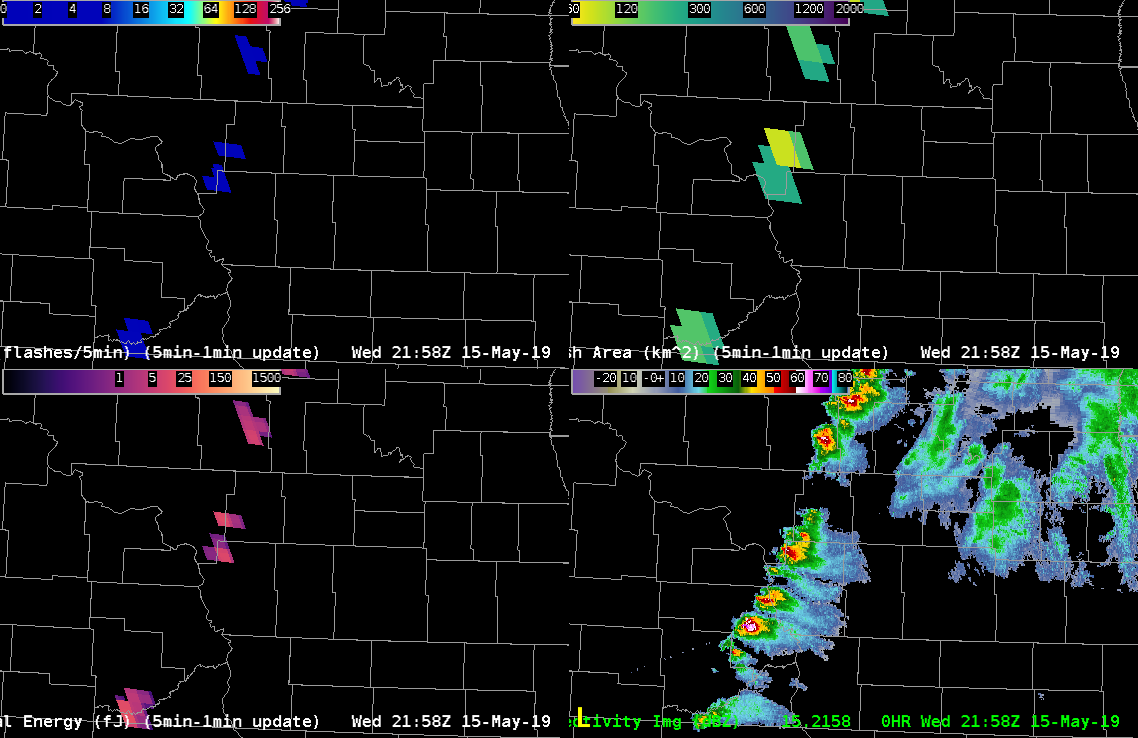
Lightning observed but no GLM
ProbSevere gives every indication of a severe storm over Morton County, ND (see ProbSevere read out below). The Earth Networks lightning suggests there of 52 fl/min but GLM FED gives 0 fl, TOE 0 fJ, and AFA 0 km^2. The two depictions below show those three GLM fields with the MRMS 1 km reflectivity. Perhaps there is an issue with viewing angle at this northern latitude. – Jonathan Wynn Smith (ESSIC/UMD)
ProbHail: 93%; ProbWind: 95%; ProbTor: 5%
– MESH: 1.83 in.
– VIL Density: 3.20 g/m^3
– ENI Flash Rate: 52 fl/min
– ENI Flash Density (max in last 30 min): 0.89 fl/min/km^2
– Max LLAzShear: 0.007 /s
– 98% LLAzShear: 0.006 /s
– 98% MLAzShear: 0.008 /s
– Norm. vert. growth rate: 2101Z 1.3%/min (weak)
– EBShear: 38.0 kts; SRH 0-1km AGL: 155 m^2/s^2
– MUCAPE: 2925 J/kg; MLCAPE: 1657 J/kg; MLCIN: -36 J/kg
– MeanWind 1-3kmAGL: 26.4 kts
– Wetbulb 0C hgt: 9.0 kft AGL
– CAPE -10C to -30C: 546 J/kg; PWAT: 1.3 in.
GLM: max FED: 0 fl; sum FCD: 0 fl/5-min
GLM: max TOE: 0 fJ; avg AFA: 0 km^2
Avg. beam height (ARL): 1.28 kft / 0.39 km
Object ID: 273531
PS: 98
ProbSevere Potential Gotcha
A potential “gotcha” and/or training issue…
I initially loaded a 4-panel with 0.5 Reflectivity and ProbHail overlaid, 0.5 SRM and ProbTor overlaid, and 0.5 Vel and ProbWind overlaid, but I had not loaded the full ProbSevere Model in any of the 4 panels. I then noticed that there was a 29% ProbTor (which was erroneous with bad dealiasing), but my attention wasn’t called to it because the 2nd circle around the storm only appears on the full ProbSevere. It would seem like a good idea to either always have the full ProbSevere displayed or if folks prefer to load the threats separately, perhaps need to add a second circle around the ProbTor object.
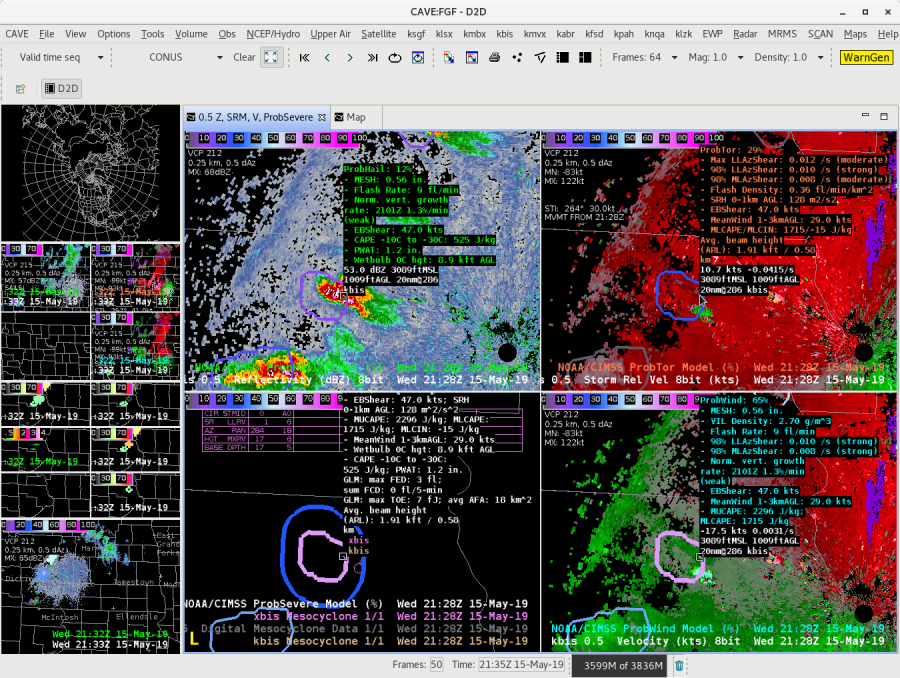
-Tempest Sooner