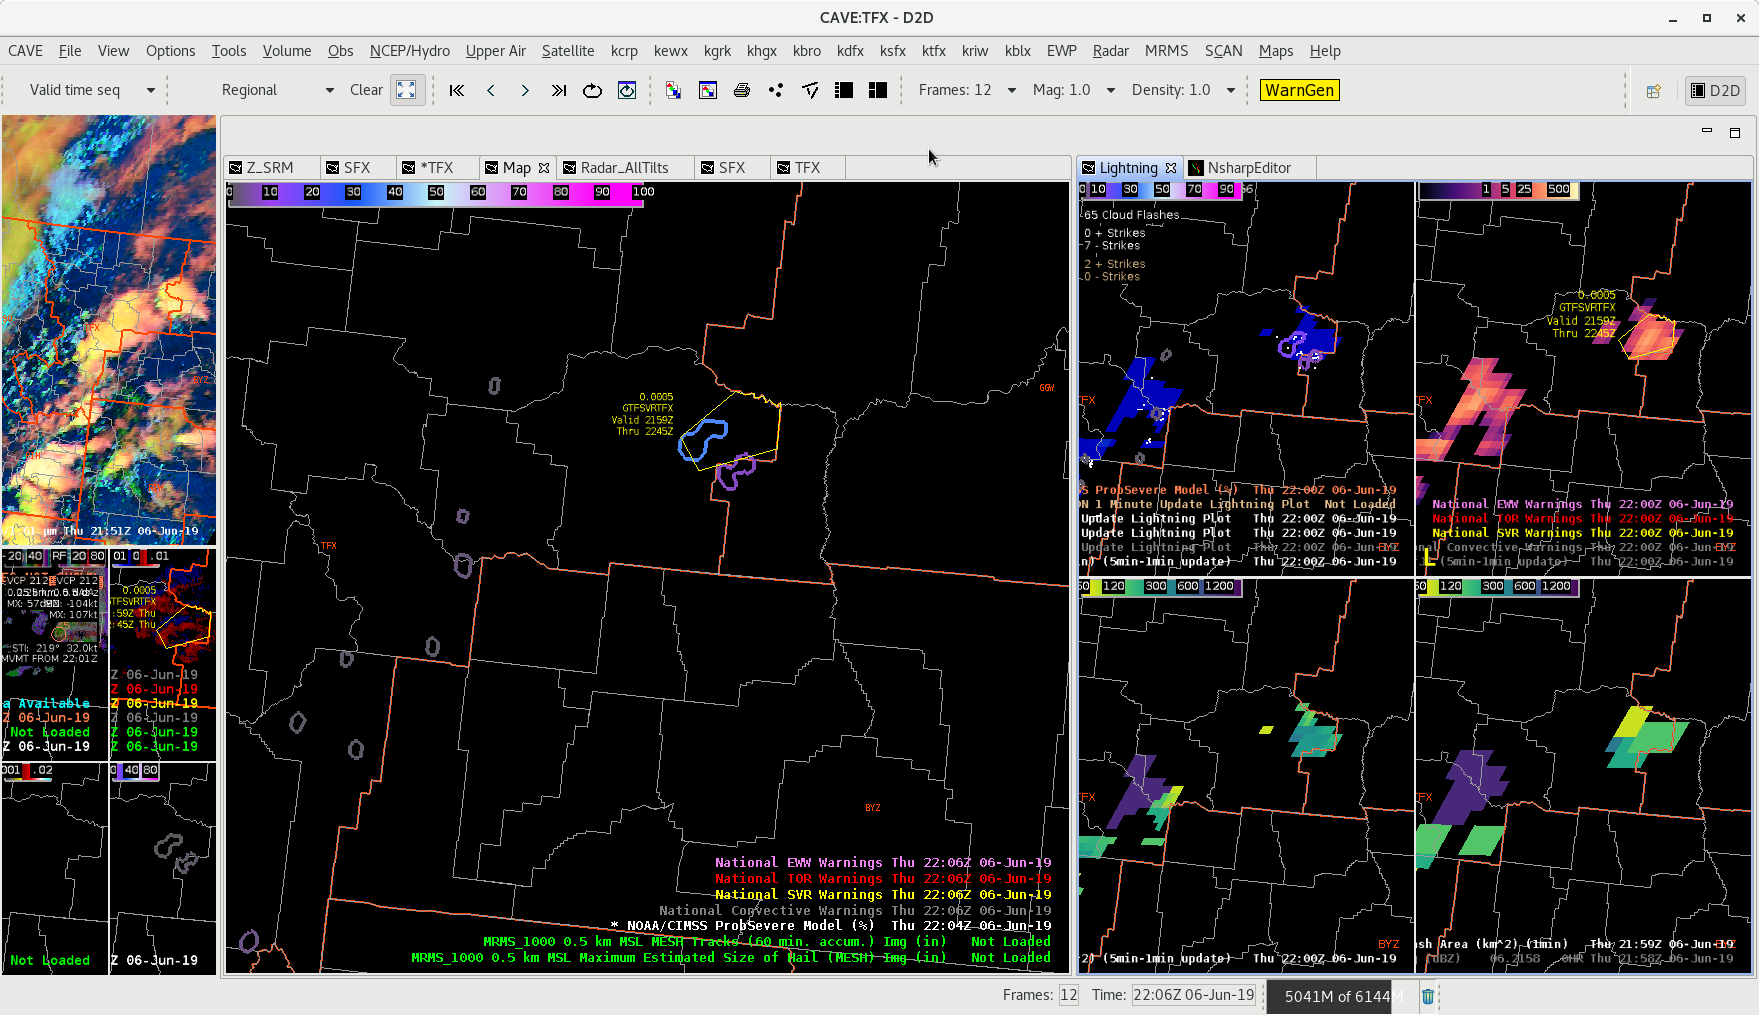
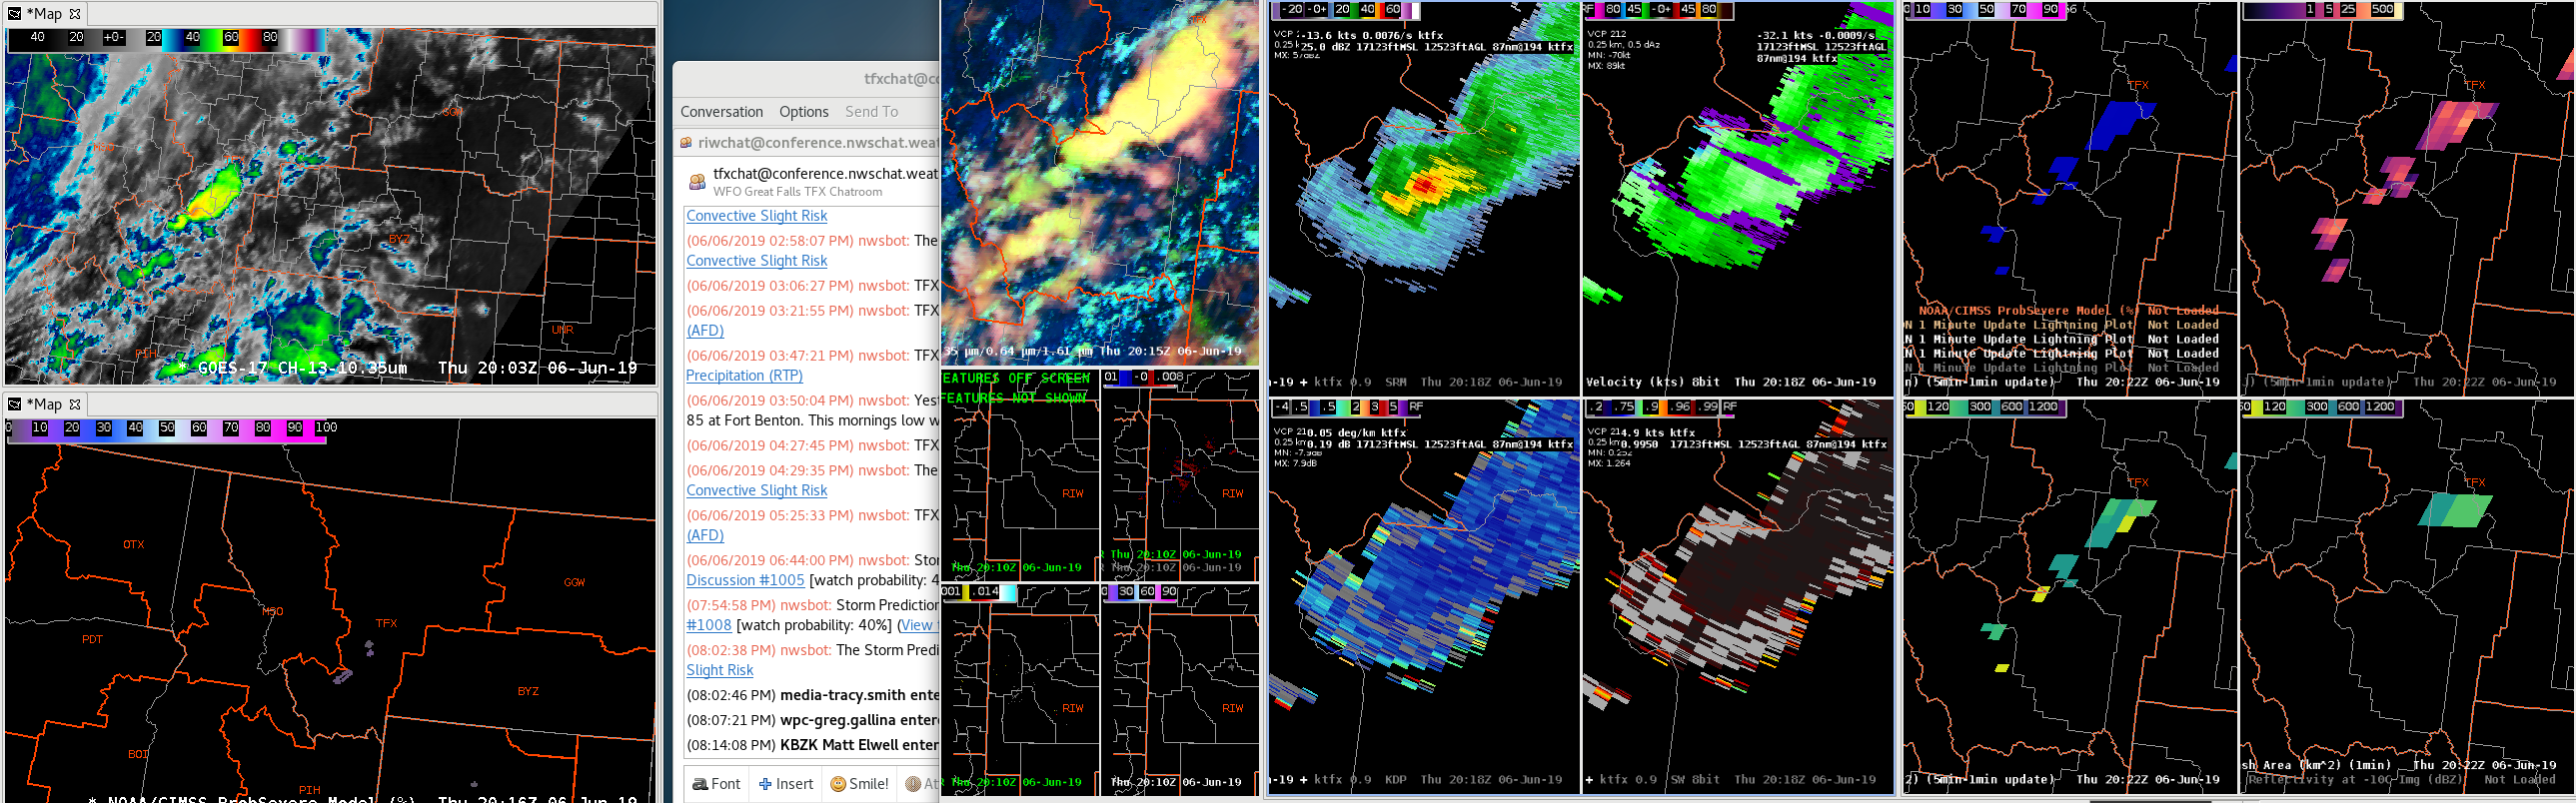
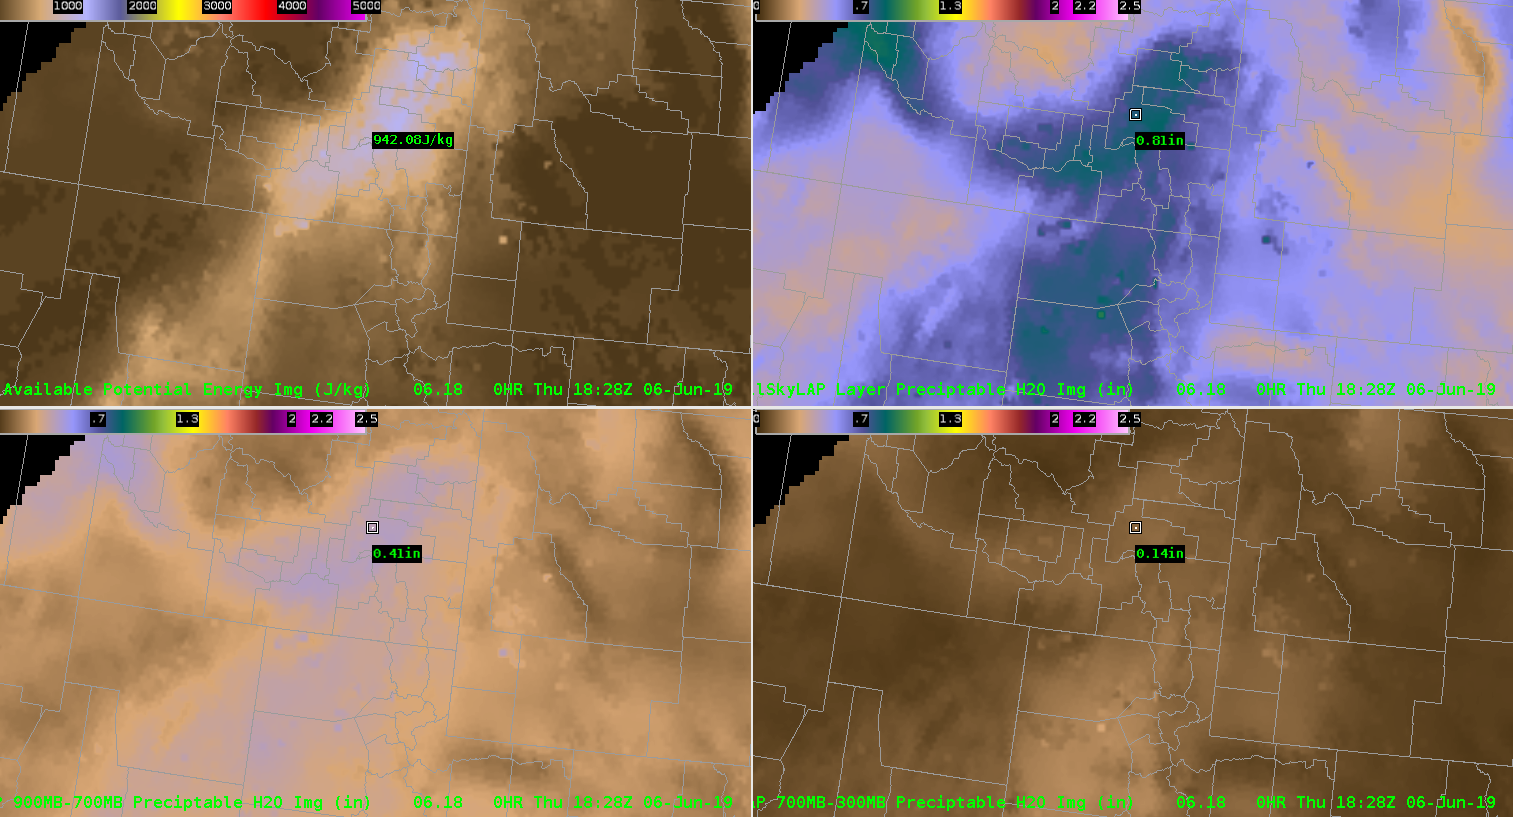
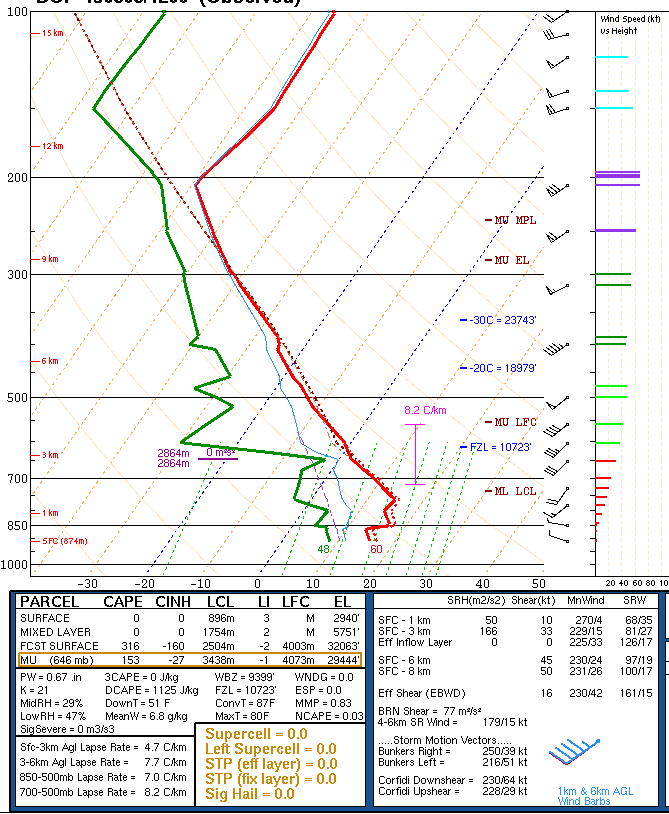
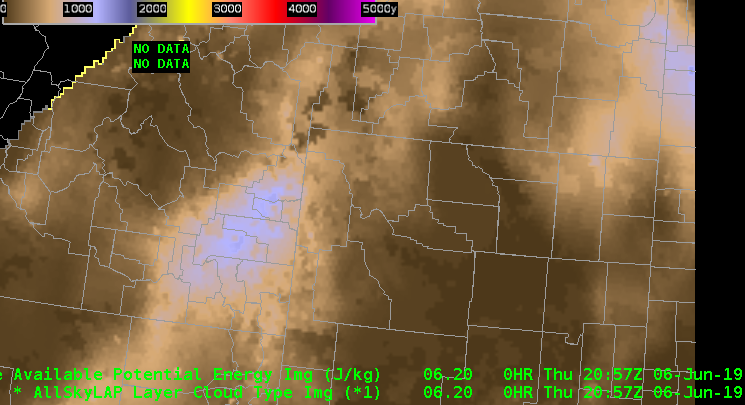
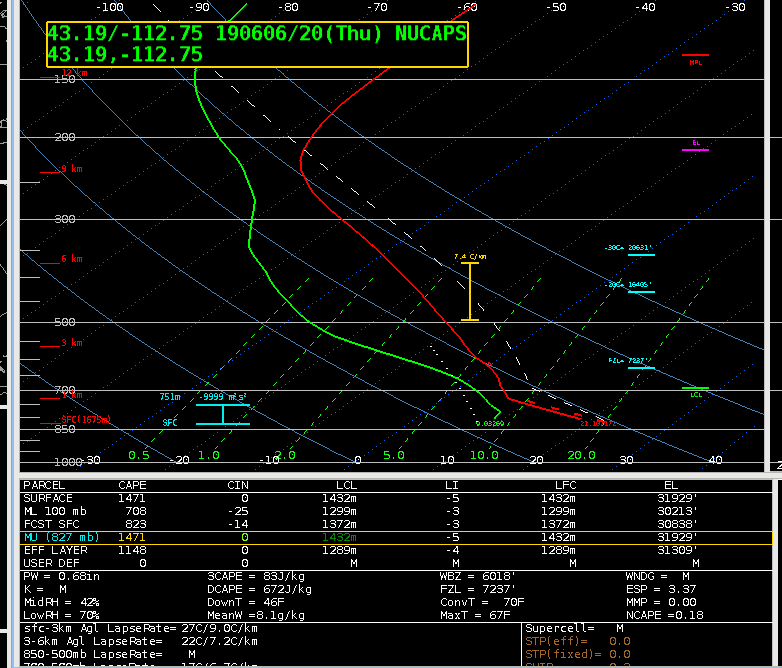
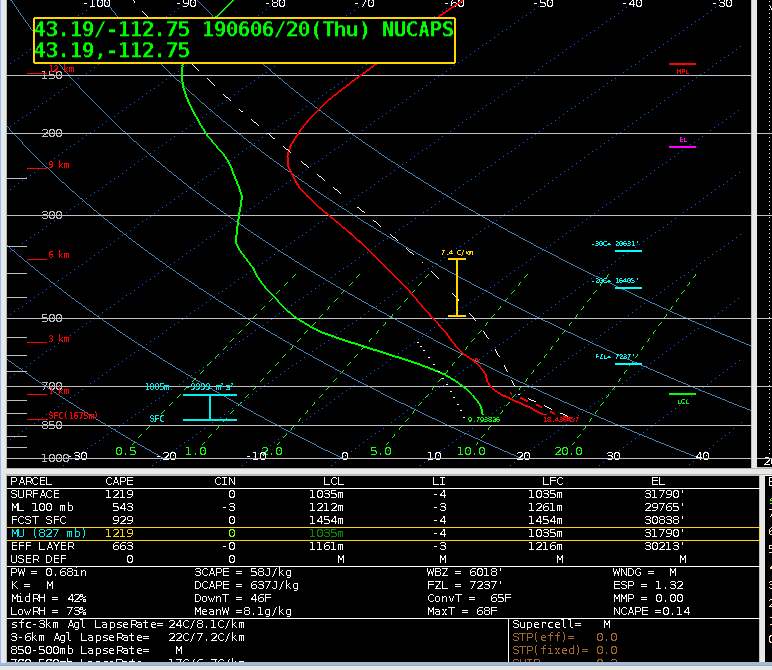
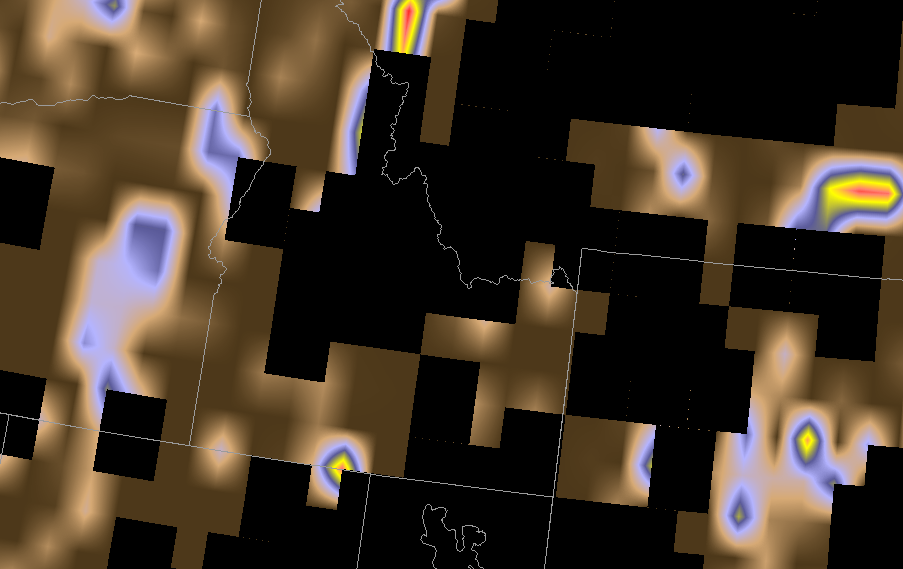
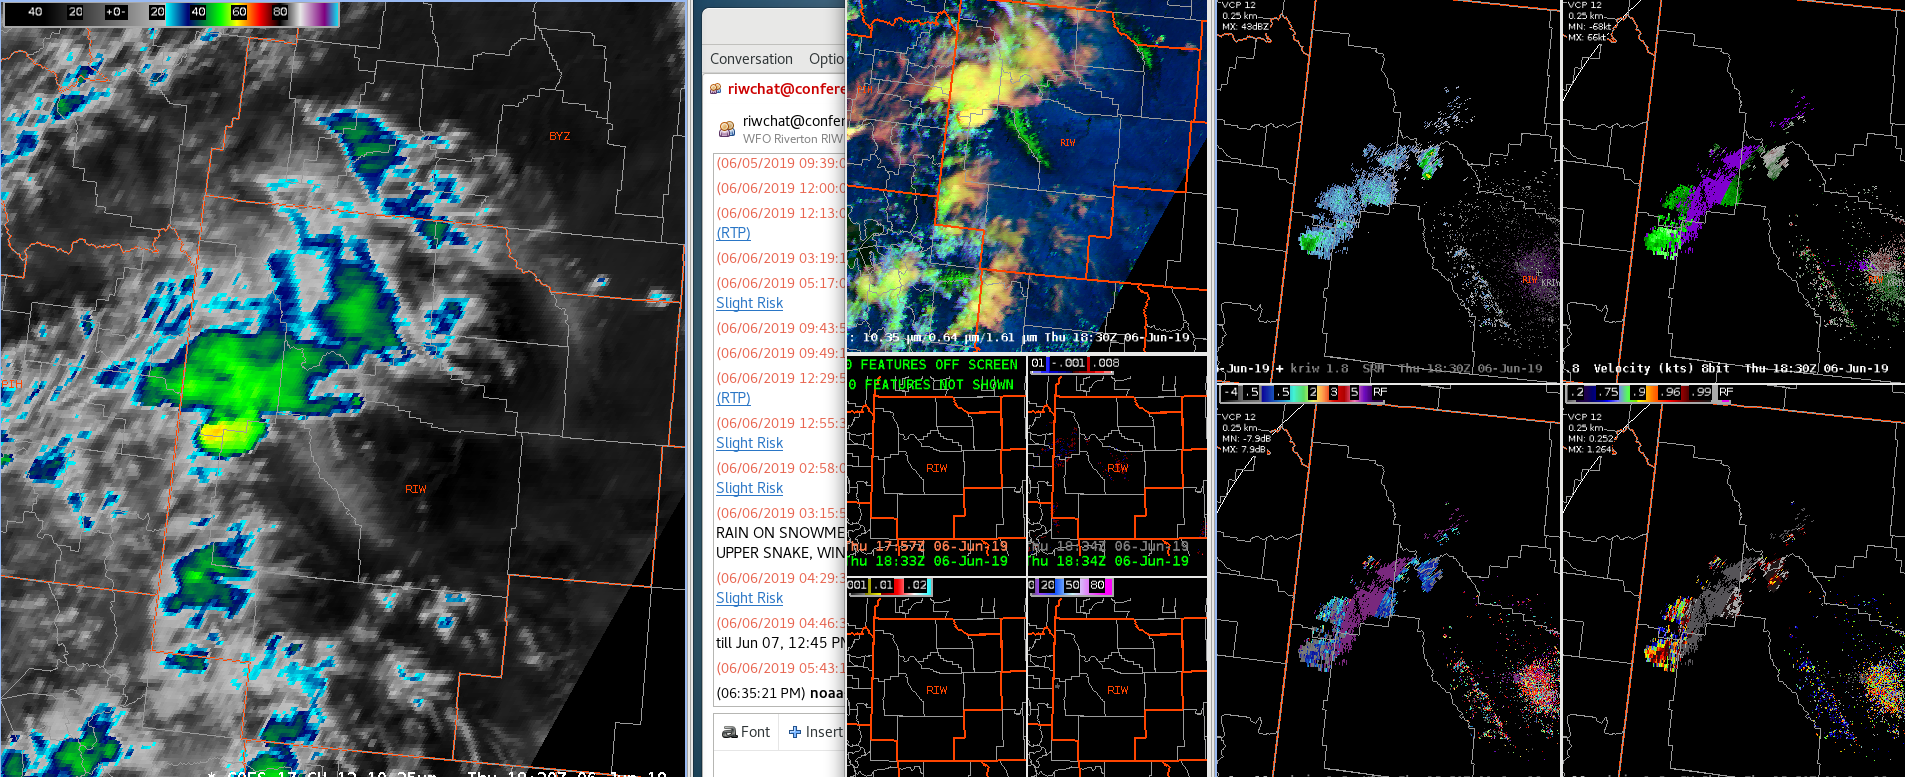
Modified NUCAPS sounding appeared to have a better handle on the environment compared to baseline NUCAPS sounding. However, it also appears it might not be totally representative of the atmosphere given the partly cloudy conditions at the time RTMA data was pulled in. The SPC mesoanalysis page suggested MLCAPE upwards of 2500 J/kg in an uncapped environment. Using the gridded mid level lapse rate product from NUCAPS we found the data to be representative. It verified well with what was shown in the NUCAPS soundings and matched with the values suggested by the SPC Meso Analysis page.
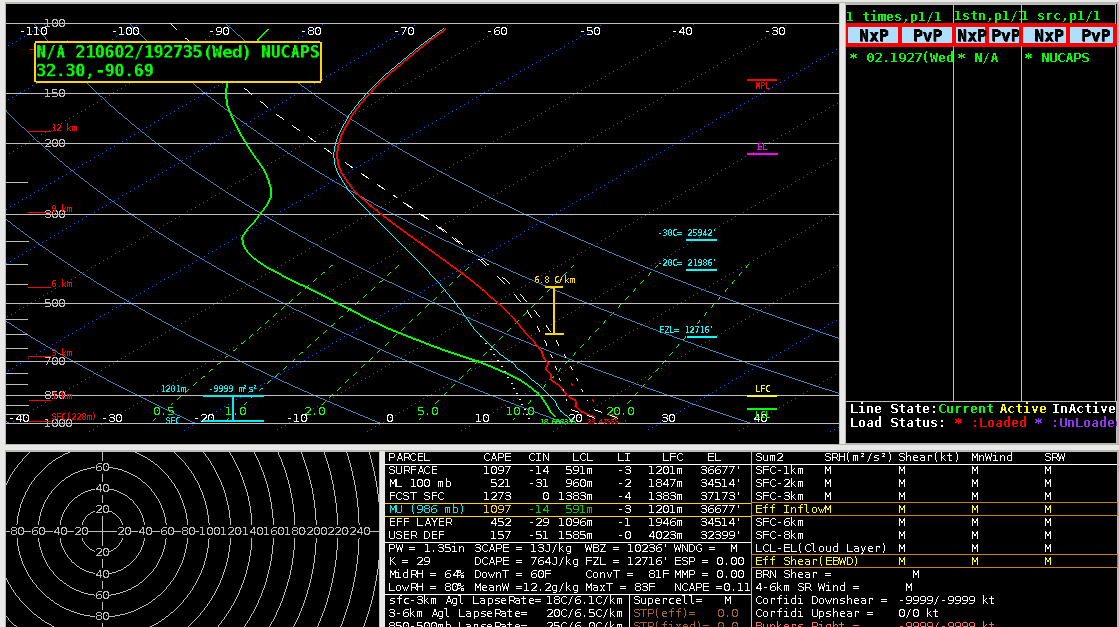

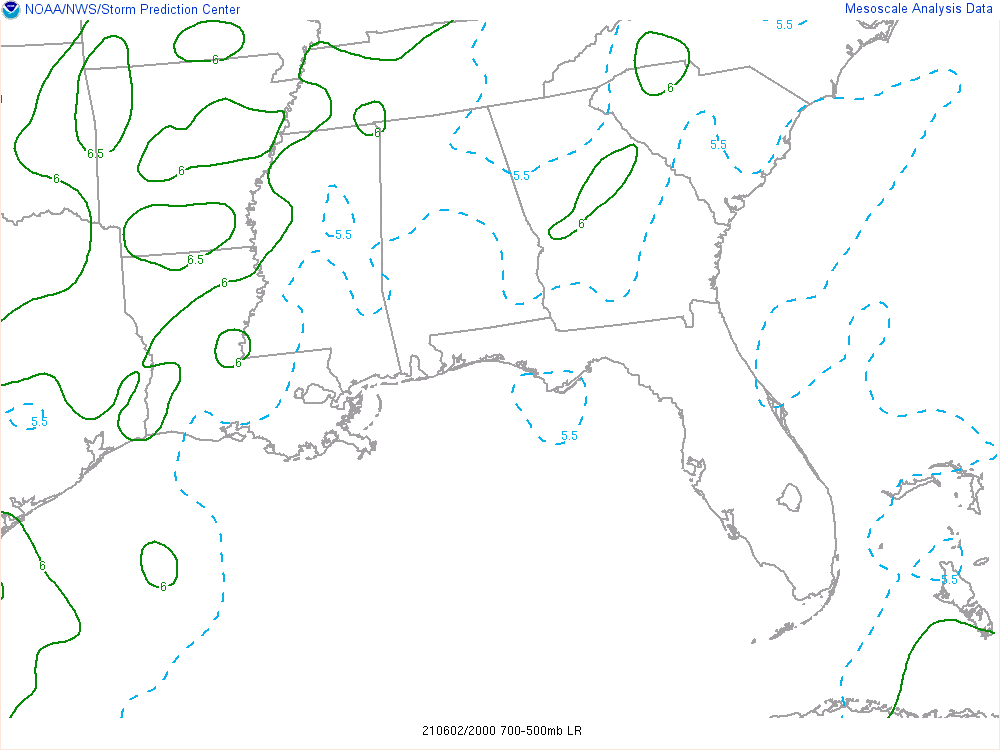
The NUCAPS mid-level lapse rates were fairly representative when compared to the SPC mesoanalysis page. This was further evidence that large hail was probably not going to be in the cards for the Jackson area today, but marginally severe wind gusts would be something to watch.

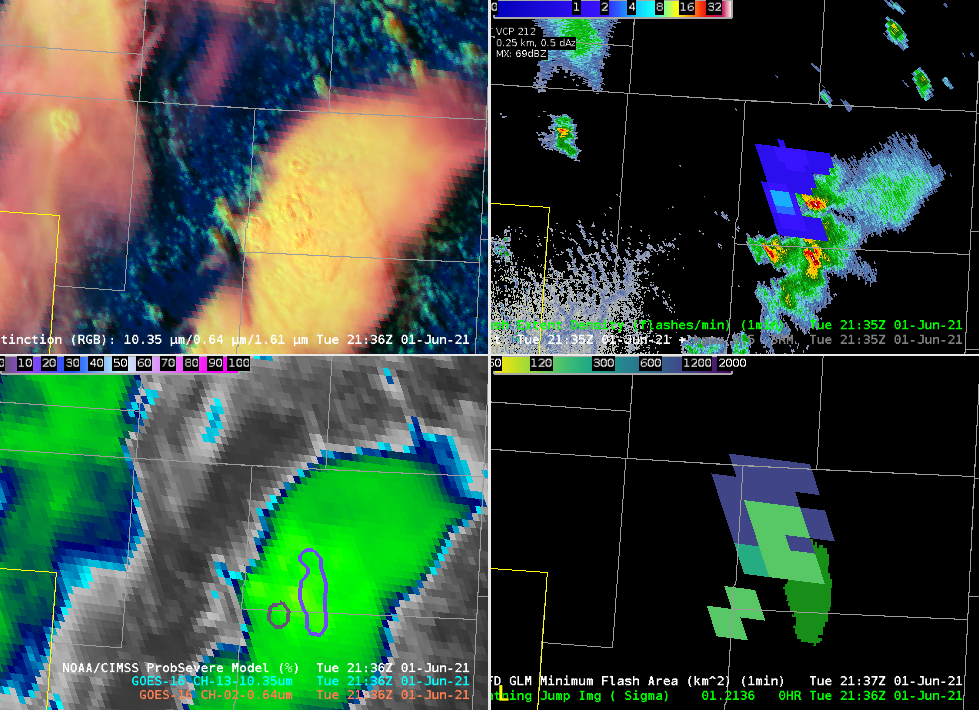
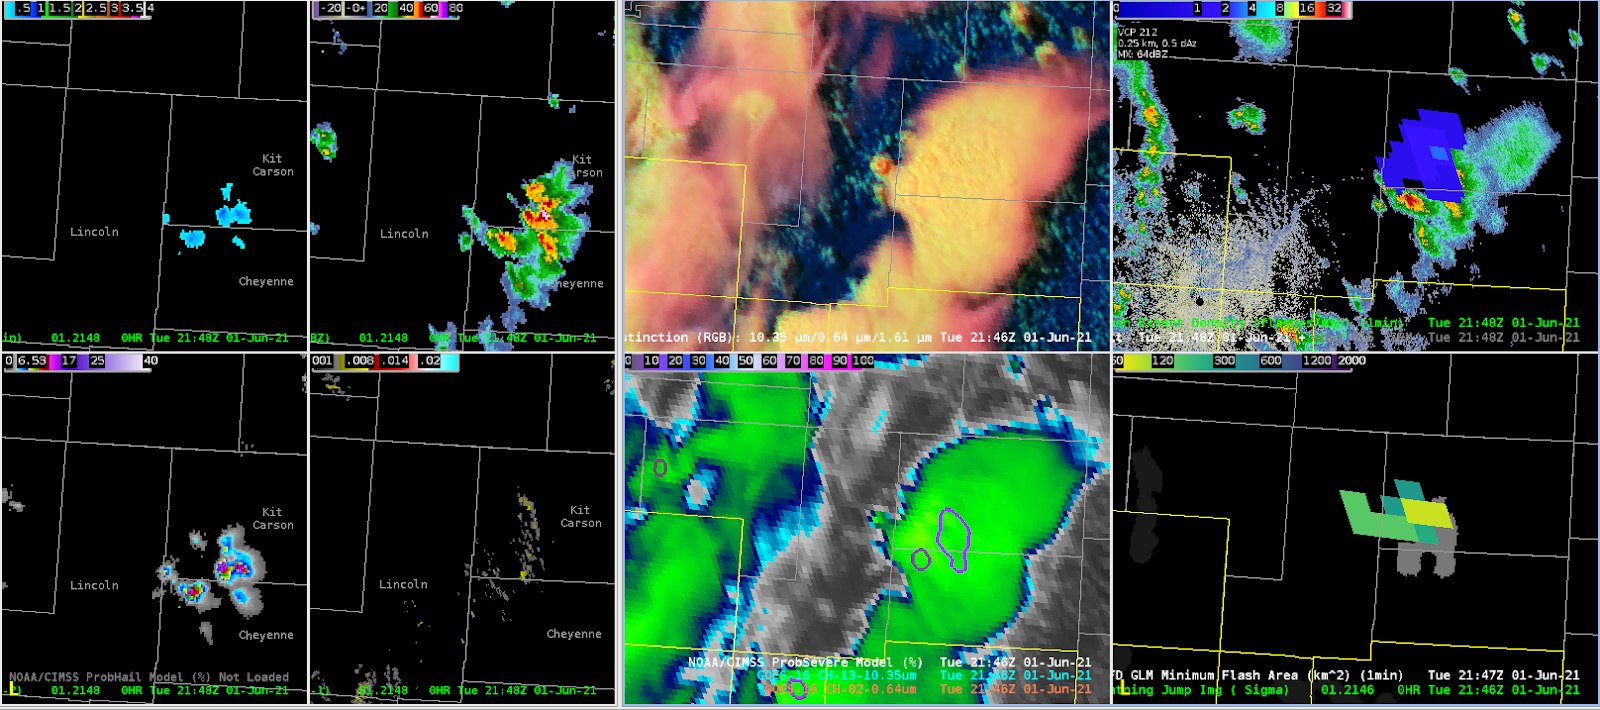
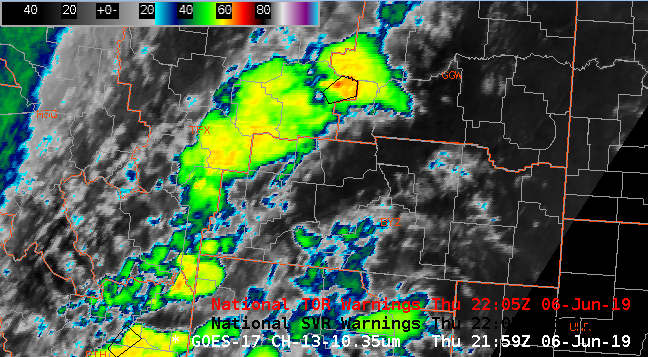
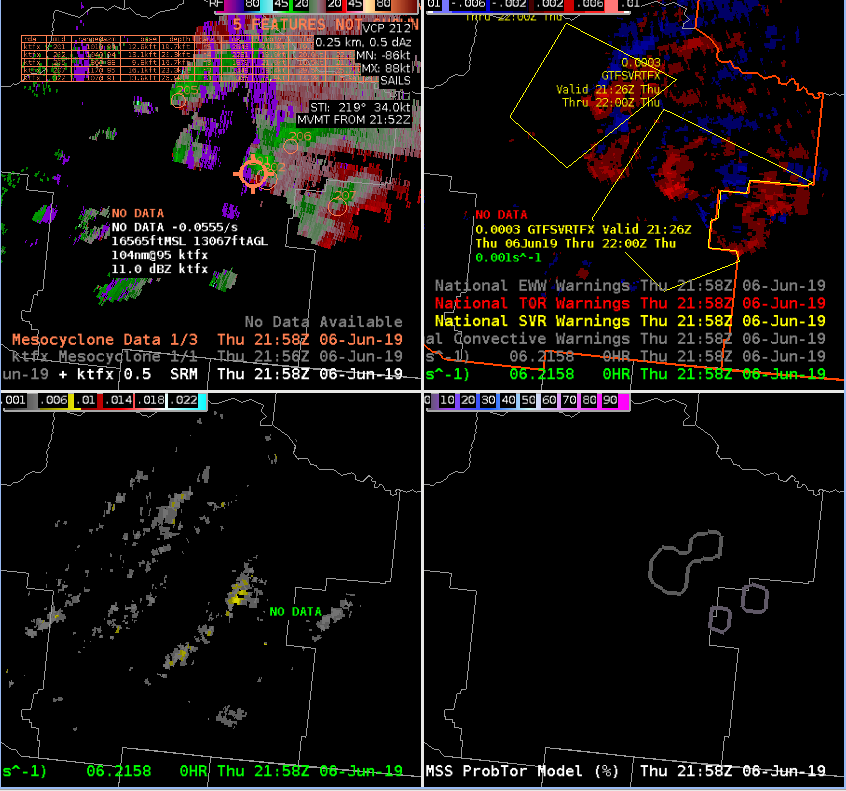
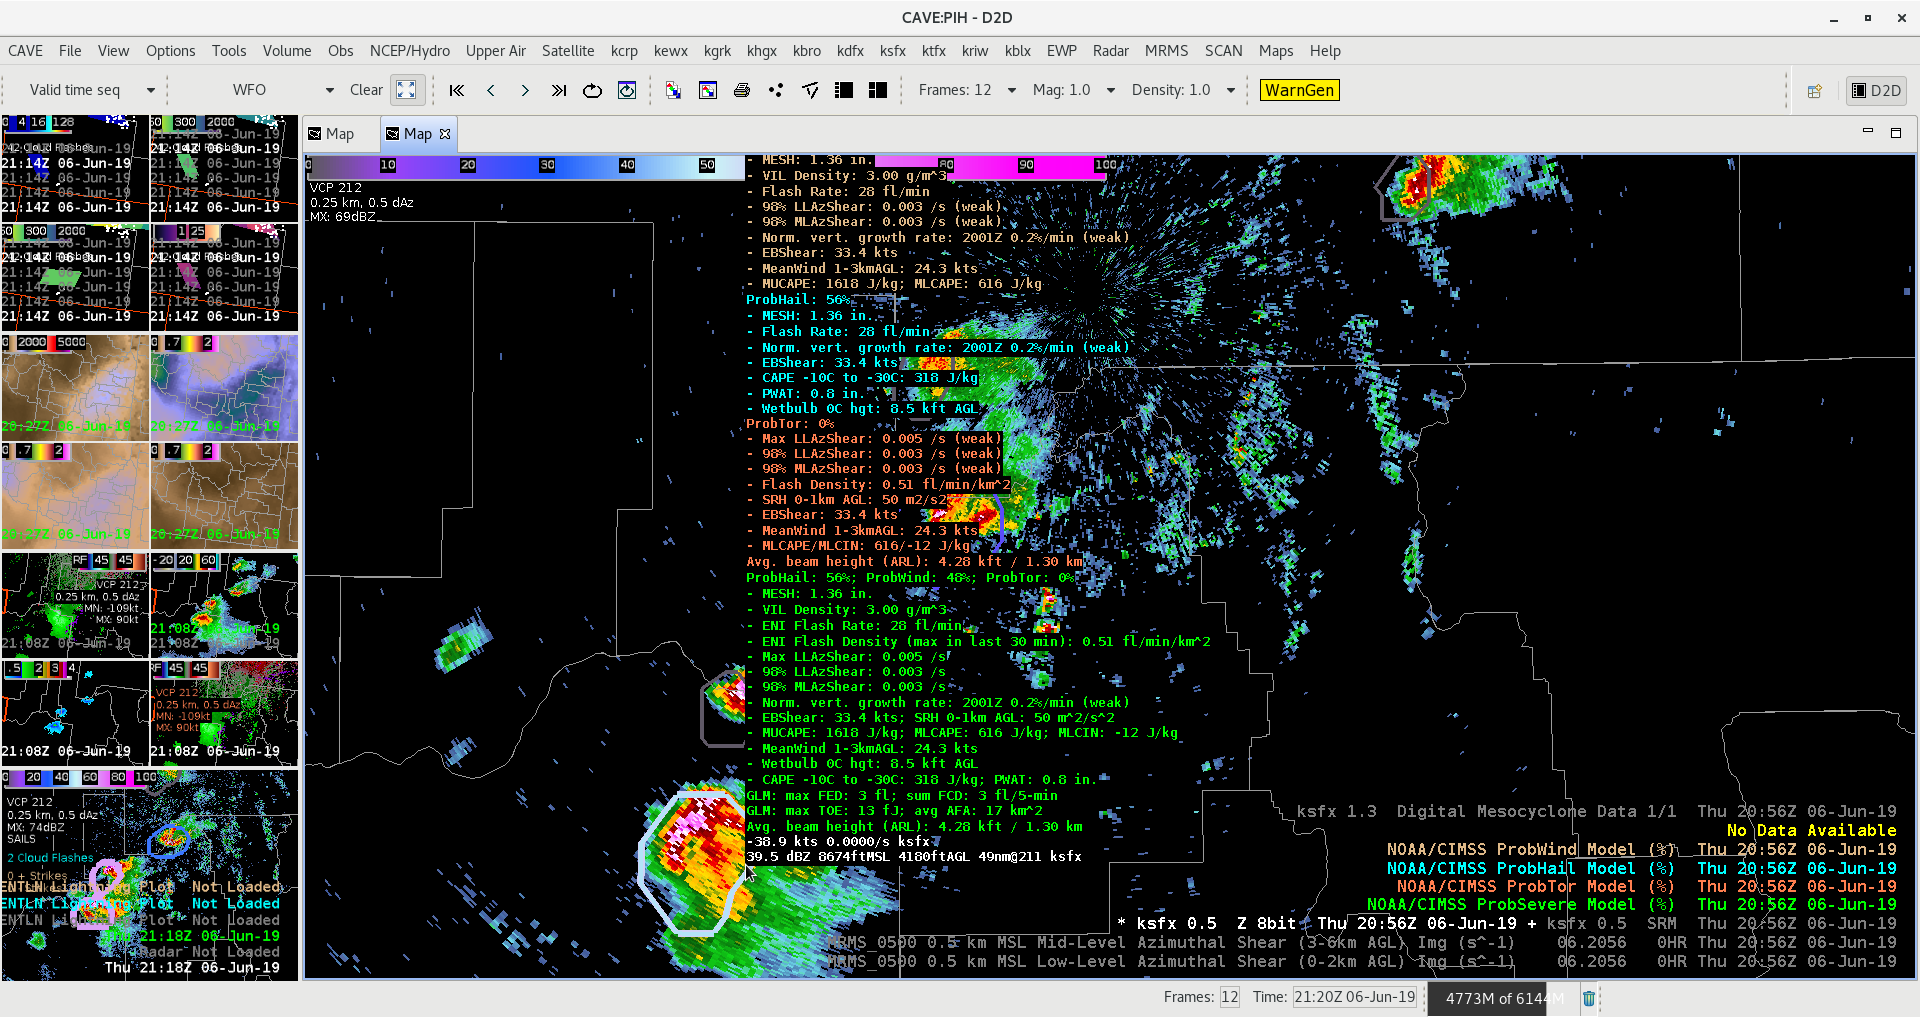
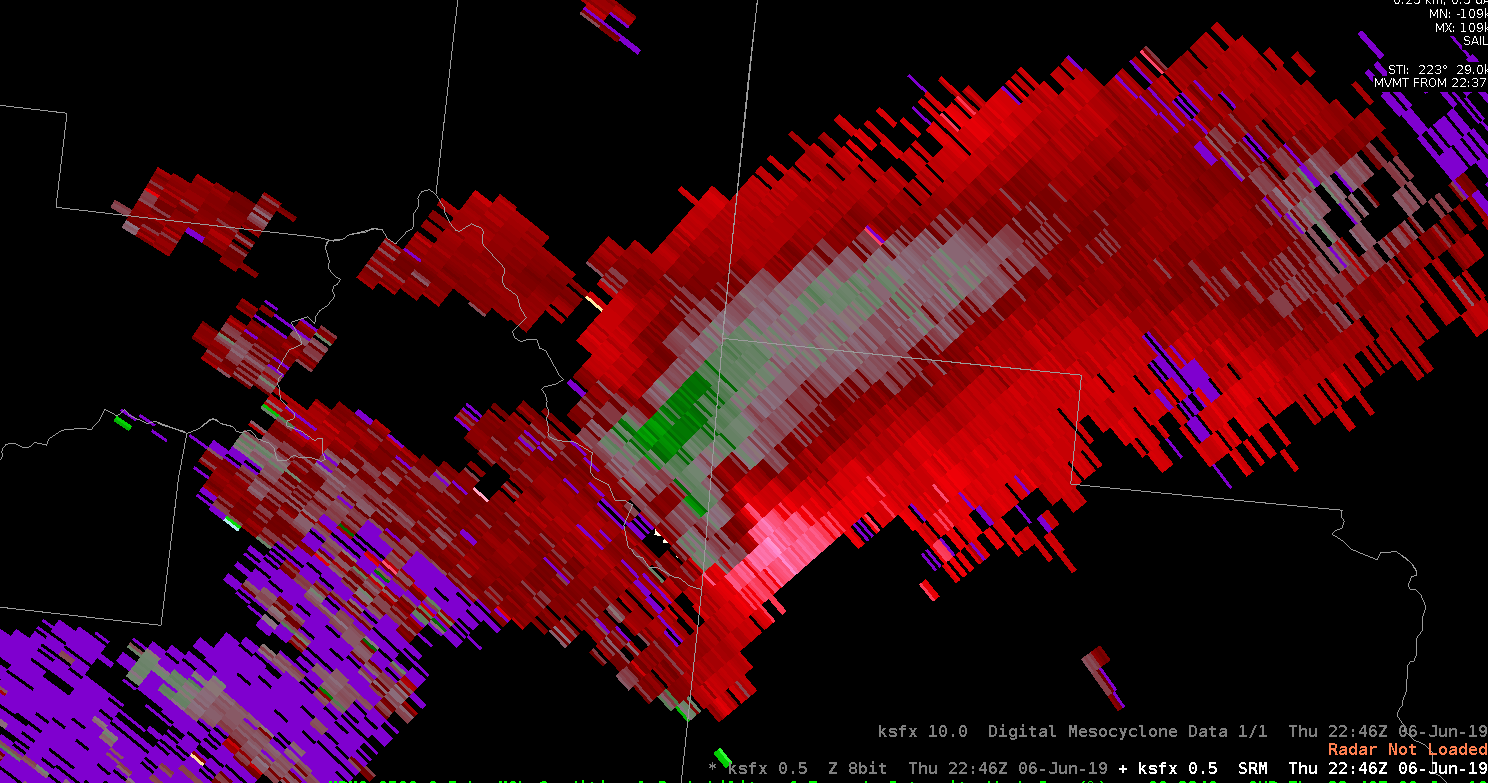
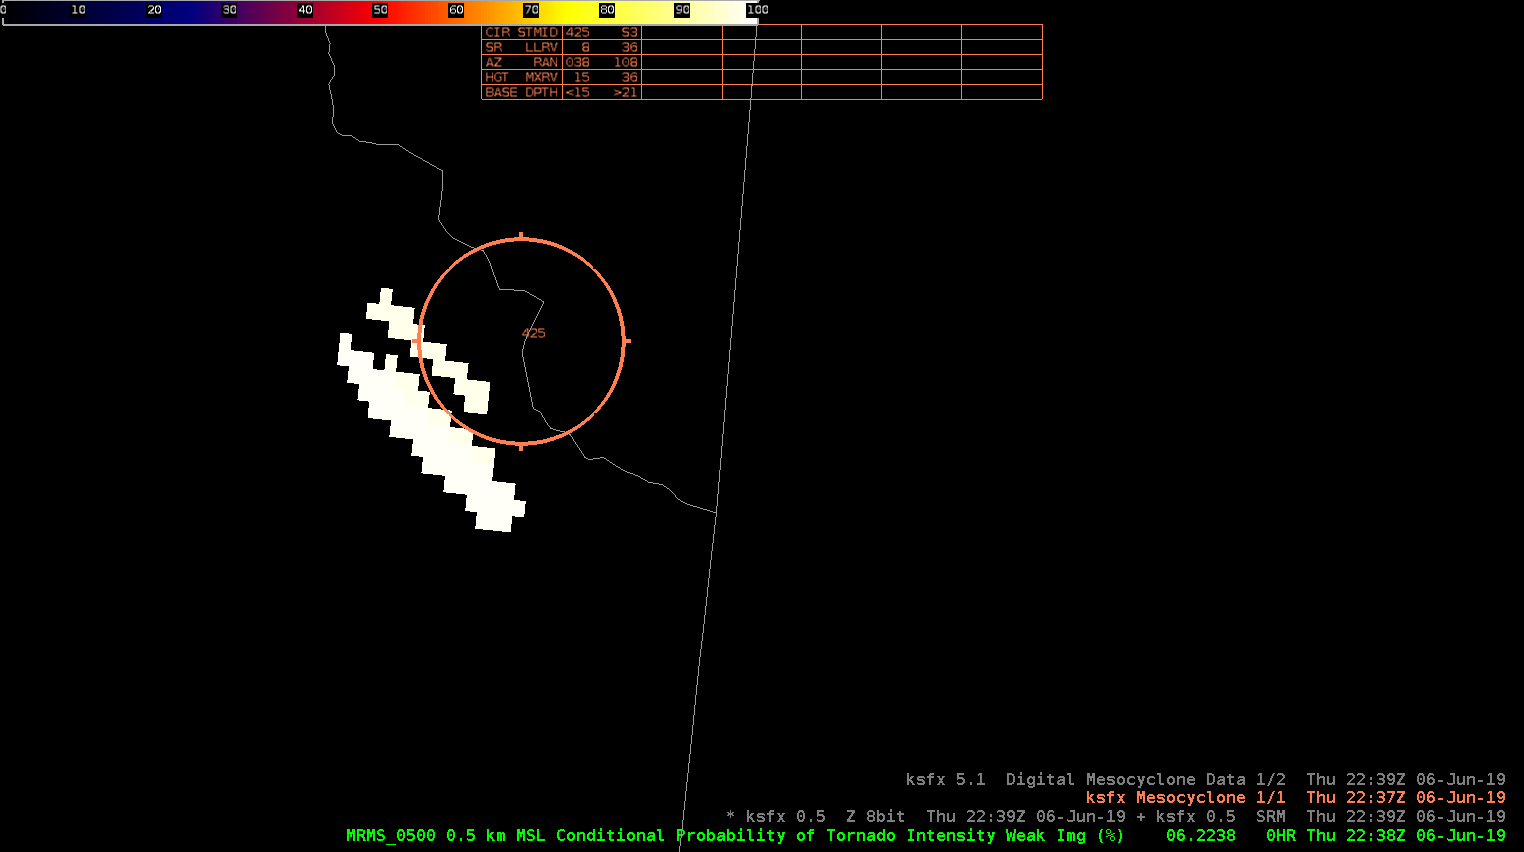
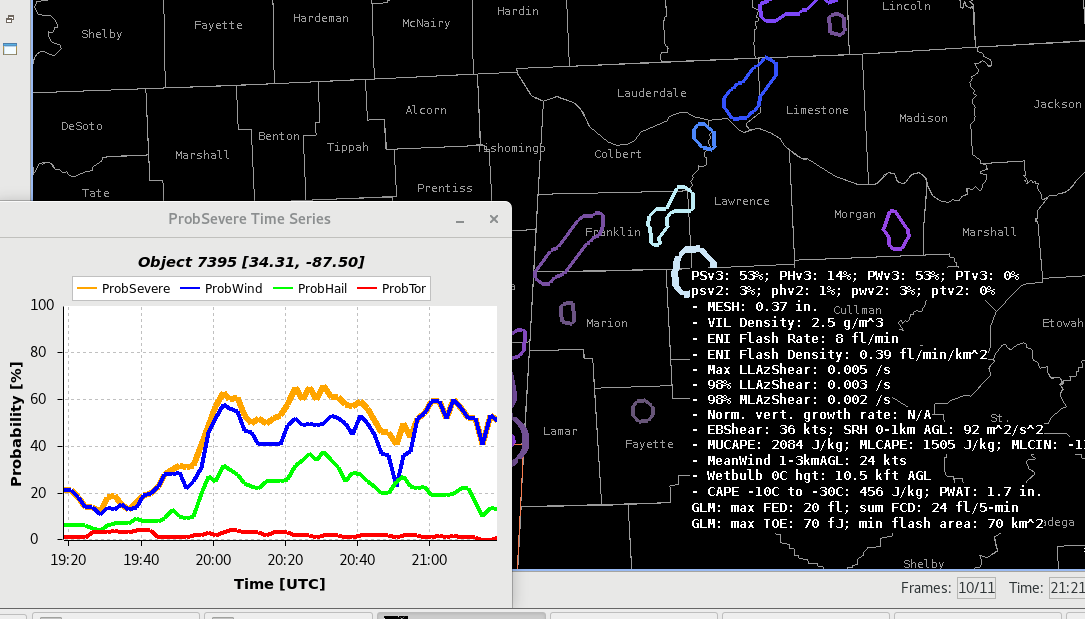
Prob Severe version 2 vs version 3, particularly in prob severe wind:
In this event, the prob severe there was a sig wx statement and severe thunderstorm warning put out by the Huntsville office. Around that time, the prob severe was increased specifically for the prob severe wind component. The version 2 had a prob severe value of 3% while the version 3 had a 53%. Version 3 better captured the significance of the storm with a 40 mph gust reported around the same time. This is significant since we were also discussing how filtering lower prob severe thresholds would be useful in decluttering the operational screen. We could have missed this event if that was the case (with version 2).
Based on this experience, we can see the vast improvement in the wind component of prob severe version 3.

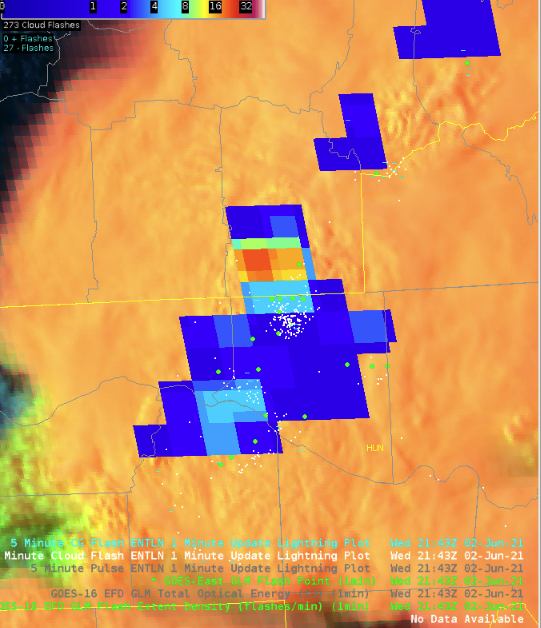
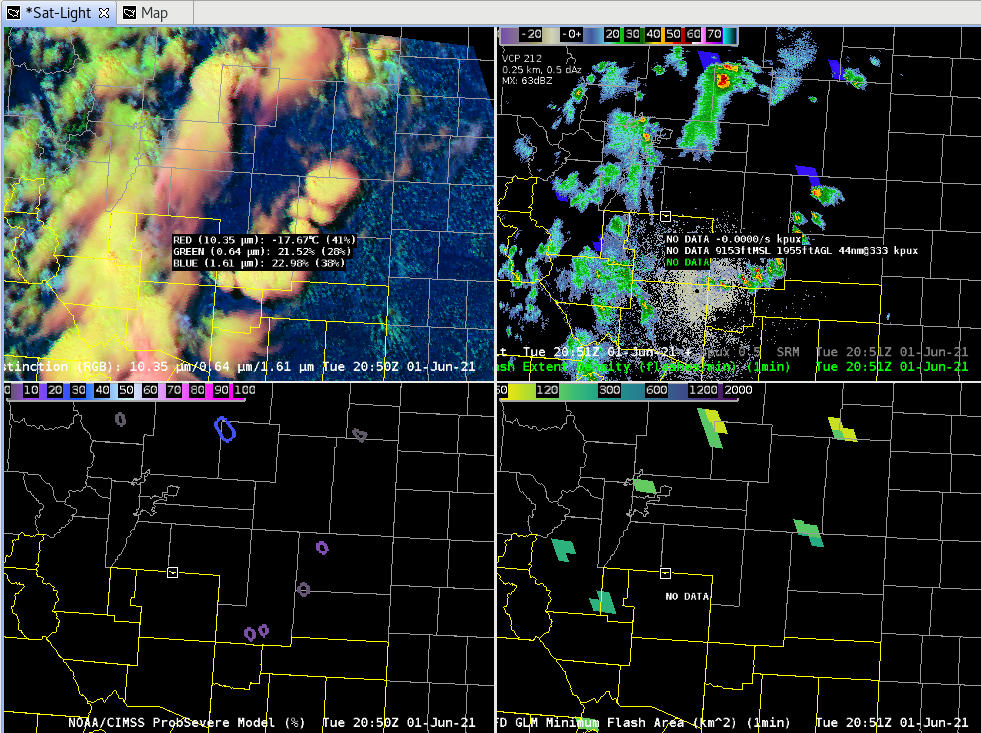
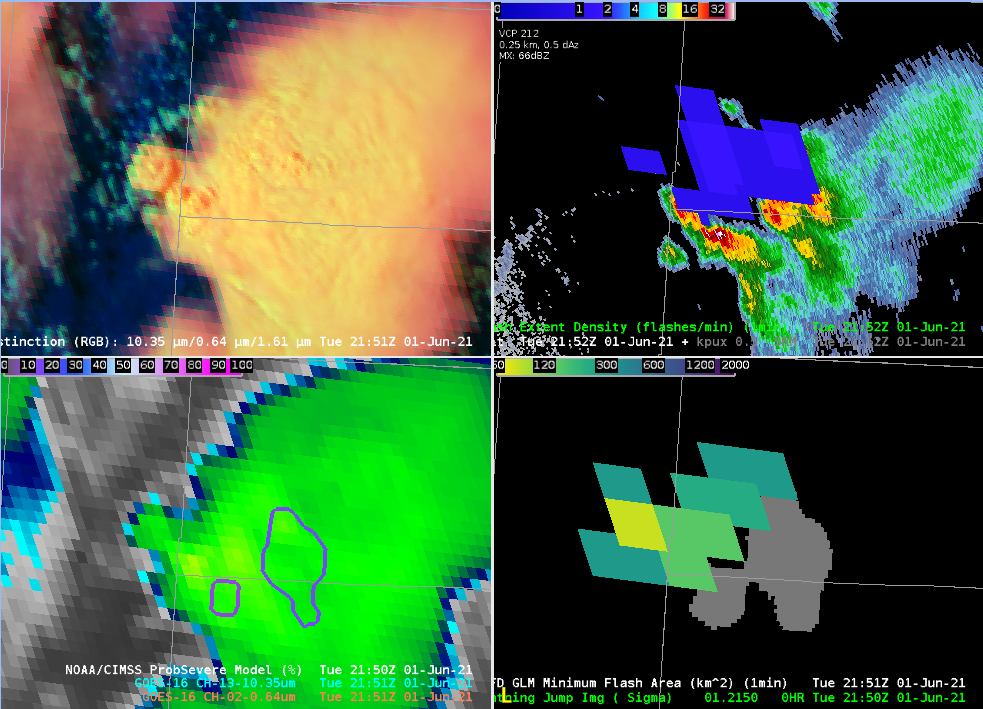
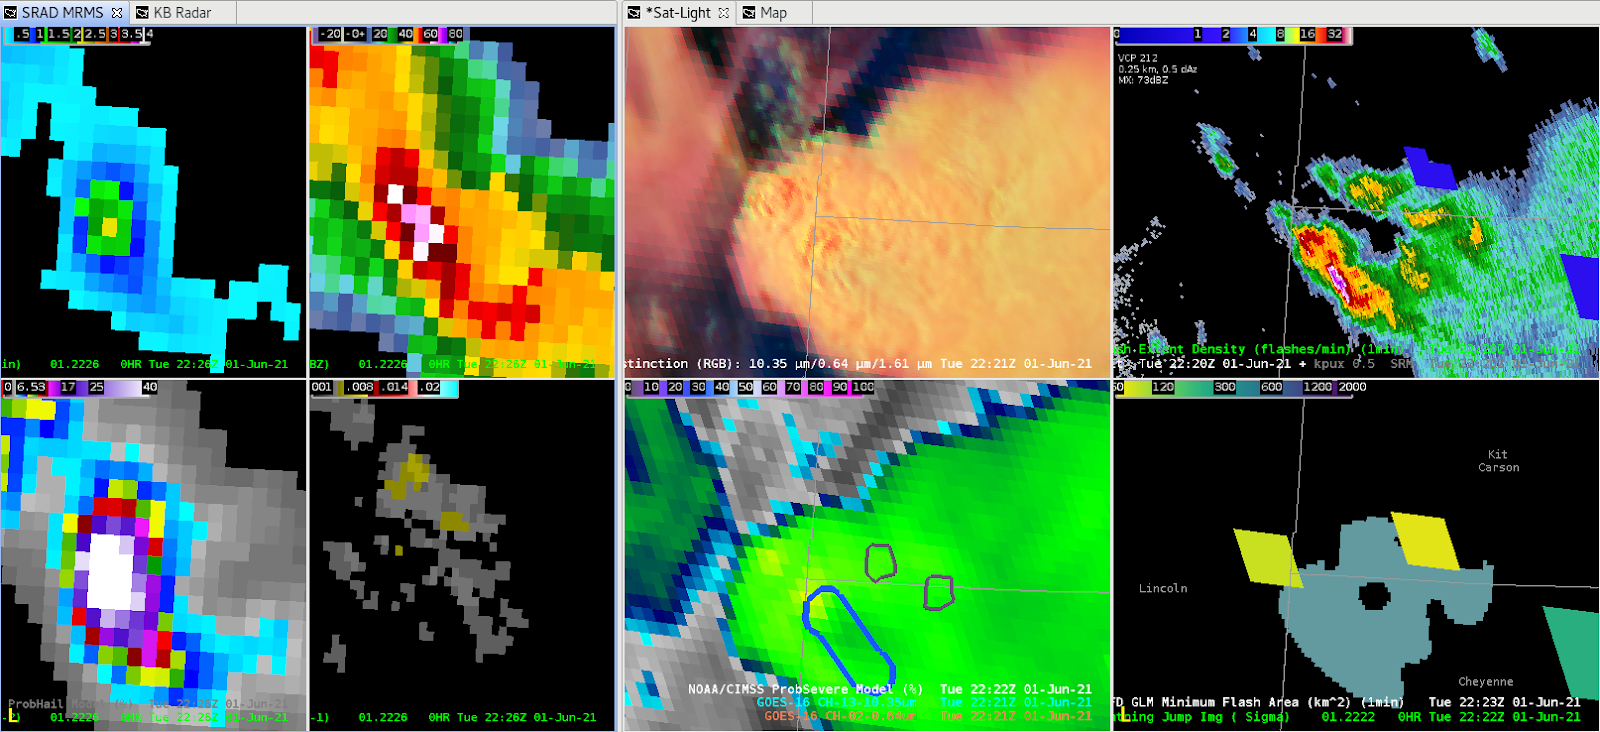
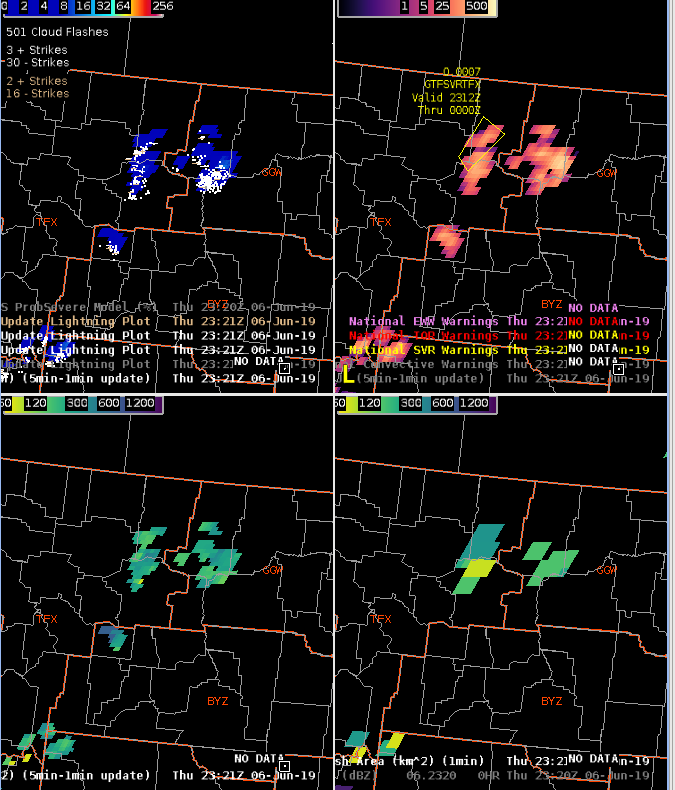
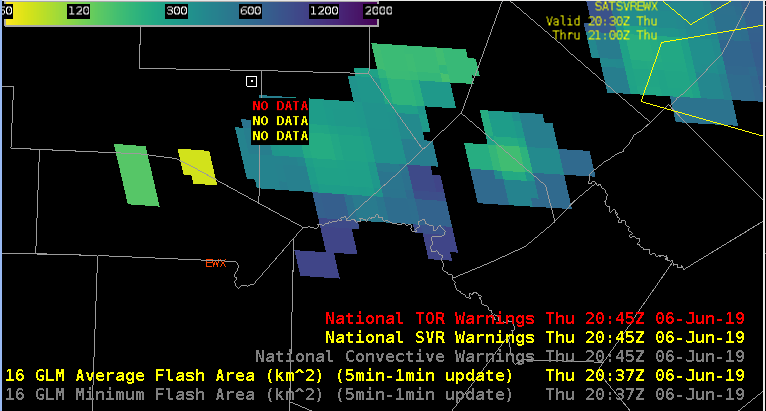
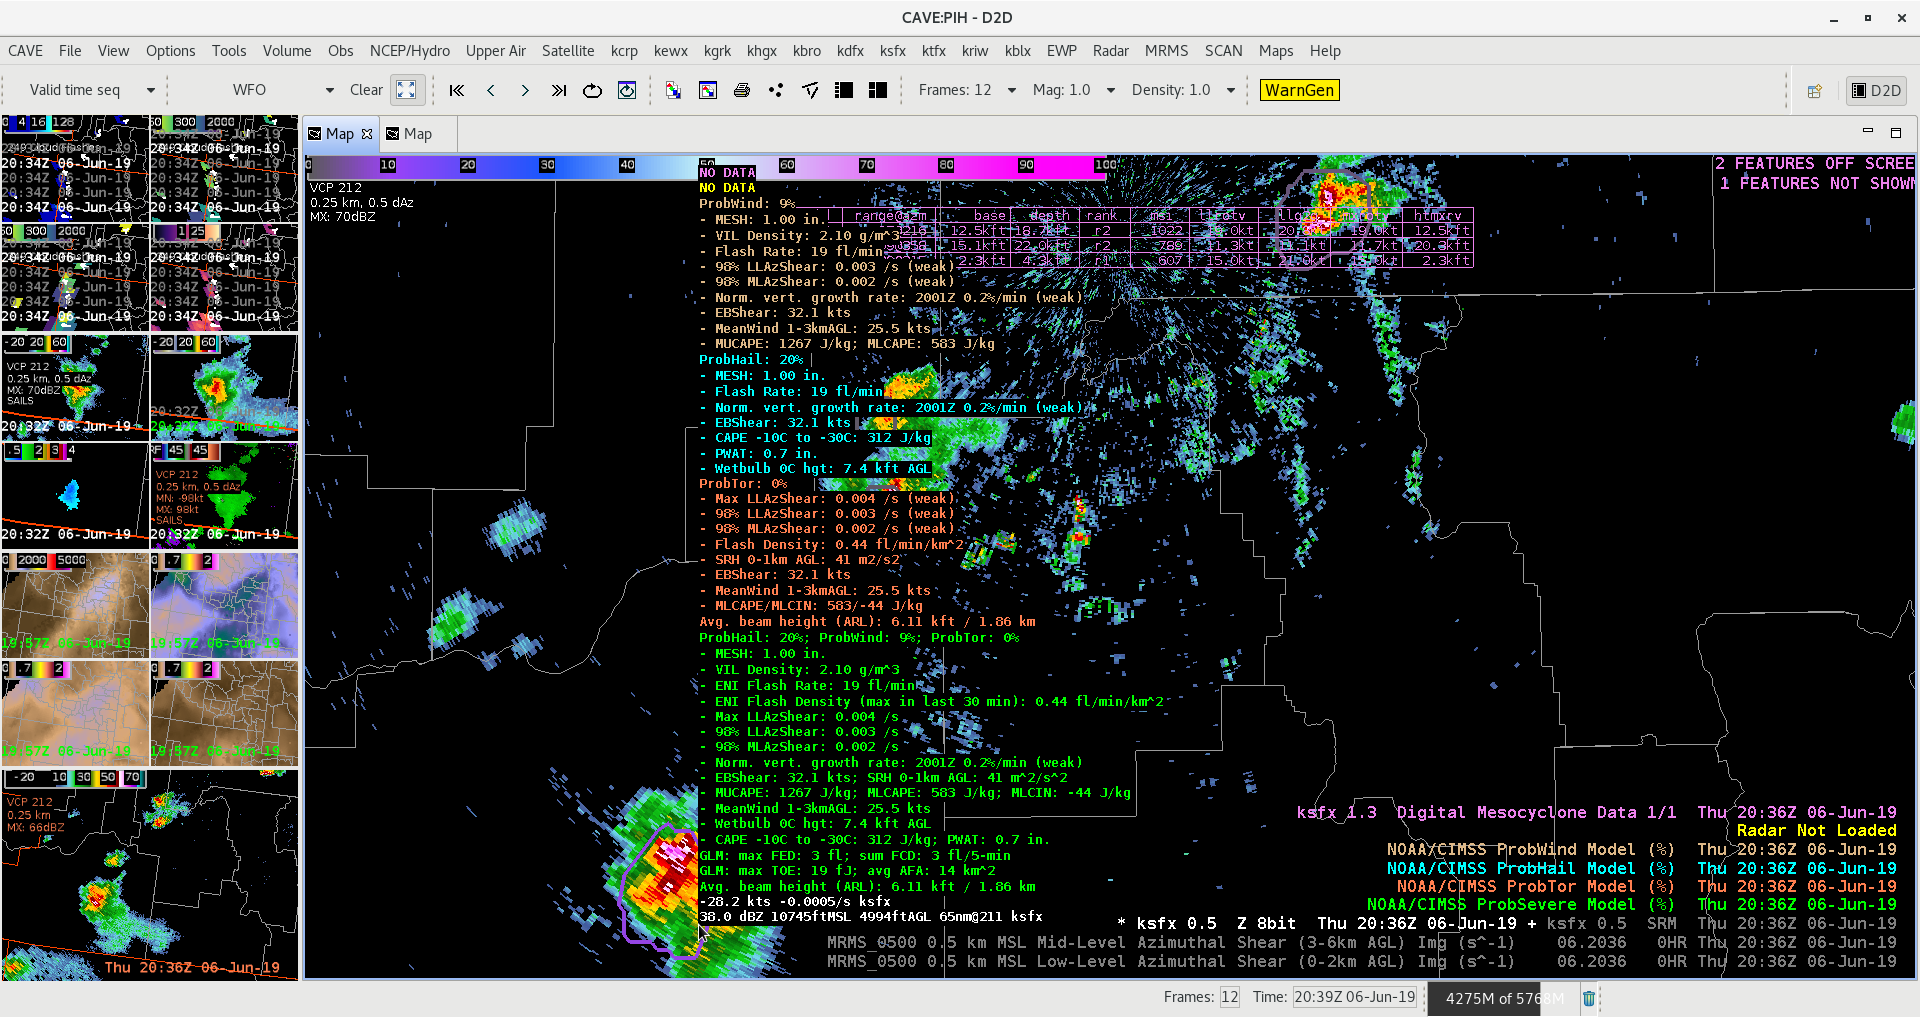
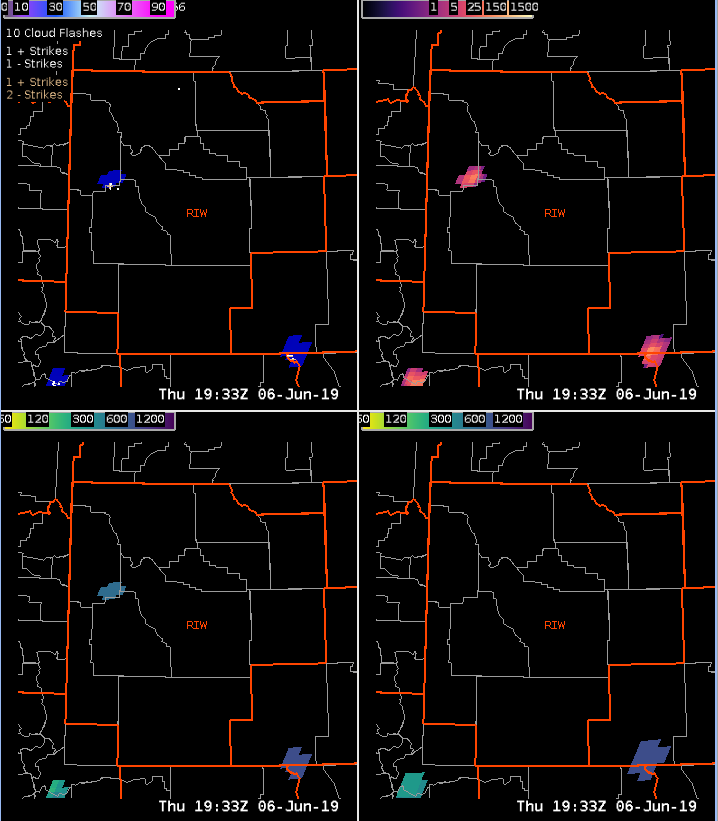
GLM Observation:
Saw a steady lightning jump depicted in the GLM FED correlated with a storm that NWS Huntsville issued a Severe Thunderstorm Warning on. Several mPING reports of wind damage (assuming sub-severe with no LSRs issued as of this time) which raises confidence that storms are intensifying. Perhaps the most interesting thing about this screenshot is seeing the parallax-correction in action when looking at the Flash Points.
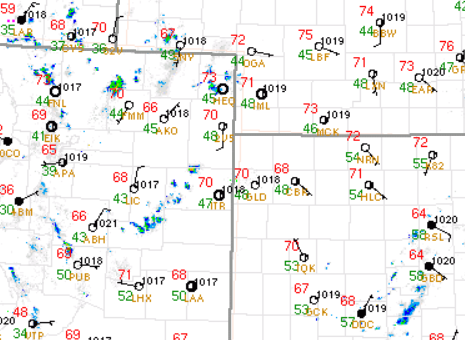
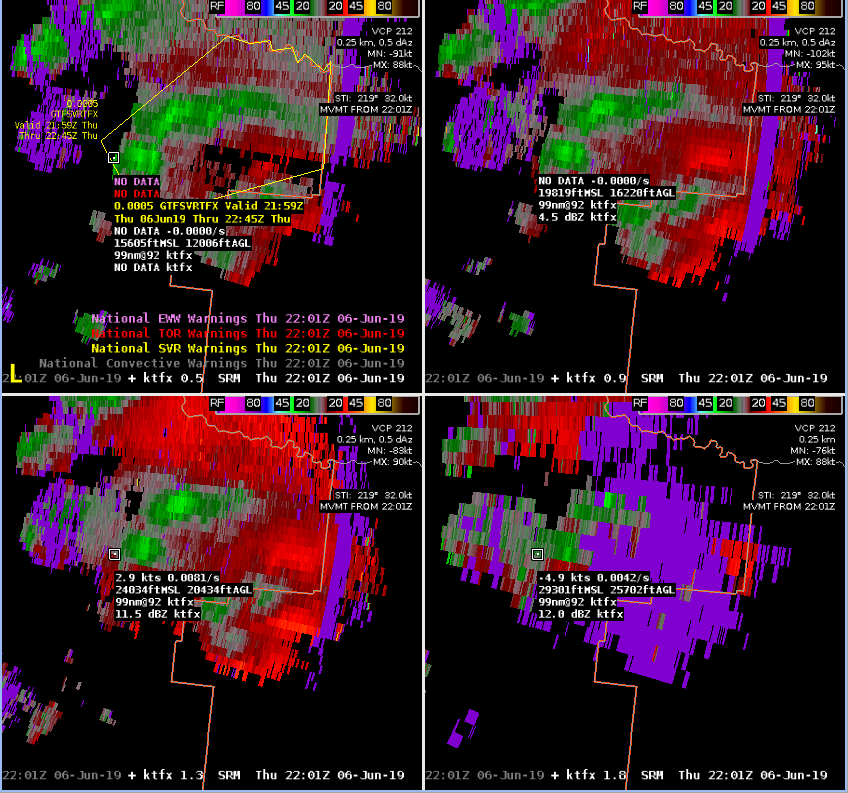
Optical Wind:
Still difficult to tell where you are geographically. Suggestions to perhaps swap the lime green grid with the state outline colors.
Additionally, the time stamp gets cut off if you zoom in on the product and occasionally gets covered by the wind barbs themselves. Perhaps a floating time stamp would be better for this instance.


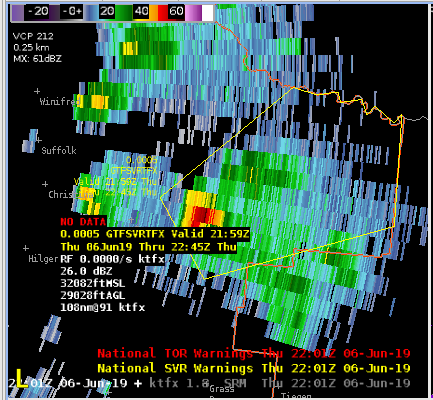
A note about the timestamps:
The time stamps attached to the wind barbs appear to be formatted incorrectly, showing times like 21.97Z, note the actual time correctly formatted shown in the image below was actually 21:58Z.

– Groot and Dwight Schrute