Environmental Analysis of ABR


Using the data provided to compare the instability between the NUCAPS, RAP and Satellite derived CAPE.  It appears that the NUCAPS and RAP are similar in their forecast values.  The NUCAPS can serve as a check of the RAP.  In this case, they look pretty good.

Tags: None

Utilizing 1 min GOES Visible Satellite Imagery

Utilizing the 1 min GOES visible satellite imagery, I was able to detect a very distinct outflow boundary extending from Stark County into Grant County. The 1 min imagery was helpful in predicting the evolution of storms. I could see the cumulus growing along the outflow boundary and see it propagating southeastward. I assumed that the convection would continue to develop and be focused in the area where the outflow boundary was merging with the southern extent of the storm in Morton County.

VIS1min

(Click on the image to see animation)

-Helen Hunt

Tags: None

Overshooting top in SRSO, no algorithm trigger, parallax error

SRSO vis channel showed an overshooting top (Fig 1: Gif Loop) in McLean Co, but the overshooting top detection algorithm did not make a detection on this feature. This was useful information in that it showed it wasn’t vigorous enough to actually be quantified as strong enough to be detected.  Also noticeable was the 1 minute lightning was displaced south of the overshooting top feature, but aligned with the radar echo. After discussion with Chris S. the displacement seems to be a result of parallax error.  –Cattywampus

parallax

Tags: None

CI Probability Along Outflow Boundary

The CI probability product keyed in on some convective development along an outflow boundary from a storm moving southeastward across Morton County. It went from 43% at 2145Z over northern Grant County to 68% at 2200Z. Comparing the product to radar reflectivity, there were dBZ values over 50 just east of Heart Butte Dam at 2151Z and the cell continued to intensify for the next few scans.

I think that this data would be more useful during warning operations if it was available every 5 minutes versus every 15.

CIprobability(Click image to see animation)

Reflectivity

(Click image to see animation)

-Helen Hunt

Tags: None

June 2 — Flash Density Color Curve Comparison (CYS)

There has been some question as to the utility of the current default Flash Density color curve or developing different color curves to help forecasters pick out the highest flash densities.

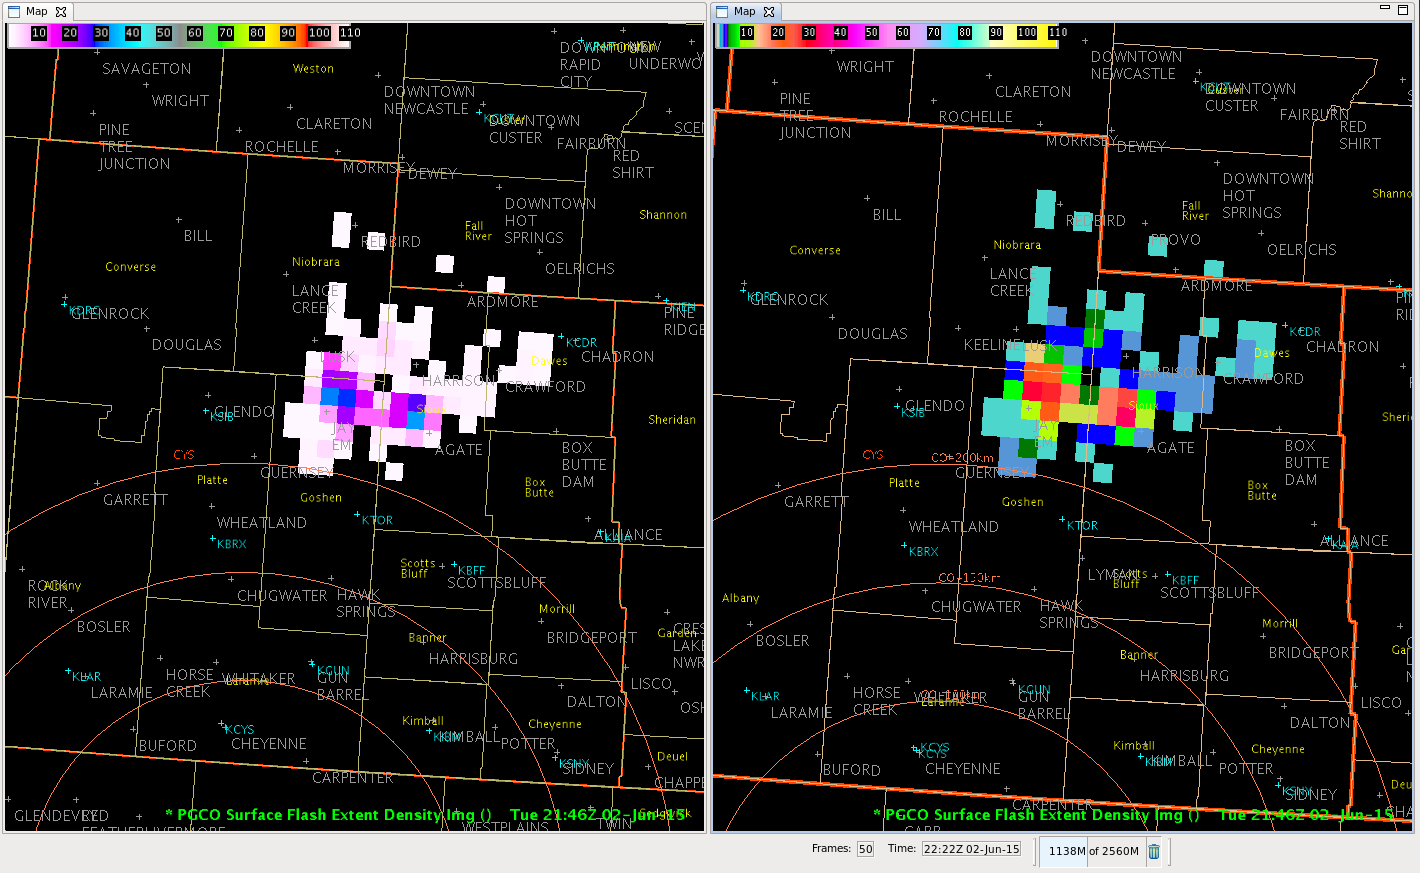
Here is an example of high flash densities we saw this afternoon (2146 UTC) in the CYS CWA, looking at the default color curve and one of the possible options:

FlashDensity_Color_Curve_Comparison


The image on the left is the default color curve, with the right image one of the options. The problem with the right image is the use of blue/green shades and red/orange shades for those that are colorblind.  Those colors can cause problems in figuring out the highest flash rates without use of the sampling tool.  Being a non-colorblind person, I prefer the right image as I was able to pinpoint the highest rates quickly.  It is still a good idea to use the sampling tool with both color curves to ensure finding the highest rates.

CoonieCatEye


Tags: None

CI-East: Success and Failure all in one.

This is a case where I found CI to be helpful in helping focus attention where there was nothing on radar but it was showing potential for convective development. Fig 1 shows a swath of about 23% over Kidder Co and about 33% over Burleigh Co to the West at 21:15z.  About a hour later at 22:22z (Fig 2), we saw development on radar over Kidder Co but nothing over Burleigh which had the higher probability.  This was helpful in this case because I was not anticipating development in this area, but the CI helped grab my attention to watch this area. –Cattywampus. CI_2115ZFig 1: CI-East over Burleigh and Kidder Co

2217z
Fig 2: Convective development over Kidder at 22:22z.

Tags: None

Rapid Flash Rate Changes, Cell algorithm mergers.

Just a case when lightning rate plot shows large fluctuations (fig 1) but seems to be of little use due the fact that data may not be necessarily showing updraft intensification and area broadening, but mainly a result of cells merging together.  Initially ENI, identifies a rapid jump as the two identified cells are merged into 1, then a quick drop as the cells separate back into two different cells, than another jump as they merge back together (Fig 2 – gif loop).  –CattywampusENI_Flash Rate2142

Fig 1: Flash Rate Jumps

merger

Fig 2: Cell mergers

Tags: None

ENI Efficiency Problem

I was surprised when I did not see an ENI DTA cell polygon around the storm in southern Mountrail County. The two strong storms further south both had polygons, but this one did not. I noticed this storm was also strong with high reflectivity values aloft and some rotation. The 1 min cloud flash ENTLN lightning plot only showed one flash associated with this storm. The total lightning detection efficiency is only around 40% in this area which may explain why there was very little lightning associated with it. Since there wasn’t an ENI DTA cell polygon, I couldn’t look at the time series. This example showed me that it’s important not to rely on this data. It would be nice if the lightning detection efficiency were higher in this part of the country or equal across the entire country.  ENI

-Helen Hunt

Tags: None