ProbSevere ProbTor gets tricked

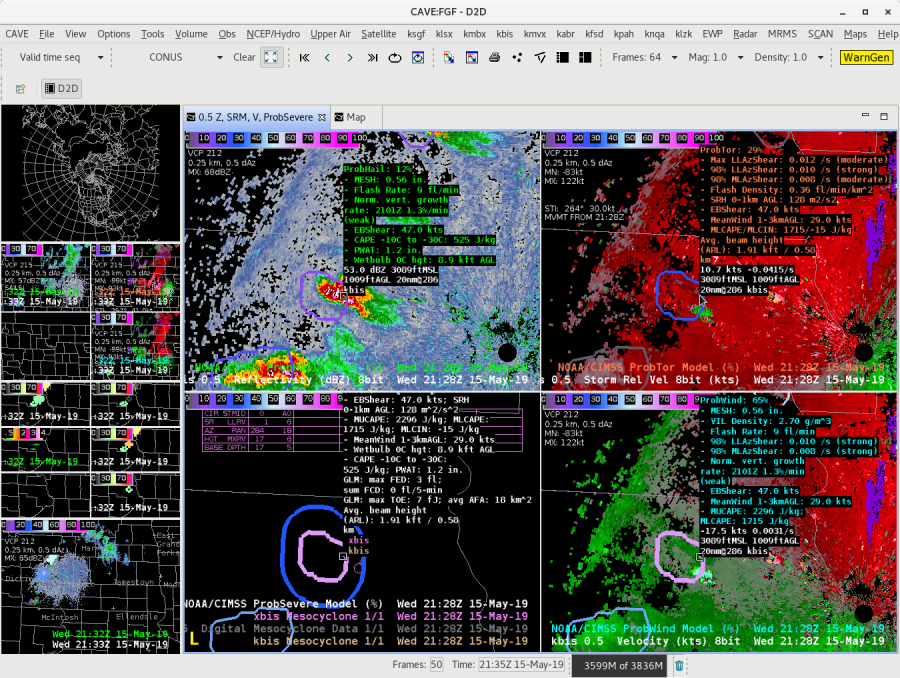
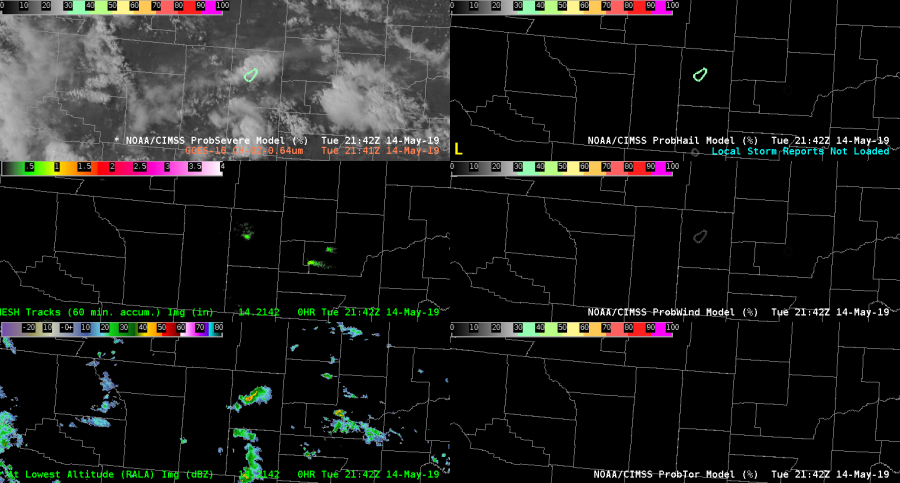
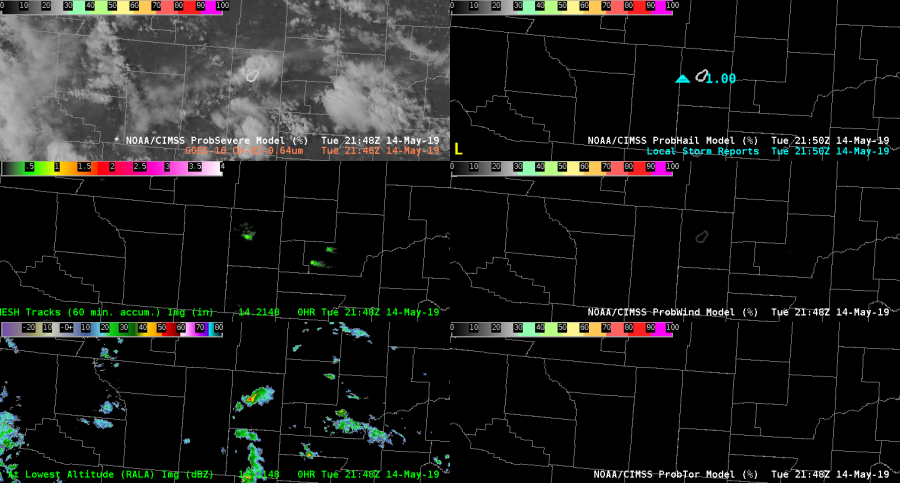
Upper left: Orange ProbSevere with a green ring signifying escalated ProbTor
Bottom right: Low Level Rotation tracks with green ProbTor Object associated with the green ring at upper left.
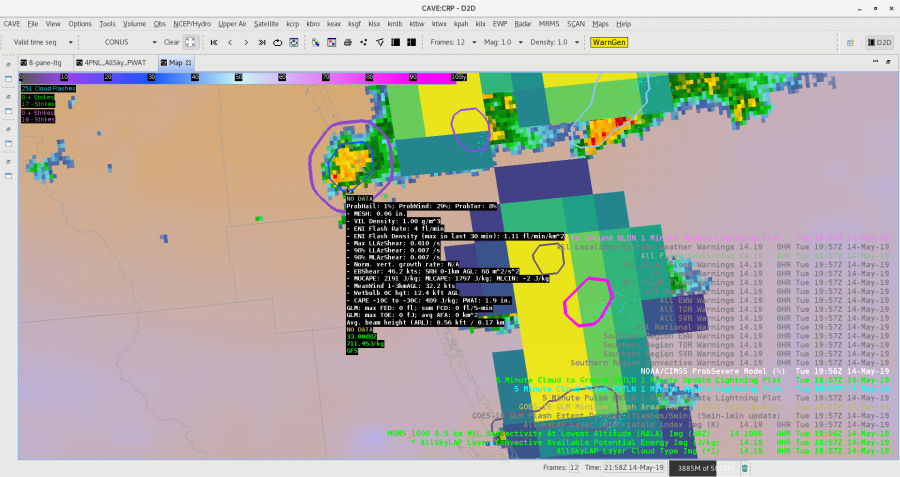
Lower Left: KBIS base velocity.

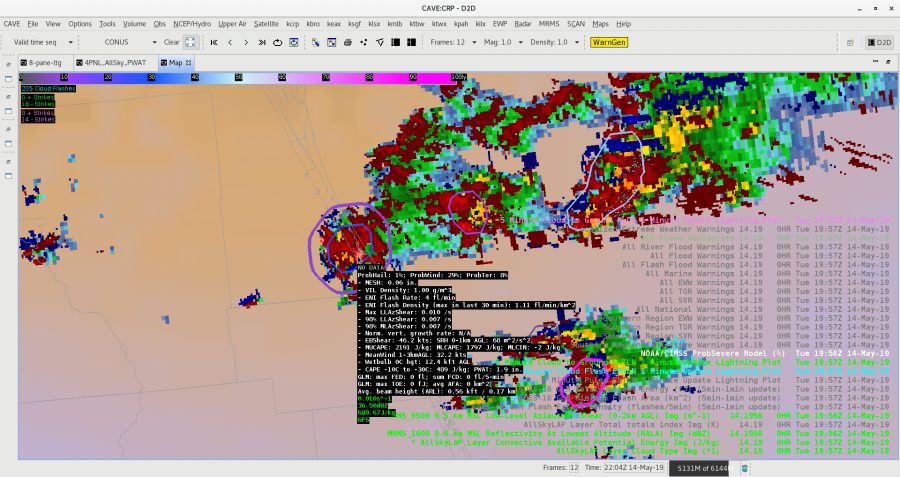
Key things to notice above – a spurious looking inbound maximum to the northwest of KBIS and a corresponding uptick in Low Level Rotation tracks in response to this shear zone that likely is just an artifact of sampling near the ground.  Below, we see ProbTor climbing to over 40% (red trace).  Be careful with ProbTor when the storm is close to a radar.

Suggestion: Instead of 0-2km, perhaps Low Level Rotation Track should be capped at the estimated LCL AGL.

#MarfaFront

Lightning observed but no GLM

ProbSevere gives every indication of a severe storm over Morton County, ND (see ProbSevere read out below).  The Earth Networks lightning suggests there of 52 fl/min but GLM FED gives 0 fl, TOE 0 fJ, and AFA 0 km^2.  The two depictions below show those three GLM fields with the MRMS 1 km reflectivity.  Perhaps there is an issue with viewing angle at this northern latitude. – Jonathan Wynn Smith (ESSIC/UMD)

ProbHail: 93%; ProbWind: 95%; ProbTor: 5%
– MESH: 1.83 in.
– VIL Density: 3.20 g/m^3
– ENI Flash Rate: 52 fl/min
– ENI Flash Density (max in last 30 min): 0.89 fl/min/km^2
– Max LLAzShear: 0.007 /s
– 98% LLAzShear: 0.006 /s
– 98% MLAzShear: 0.008 /s
– Norm. vert. growth rate: 2101Z 1.3%/min (weak)
– EBShear: 38.0 kts; SRH 0-1km AGL: 155 m^2/s^2
– MUCAPE: 2925 J/kg; MLCAPE: 1657 J/kg; MLCIN: -36 J/kg
– MeanWind 1-3kmAGL: 26.4 kts
– Wetbulb 0C hgt: 9.0 kft AGL
– CAPE -10C to -30C: 546 J/kg; PWAT: 1.3 in.
GLM: max FED: 0 fl; sum FCD: 0 fl/5-min
GLM: max TOE: 0 fJ; avg AFA: 0 km^2
Avg. beam height (ARL): 1.28 kft / 0.39 km
Object ID: 273531
PS: 98

ProbSevere Potential Gotcha

A potential “gotcha” and/or training issue…

I initially loaded a 4-panel with 0.5 Reflectivity and ProbHail overlaid, 0.5 SRM and ProbTor overlaid, and 0.5 Vel and ProbWind overlaid, but I had not loaded the full ProbSevere Model in any of the 4 panels. I then noticed that there was a 29% ProbTor (which was erroneous with bad dealiasing), but my attention wasn’t called to it because the 2nd circle around the storm only appears on the full ProbSevere. It would seem like a good idea to either always have the full ProbSevere displayed or if folks prefer to load the threats separately, perhaps need to add a second circle around the ProbTor object.

ProbSevere 4 Panel – Upper Left: 0.5 Reflectivity + ProbHail, Upper Right: 0.5 SRM + ProbTor, Bottom Right: 0.5 Vel + ProbWind, Bottom Left: NMDA + ProbSevereModel

-Tempest Sooner

ProbSevere

Overall impressed with the performance of Prob Severe today. Quick way to distinguish between weak/strong/severe storms. In this example from the high plains of Wyoming, there was an organized storm that Prob Hail spiked to 90% about an hour before the 1.5″ hail report, and remained at elevated to 75% at the time of the hail report. Don’t mind the low (3%) threshold for the ProbTor outline, as it is an easy way to keep that important piece of information quickly viewable by the warning forecaster.

— warmbias —

Mexican Severe Storm

A strong low level moisture gradient showed up on the Sfc- 0.9sigma AllSkyLAP image early in the afternoon south of the Big Bend region in Mexico. This could serve as an initiating boundary later in the afternoon.

Low Level AllSkyLAP and Low Level IR/WV top, mid level AllSkyLAP and IR/WV bottom

A look at the NUCAPS Forecast CAPE from the ~21Z pass showed over 3000 J/KG of CAPE at the 03Z Forecast hour. Earlier forecast hours (00-02Z) were missing data, however, if you interpolated between available data points, it seemed as though there was a maxima of CAPE in the area. It was noted that a storm developed around 21Z.

NUCAPS Forecast 03Z Forecast

To gain more detail, I clicked on a NUCAPS modified sounding east of the low level moisture gradient in the vicinity of the storm. It’s clear this is a very unstable sounding, capable of producing (at least) large hail. This clued me  in on how fast the storm could become severe. Certainly would not have had a special 19-20Z sounding in this area without NUCAPS and would have solely relied on model forecast soundings.

NUCAPS sounding from Mexico ahead of low level moisture gradient at 20Z

Even though it is far away from the KCRP radar, prob severe quickly showed the developing storm ramp up and have very high severe hail (and wind) probabilities (roughly within 15 minutes of initiation). If the NUCAPS forecast is right, this storm would likely continue into the evening given the abundant instability.

Prob Severe from KCRP looking in Mexico

-Tempest Sooner

Separating threats in D2D with ProbSevere2

It’s nice to break out ProbHail, ProbWind, and ProbTor as separate displays (right hand column below) – something that is not even possible with the ProbSevere v2 placefiles.

ProbHail was the greatest threat (far upper left panels), topping out around 33%, and culminating in a quarter size hail report (below, upper right). It’s been pointed out that ProbSevere has been much harder to calibrate out west where there are fewer reports and thermodynamics are different. So, it’s really all about trends instead of quantities.

#MarfaFront

ProbTor reliable? Lightning says no, MRMS says maybe.

There is difficulty with having confidence of the ProbTor portion of the ProbSevere product due to an instance where it is estimating higher tor rates (8%) when a storm has no identified lightning (GLM, NLDN, and ENTI) along the coast of Florida. To be fair, the storm previously did indicate some lightning with it. I investigated the TOE, FED, and Min Flash Area in the vicinity of this storm, as well as usual point lightning data in 5 and 1 min updating intervals, and it has me confused as to what the ProbSevere is “seeing” for its lightning data (it is indicating ENTI lightning within its circle). Below is the image example of ProbSevere loaded alongside lightning data including GLM’s Min Flash Area:


I also pulled up the lowest level rotation tracks from MRMS data, and it did indicate a slightly higher maximum within the ProbTor circle, so I believe the ProbTor is locking on to that feature.   – shearluck


AllSky vs. ProbSevere: Which MLCAPE is best and where?

When utilizing the AllSky CAPE image product (MLCAPE), and comparing it to the ProbSevere MLCAPE values for reliability purposes of both tools, it is noticeable the differences between the two when there’s precip. This is due to the fact that most rain areas will not be able to be sampled by the satellite (clear/cloudy), and will be utilizing the GFS data in these areas where ProbSevere is located.

One way around this difference reliability issue is to scan the surrounding areas that are utilizing satellite data (preferably a “clear” spot), and in those cases, the MLCAPE values sampled seemed more comparable to the ProbSevere MLCAPE (RAP) of the storm than that of the GFS sampled MLCAPE data. The GFS sampled locations almost always show a lower MLCAPE value than the ProbSevere MLCAPE. The downside of sampling farther away from the storms/precip areas is that you are sampling rather far away from the storm environment. It’s also difficult to say that the ProbSevere MLCAPE is more accurate or not and what the reliability factors may be.

Below is an example of a storm over TX that is sampling the MLCAPE of the GFS (green text) and of the ProbSevere RAP (white text). -shearluck

Storm Trends – ProbSevere

While the storm looked strong to possibly severe on radar, the trends in the ProbSevere Time Series were indicating a downward trend/weakening. Thus, I chose to held off on issuing a SVR. The storm did ultimately weaken, as the ProbSevere Time Series was indicating. Note, in the image, the warned storm on the right has lower probs, but was stronger in earlier scans and had produced severe hail.

Life and Death in One Loop

Well, the convection is trying. And dying.  Case in point, the full life cycle of a pair of storms across the  northern suburubs of Houston.  Thoughts below:

You are looking at the 1-minute Mesoscale Sector scan with GLM Flash Extent Density, the Vaisala GLD dataset, and ProbSevere overlays.  Some things to look at:

ProbSevere struggled when the storms were most intense by merging two individual storm objects, splitting them apart, then re-merging back into one object.  Trends were a mess because of this.

GLM lightning activity ceased a full 10 minutes before ProbSevere dissipated the tracking associated with the cells.  However, it continued to show flashes taking place for 7-minutes after the last CG was detected in the GLD data.  Good use for IDSS to let people know that cloud-to-ground strikes are still possible.

The storms initially were moving northwest along a boundary then deviated to the northeast as they strengthened.  As soon as the moved off the boundary…bye bye!

-Dusty