
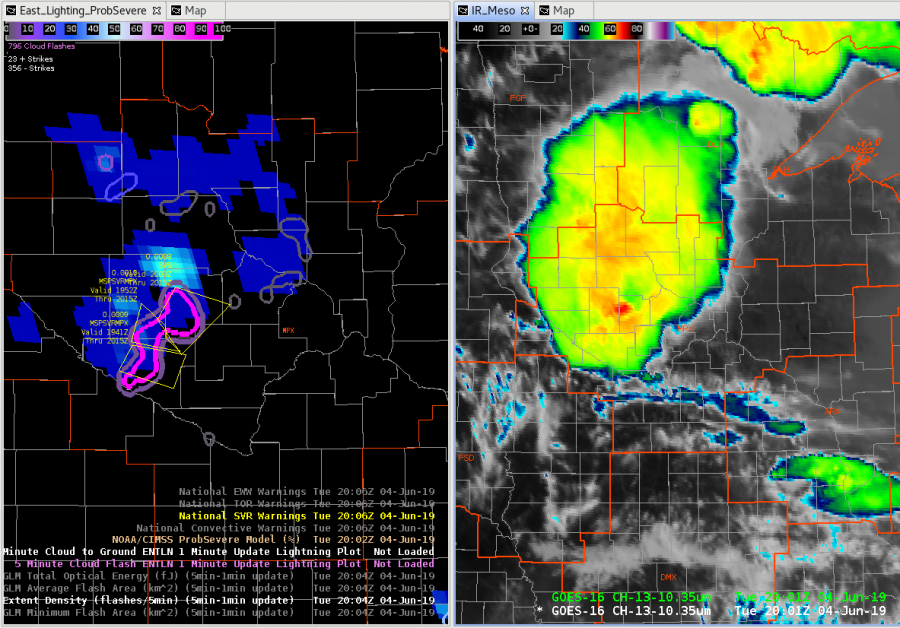
As you’re debating issuing a tornado or severe warning, it is good to see the lightning changes over time as well as cloud tops. Both are trending more severe in the image above.
Official websites use .gov
A
.gov website belongs to an official government
organization in the United States.
Secure .gov websites use HTTPS
A
lock (
) or https:// means you’ve safely connected to
the .gov website. Share sensitive information only on official,
secure websites.

As you’re debating issuing a tornado or severe warning, it is good to see the lightning changes over time as well as cloud tops. Both are trending more severe in the image above.
Flash extent density focused on that storm as well. Prob severe coming up. Had 50 dBZ to 48 kft and ~115 knot Delta V at storm top.
The Prob Severe Product has been very good for guidance today. See an example below.
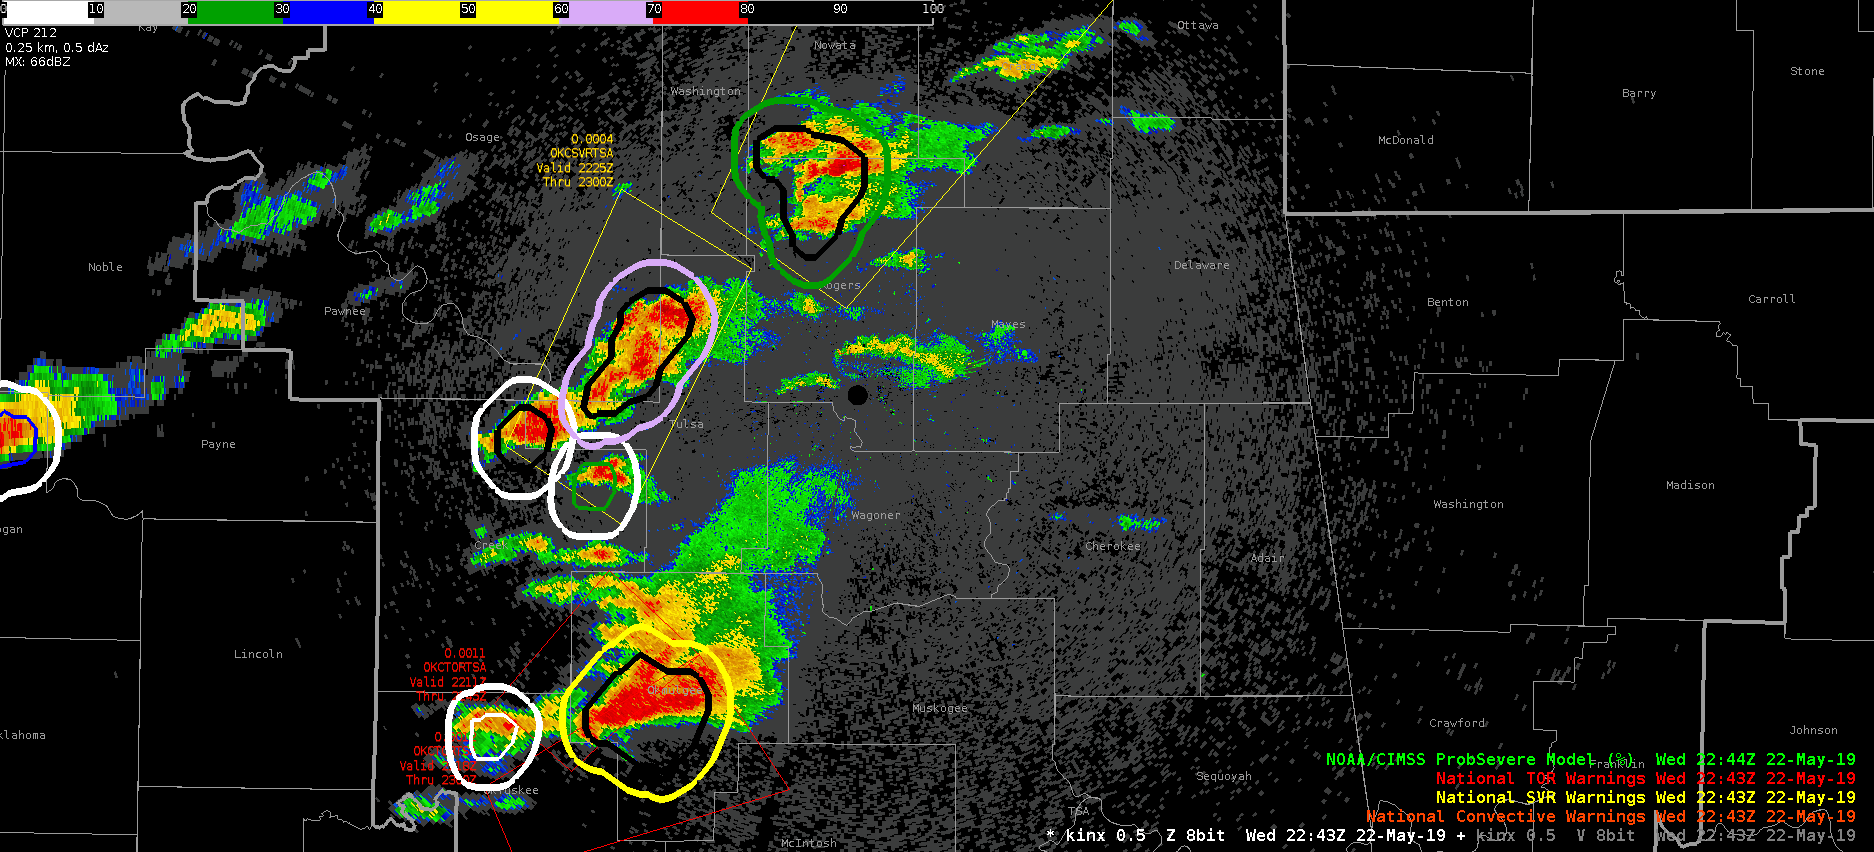
Notice I have used an alternative color scale for the Prob Severe, but every cell with a Prob Severe of 80%+ (in black) was placed under some kind of warning. The prob severe was not the only tool used in the warning decision making process (as usual), but it was very effective in confirming the decision process using the base data.
Thorcaster
There were 2 adjacent supercells heading into the Tulsa CWA and ProbSevere kept them as separate objects (correctly) despite their proximity. This is a great sign. Additionally, the ProbTor product effectively differentiated between a tight couplet (north, 70% ProbTor) and a weaker couplet (south, 34% ProbTor).
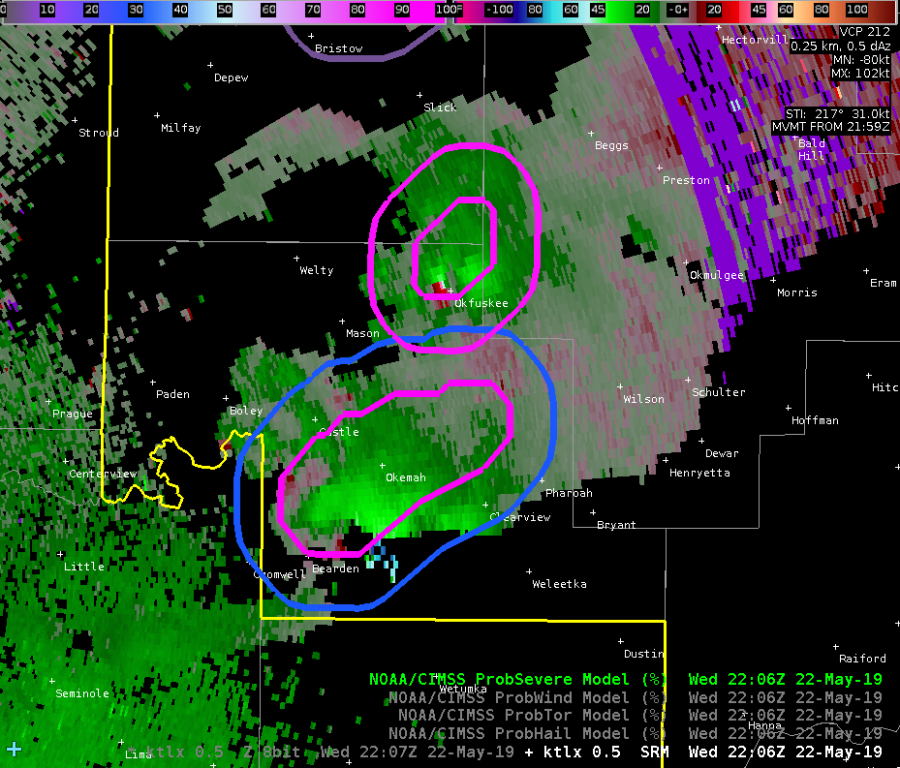
This case shows the ability of ProbSevere to differentiate storms with distinct features despite close proximity. It also shows that ProbTor is doing what we think it should based on velocity features. -Atlanta Braves
The best storm so far went up in the far NE part of the OUN CWA and the ProbSevere model handled it well:
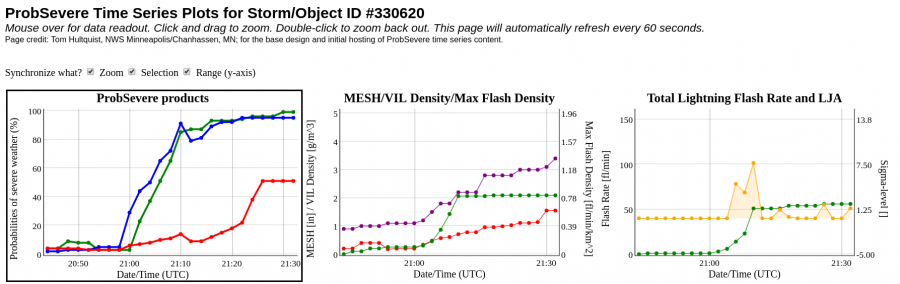
Note the lightning jump that occurs shortly after 21Z as well.
This is a nice supercell case! -Atlanta Braves
A semi-discrete cell tracked NNE of Little Rock, Arkansas. This storm developed a very tight reflectivity gradient on its southeast flank. A few other notable features were an inflow notch and hook-like appendage. Mitigating the severe potential with this storm was an outflow boundary displaced to the east of the updraft and low cloud flash counts (ground based) or cloud extent flash density (GLM).
The 0-2 km azimuthal shear generated what seemed to be a spurious bullseyes south of Searcy, Arkansas with values over 0.020 S-1. This data was input into the ProbTor algorithm, causing the spike to 72%. The 0-2 km azimuthal shear derived with the new dealiasing technique never plotted values over 0.008 S-1. In fact, the bullseyes which were located slightly to the NW of the primary rotation track, never showed up in the new azimuthal shear product. -Roy
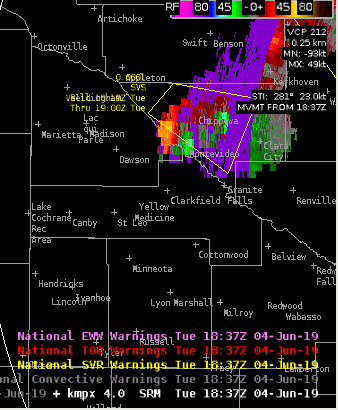
At times, there is some unnatural jumpiness in the Prob Tor Product. See the time series of 0.5 base velocity and Prob Severe/Tor below.
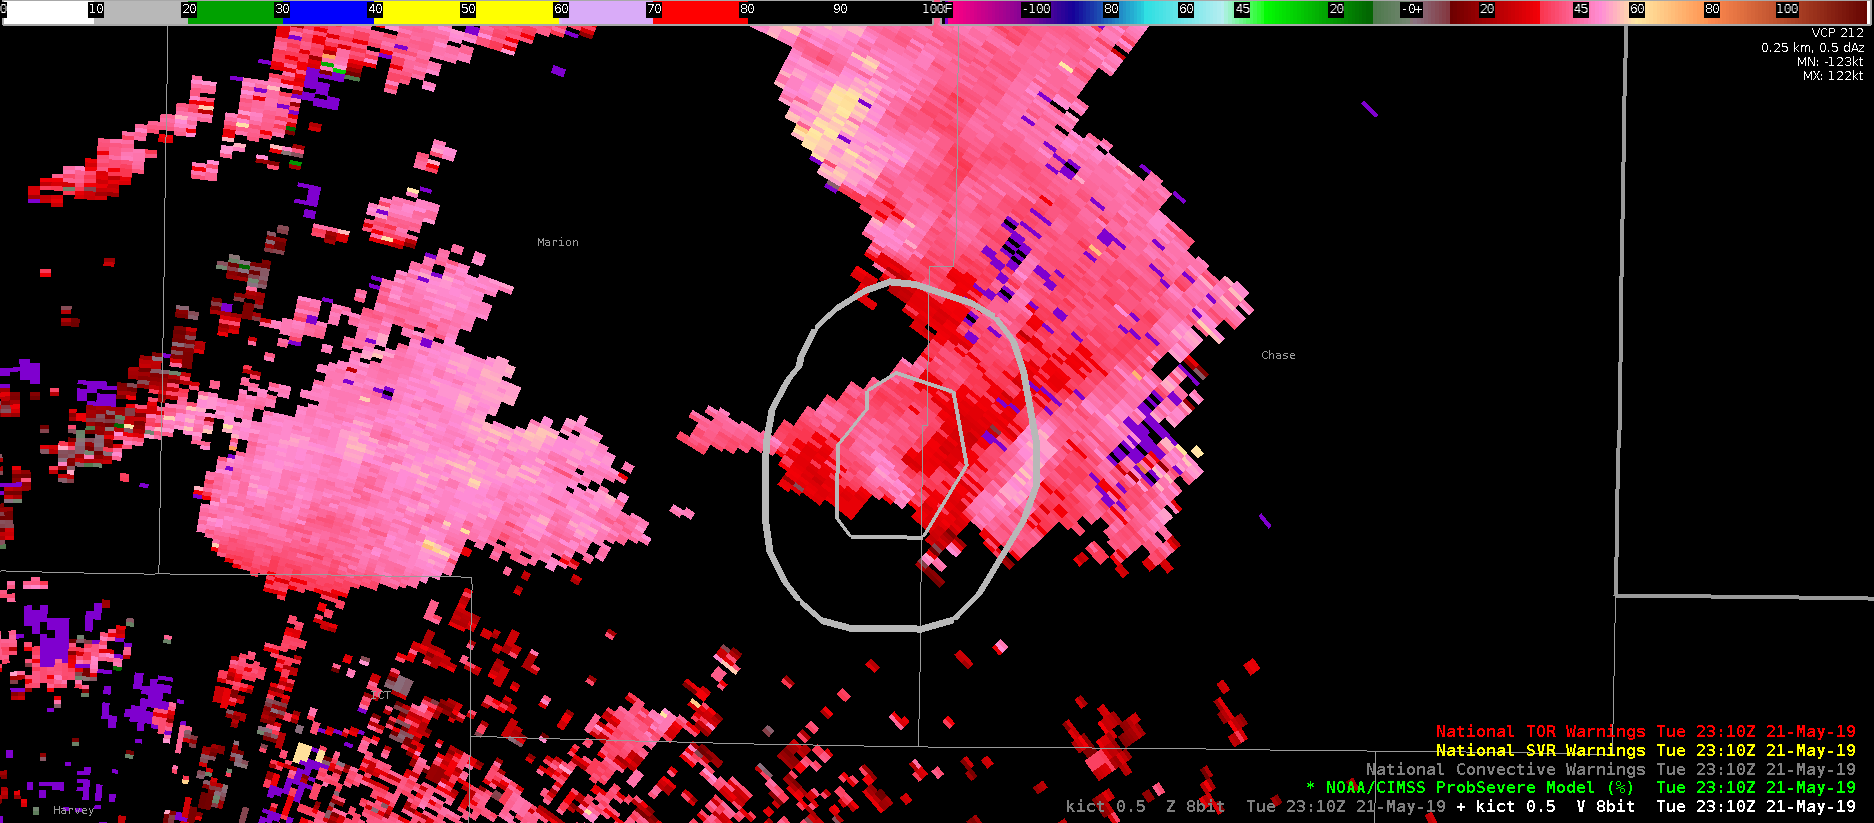
The first image is 2310Z. The storm is not overly impressive, with 5 minute FED max of 3 (not shown). Accordingly, the Prob Hail/Wind/Tor is 4/2/11 % respectively. The base velocity shows some decent winds of 45+ knots at about 3500 ft. above ground.
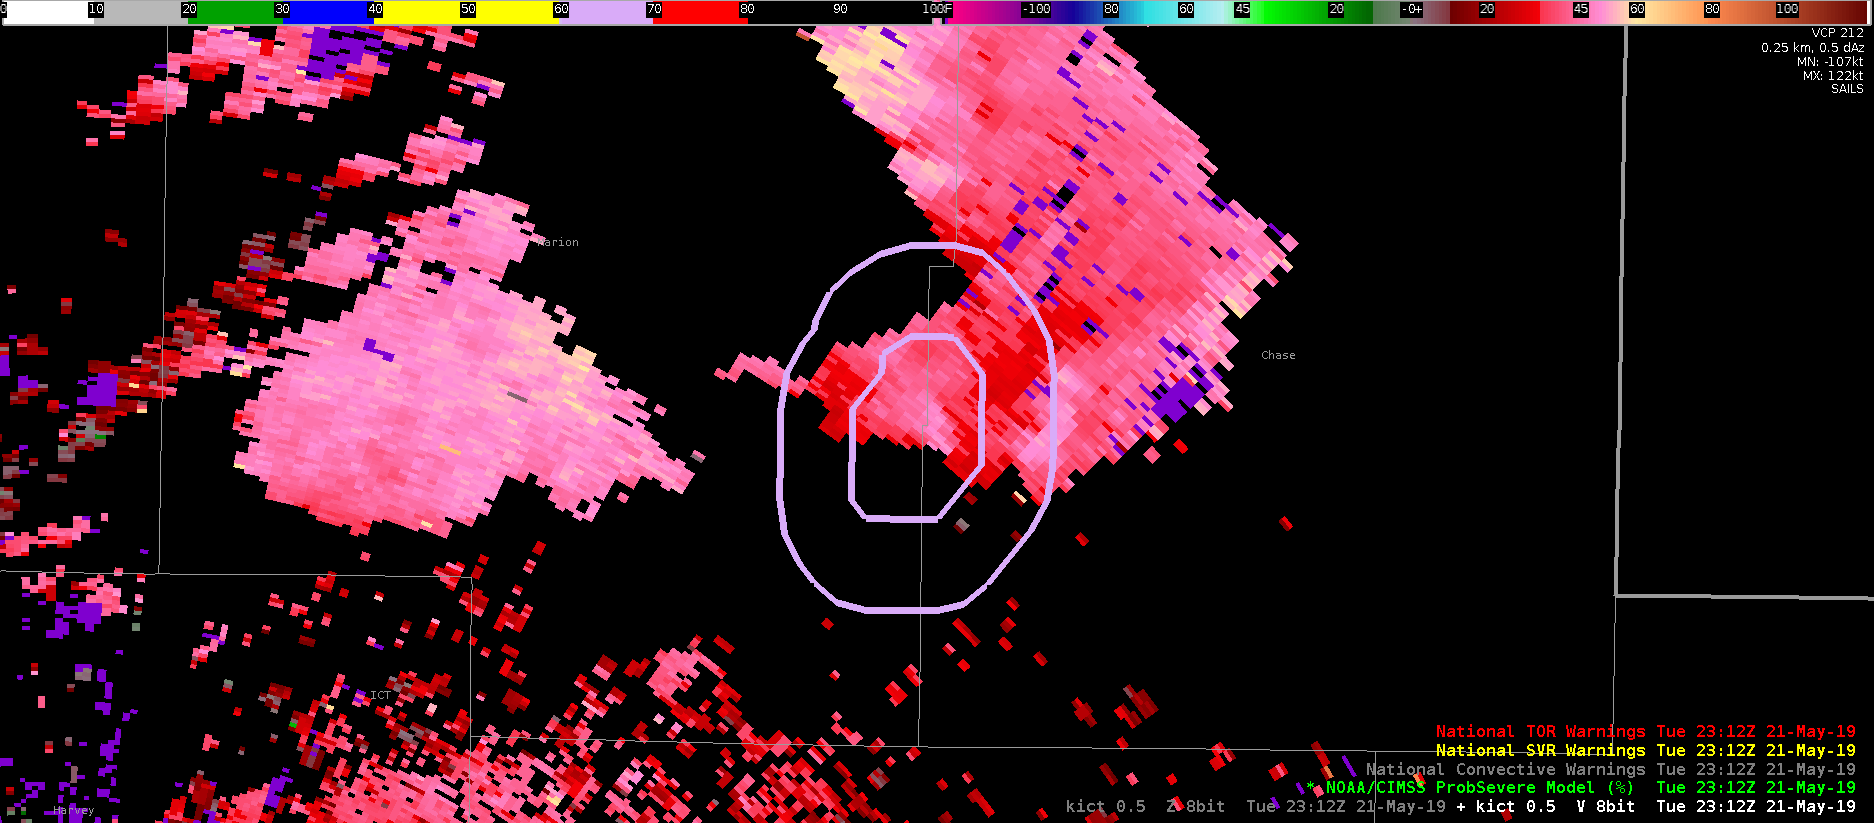
When moving to 2312Z however, the Prob Hail/Wind/Tor are 4/12/61 % respectively. That is a huge jump in Tor Prob, but the velocity does not indicate any substantive change in organization, and the 5 minute FED has not changed.
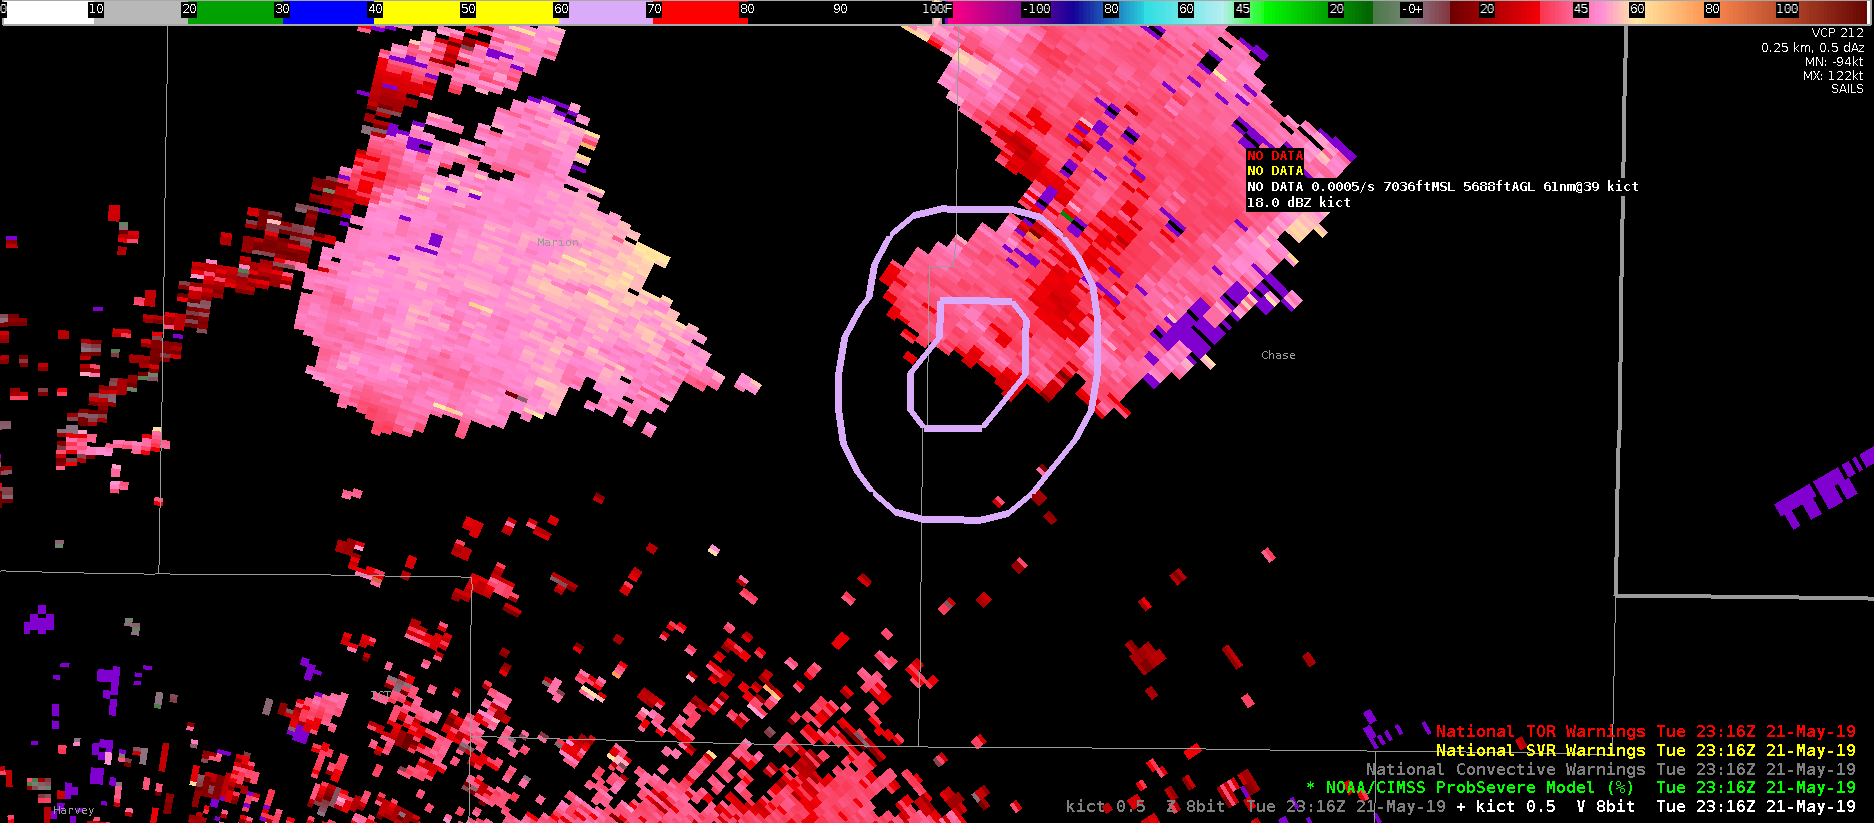
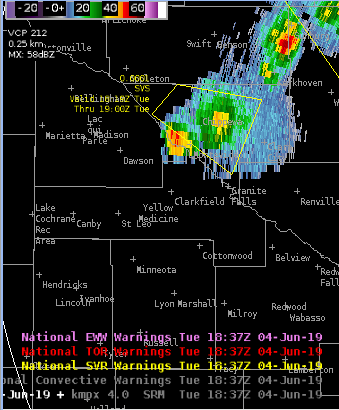
Going ahead to 2316Z, the base velocity looks even less impressive, but the Prob Hail/Wind/Tor are virtually unchanged at 3/12/61 % respectively.
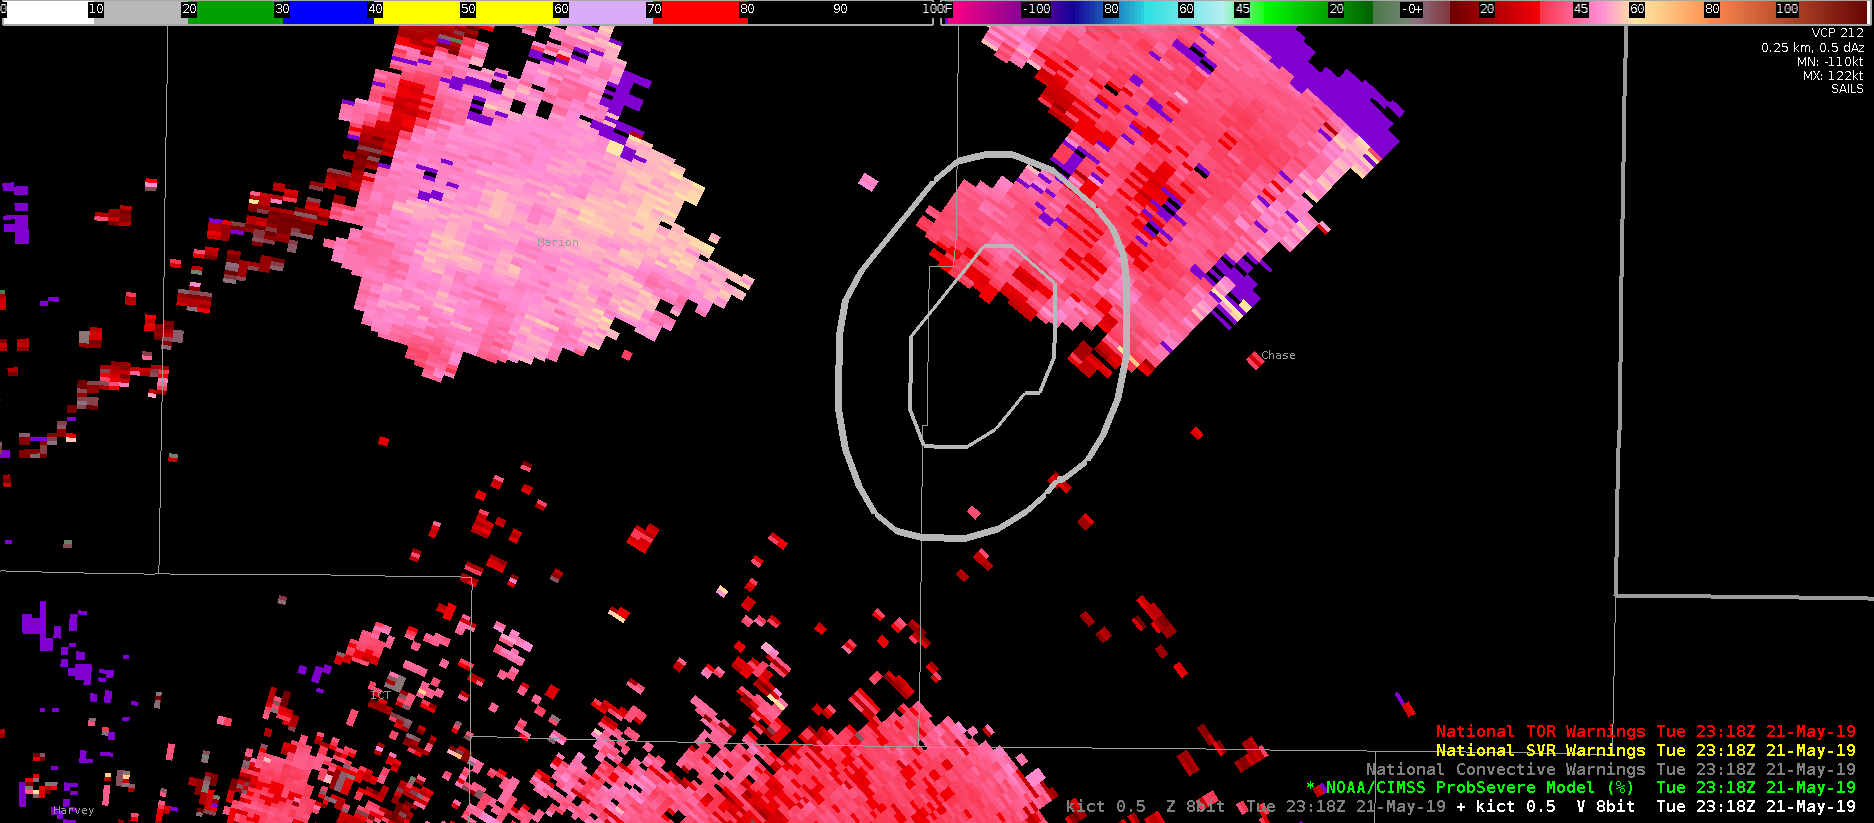
Finally, at 2318Z, the Prob Hail/Wind/Tor drop to 3/2/10 % respectively. These kinds of ups and downs despite any other evidence pointing to a change in organization made the products difficult to use in this case.
Thorcaster
Dealiasing problems in northwest Arkansas and southwest Missouri carried over to the operational version of the azimuthal shear rotation tracks. The azimuthal shear in the lower left panel uses a new dealiasing suppression algorithm, which effectively eliminated the noise. Fortunately, the noise with the current operational version of azimuthal shear was in a stratiform area of precipitation well behind the convective line, making it easy to ignore this data. Sampled winds in the region of the erroneous rotation tracks were very high — up to 80+ kts.
By focusing my attention on the azimuthal shear associated with the leading edge of the QLCS, and analyzing Probsevere data and trends, I was able to anticipate a strengthening of the line. The Probwind component was only 32% at 1934Z, then steadily increased, reaching 89% at 2012Z. At 2030Z there was a LSR of trees and power lines down in Mountain Home, Arkansas. Probtor increased to 65% at 2014Z, and as this storm shifted north into southern Missouri, there was a report of a blown out store front in Hartville, MO. It has not been confirmed whether or not there was a tornado. However, the increasing Probtor values increased my confidence for severe straight line winds that are often associated with strong mesovorticies. Depending on the event, Probtor trends and values could be used as a confidence builder to increase my warning wind speeds from 60 to 70 mph or 70 to 80 mph. Roy
The northern extent of a line of storms that has produced sporadic wind damage is approaching the LSX CWA from the south. One of these storms has good reflectivity structure with a tight front reflectivity gradient and a rear inflow notch. However, these storms appear to be entering a more stable airmass. This is reflected in the ProbSevere probabilities of the storm in question compared with one just a bit further north:
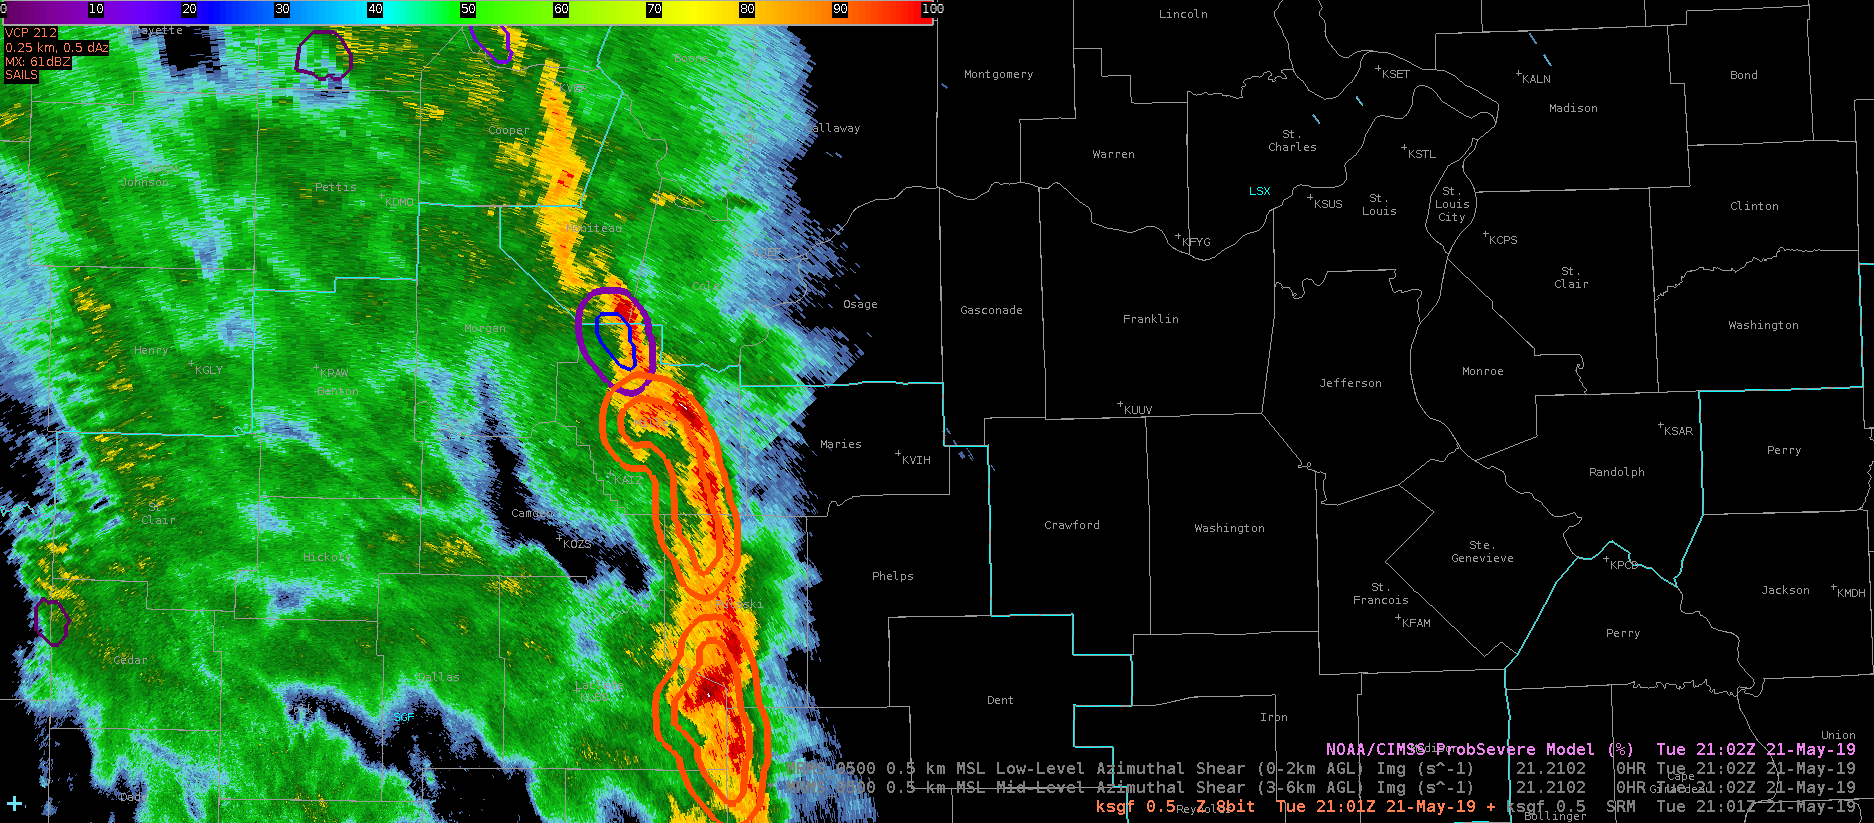
The northernmost storm with the cool contours has only a 22% ProbWind and is in an environment of only 715 J/kg MLCAPE (per the sampling feature). Meanwhile the storm in question to the south in the warmer contours has a 90% ProbWind with 1220 J/kg MLCAPE. These storms are moving to the northeast toward the more stable air. Incidentally, the All-Sky LAP CAPE does not depict as sharp of a gradient in the CAPE compared with the RAP-derived ProbSevere values:
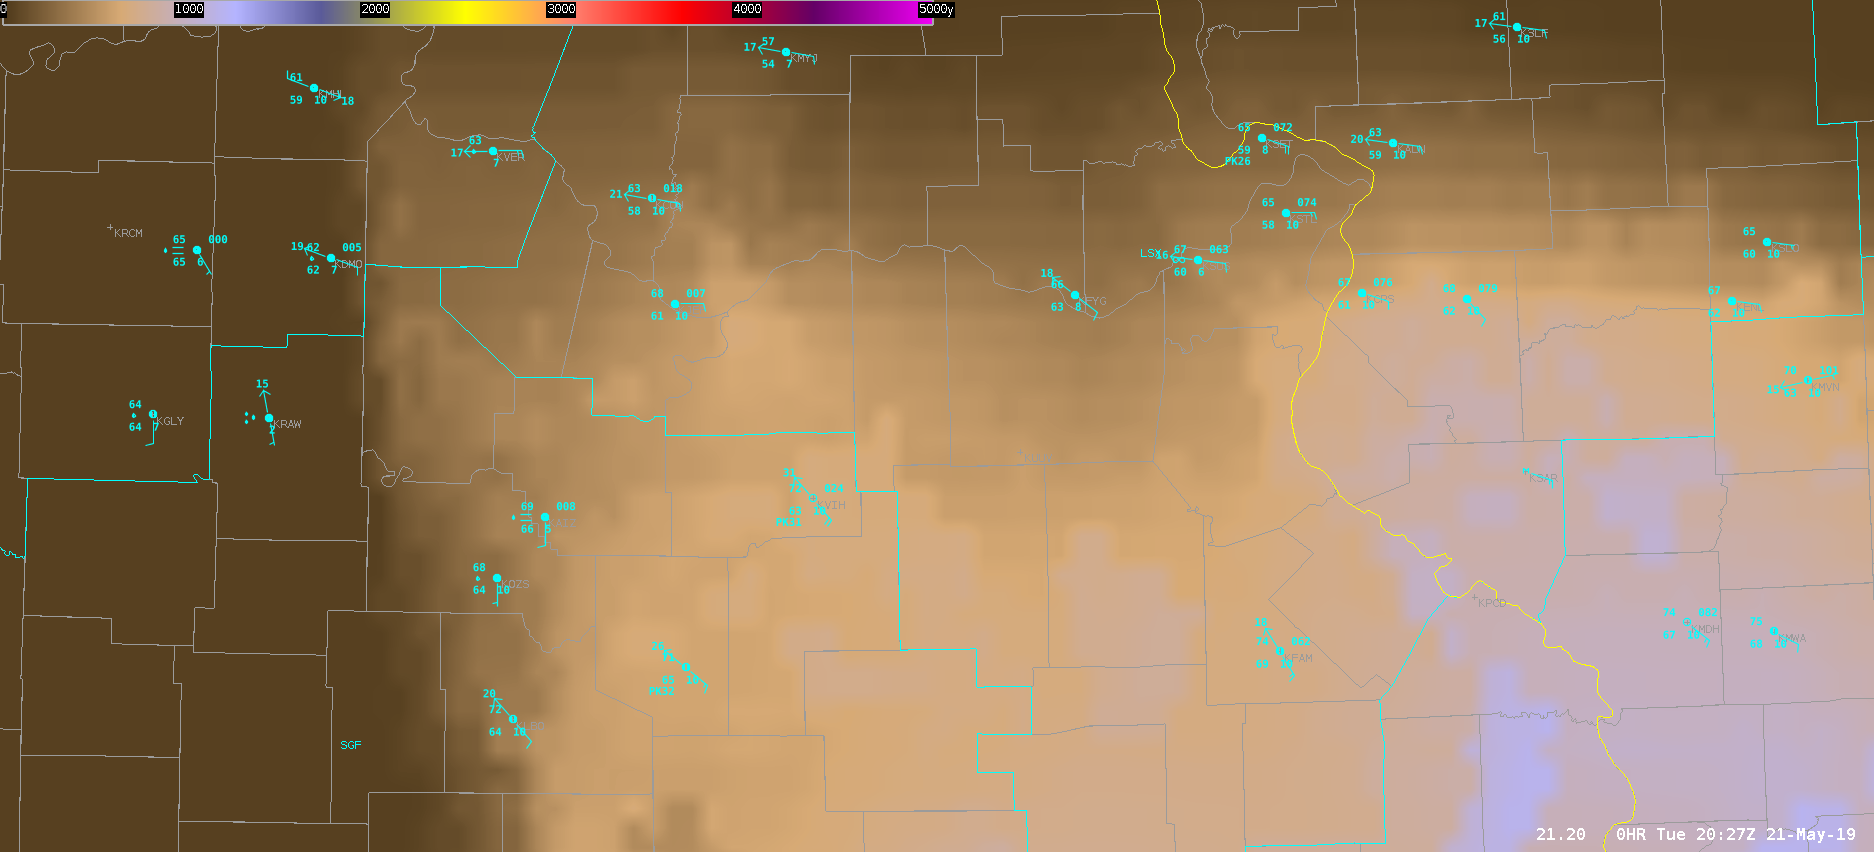
I am not sure which is more accurate but I suspect the model-derived values are more accurate in this situation.
Furthermore, a weakening trend in the Flash Extent Density is observed on the northern end of the line:
This storm still deserves a warning, but we will see how quickly it weakens.
Ron Dayne
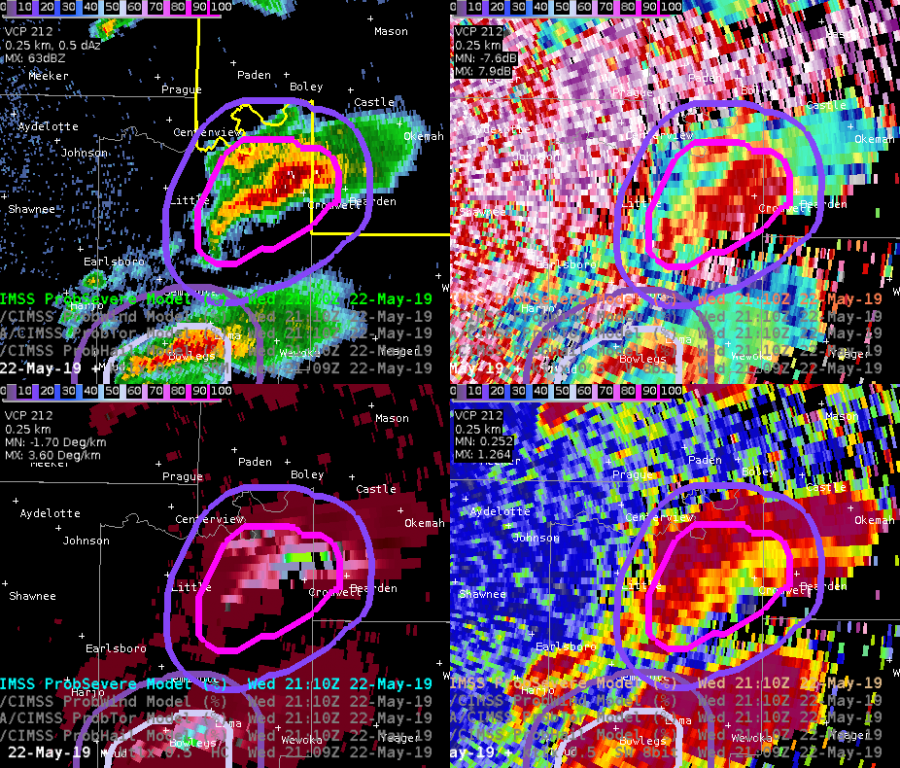
The NWS office in Little Rock started issuing tornado warnings on storms along the line so I pulled up the ProbTor product to see how it performed. For the storm near Knoxville, I can’t figure out what’s going on but I’ll attempt to document it here. For each time, I plot CPTI top left, LZK SRM top right, low-level AzShear bottom left, and spectrum width bottom right.
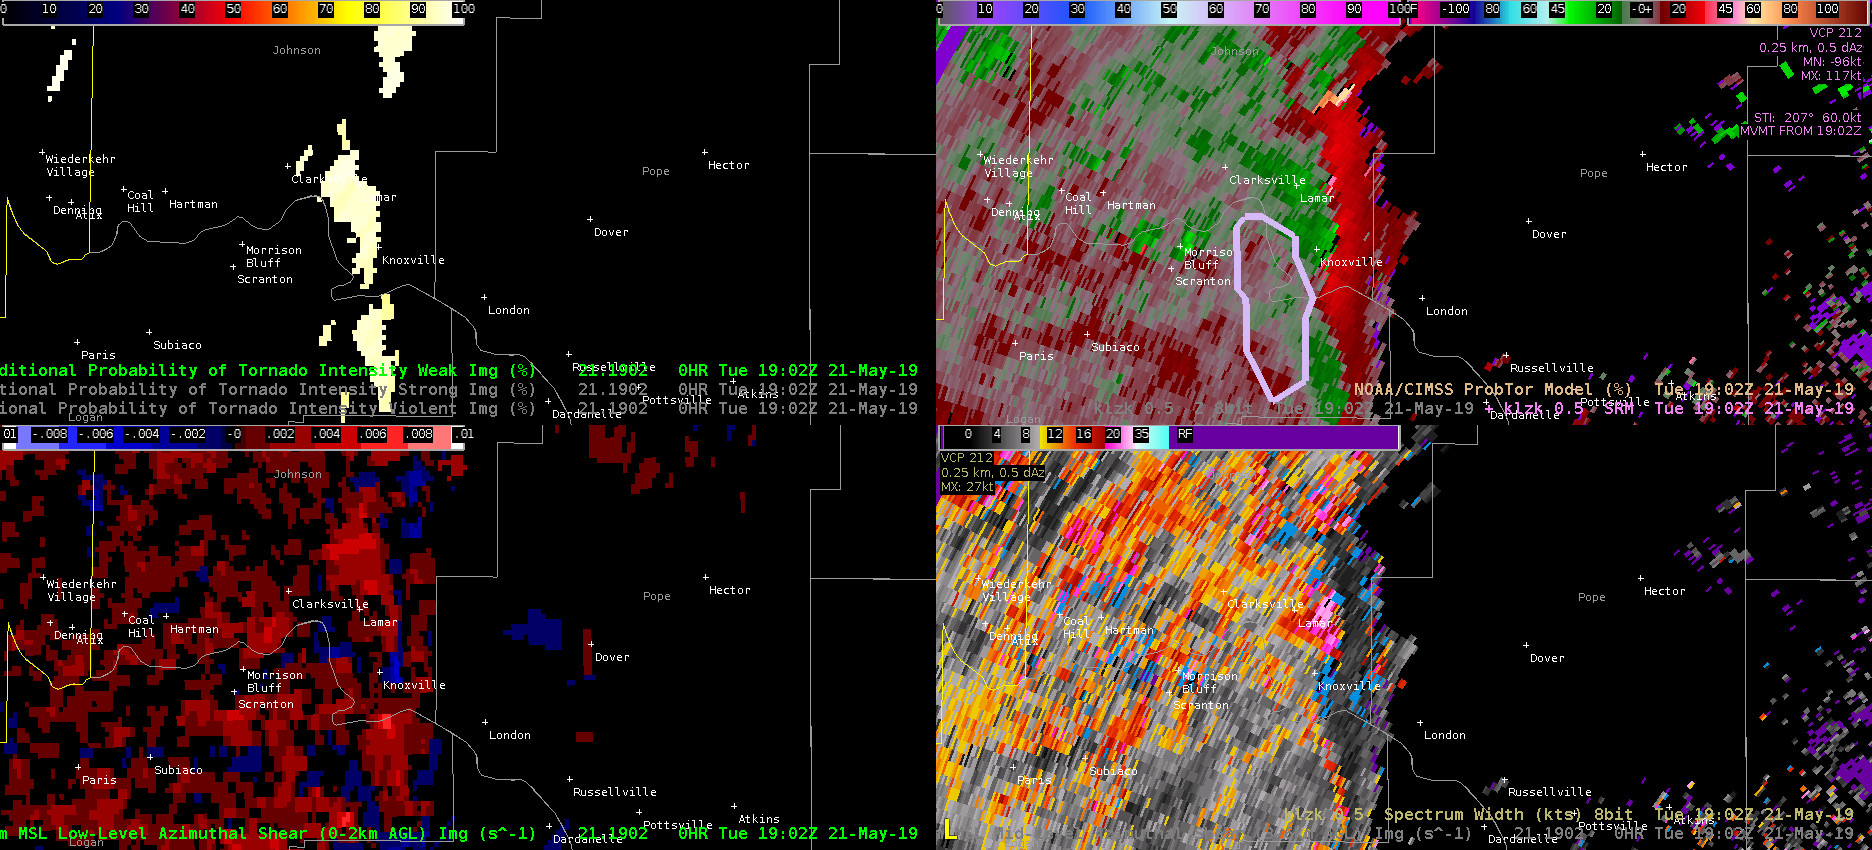
At 1902, the algorithm has a 60% ProbTor based on high LLAzShear (0.021 /s). I don’t see any high values on the low-level AzShear product, but perhaps I’m missing something.
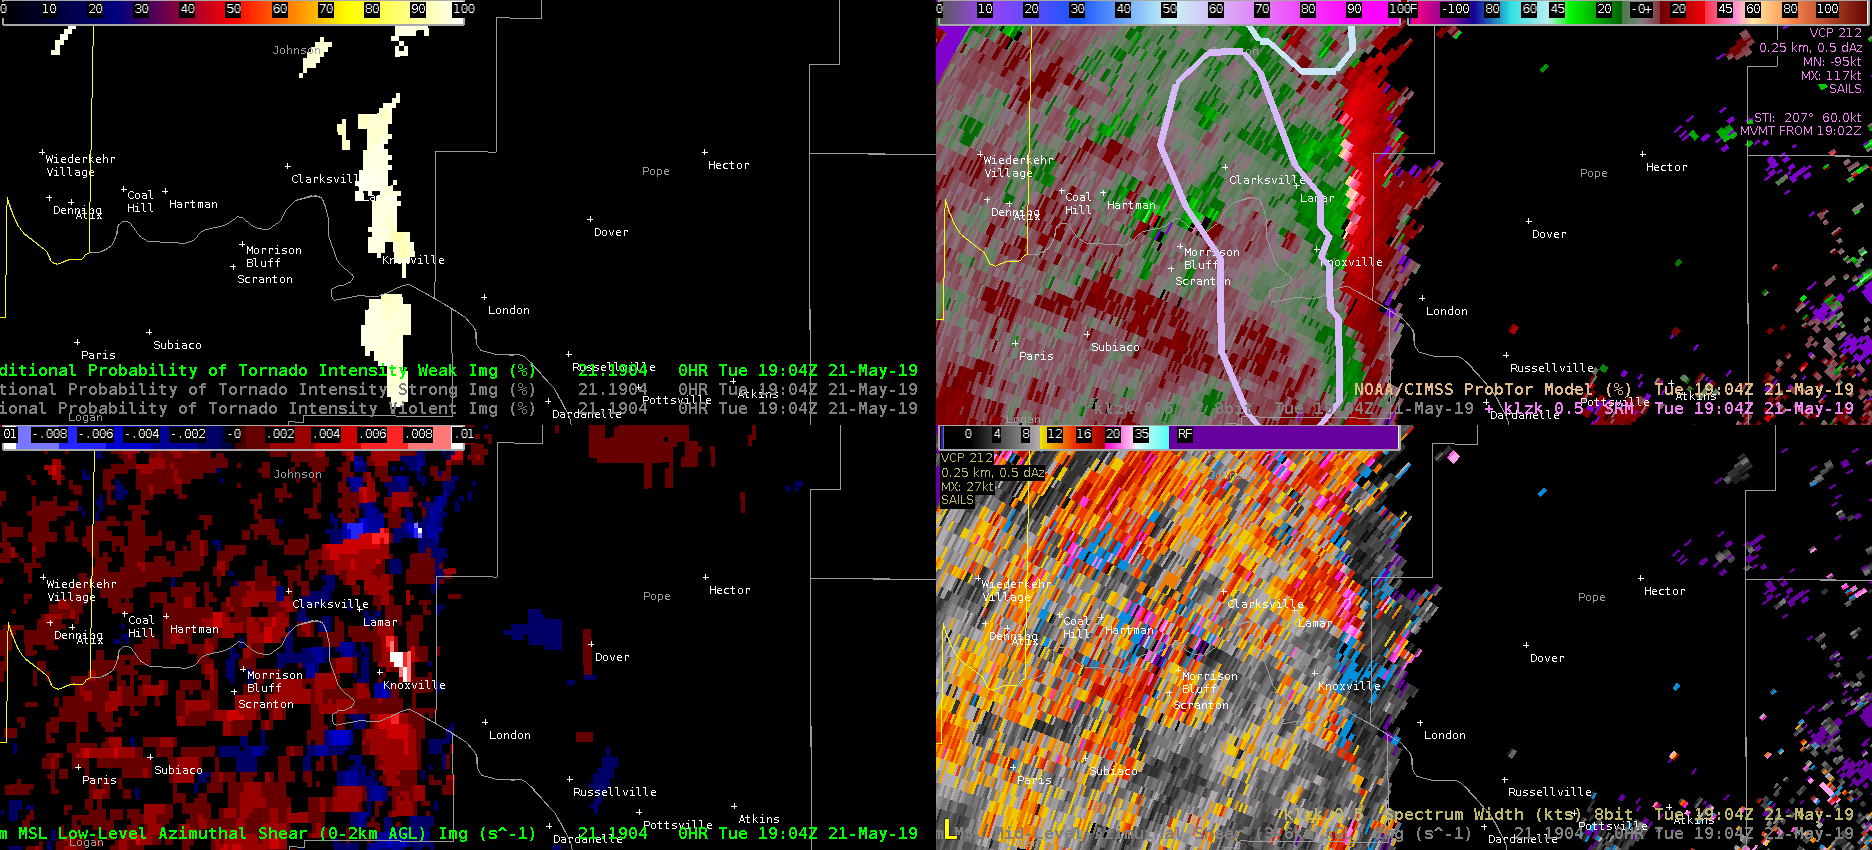
At 1904, a bullseye of high LLAzShear pops up just east of Knoxville. ProbTor is still 60%, which now makes sense to me. This identified shear region is not in the right place for a tornado and is just convergence along the line, but the ProbTor uses what it has and seems to generate an understandable ProbTor.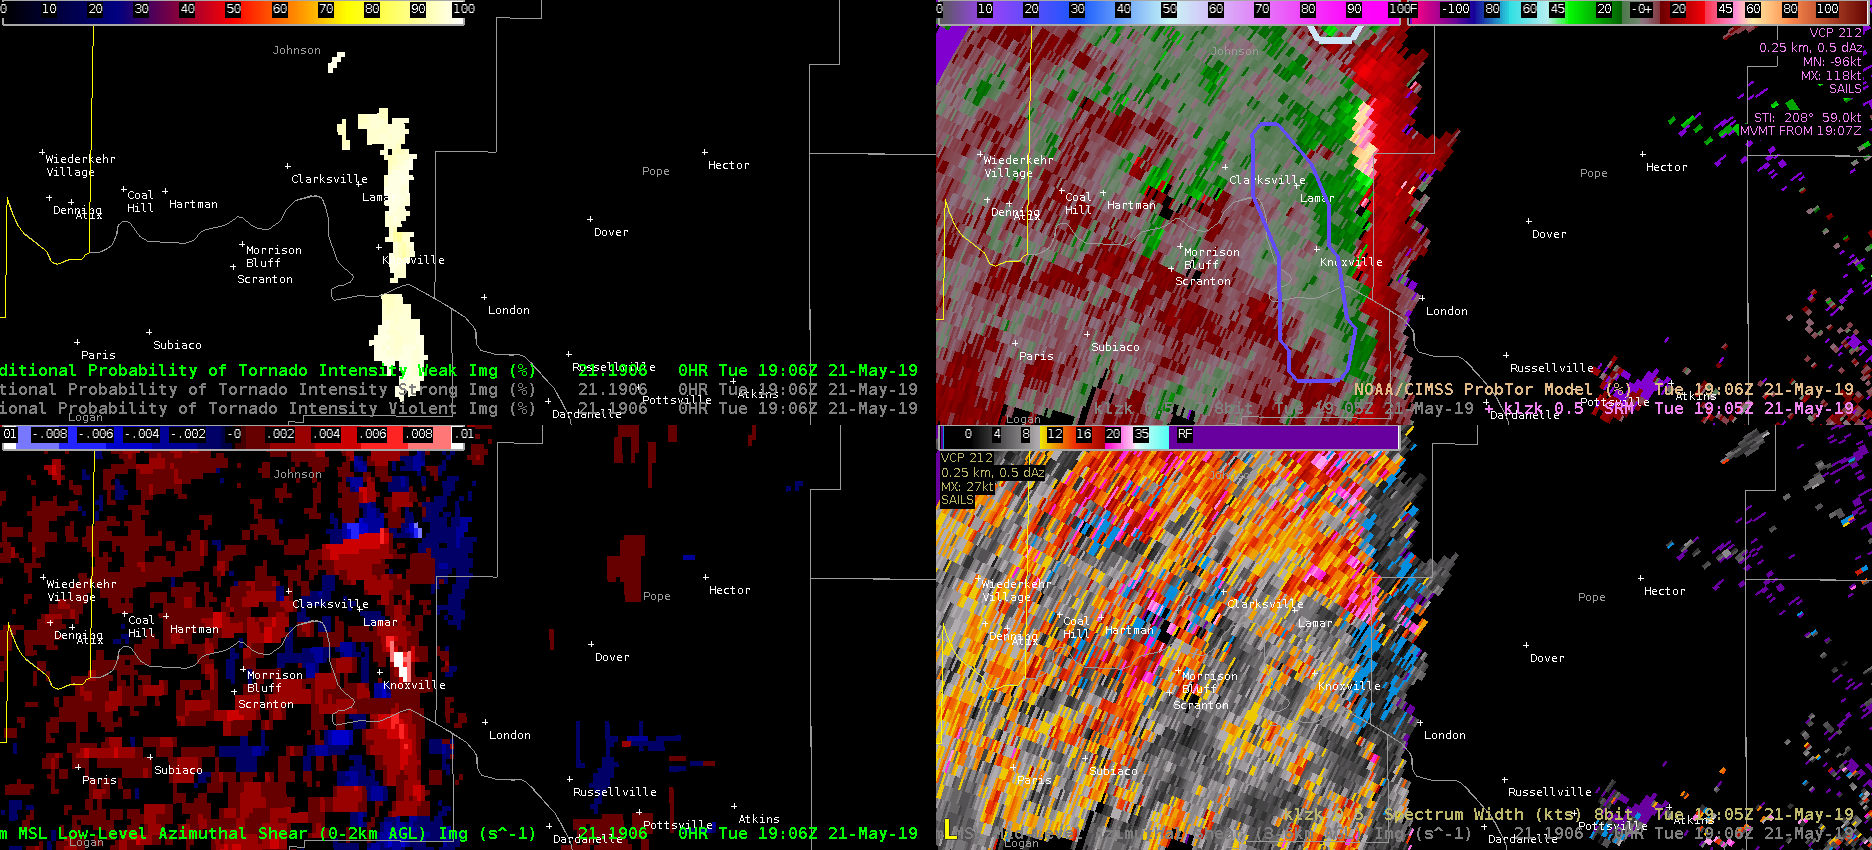
At 1906 the LLAzShear bullseye east of Knoxville persists, but now the ProbTor drops to 19% with a LLAzShear max value of (0.009 /s). I still sample 0.020 /s in the bullseye. Spectrum width is not horrible (~7 kts) in the area of the AzShear bullseye. The AzShear detection is obviously misleading for a tornado, but the ProbTor product does not seem to be performing as we’d expect it.
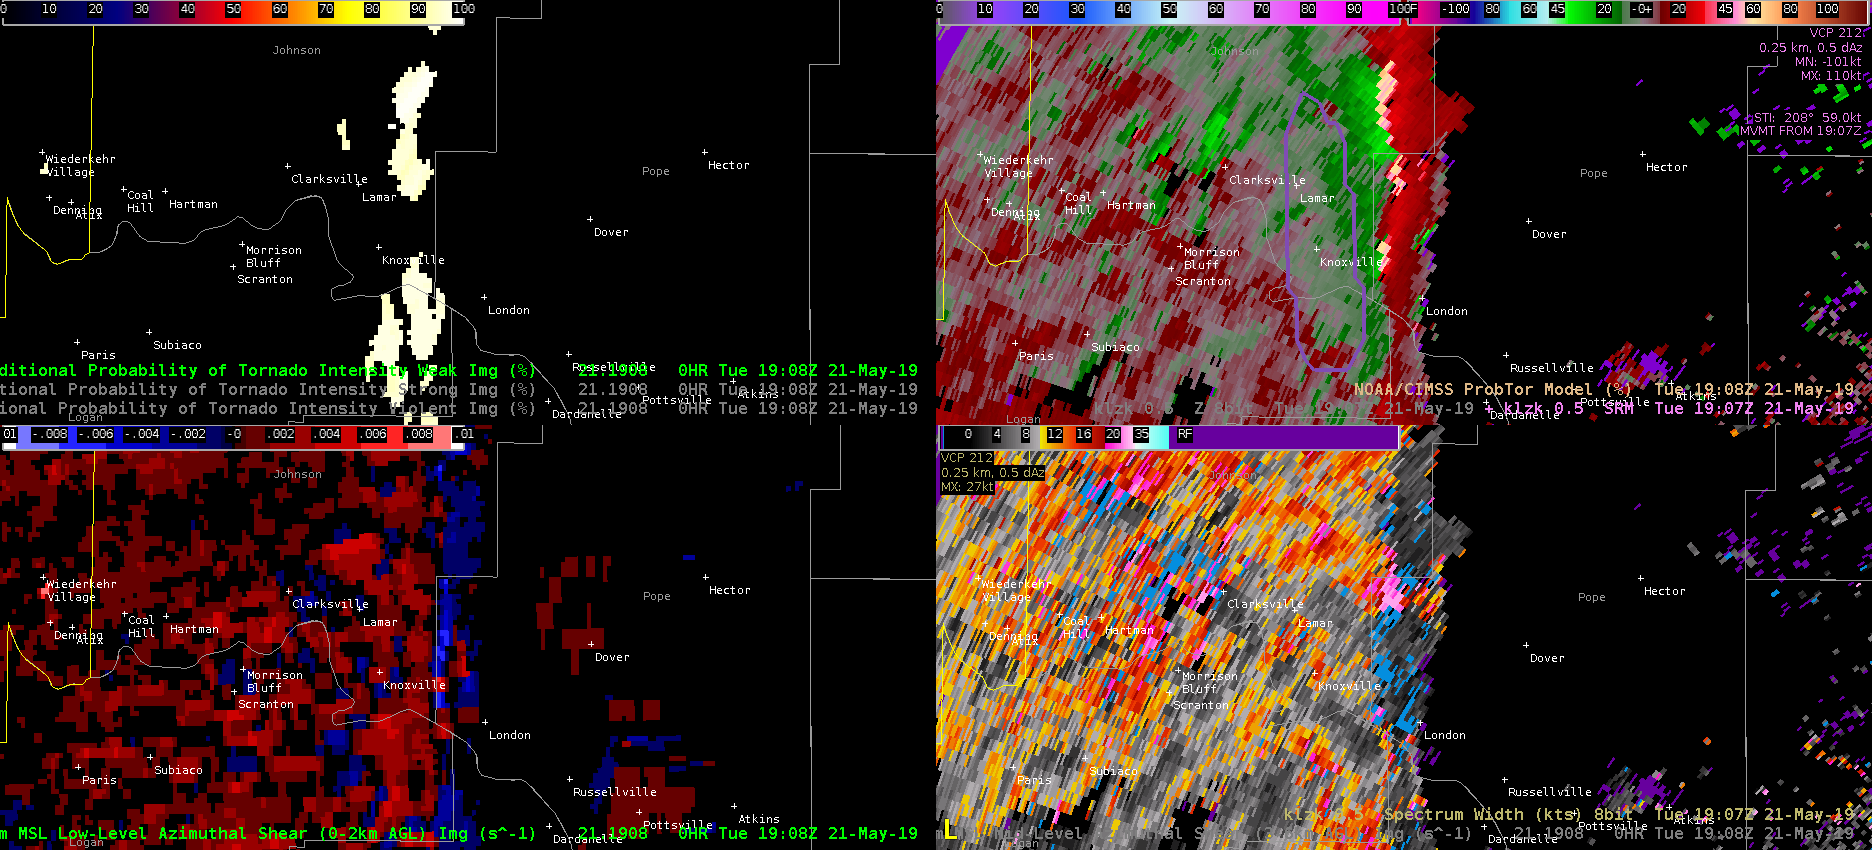
At 1908 the bullseye in AzShear goes away and the ProbTor drops even further to 6% (as expected). The persistence of the bullseye in AzShear with an associated significant drop in ProbTor is perplexing for this case! -Atlanta Braves.