
Image 1
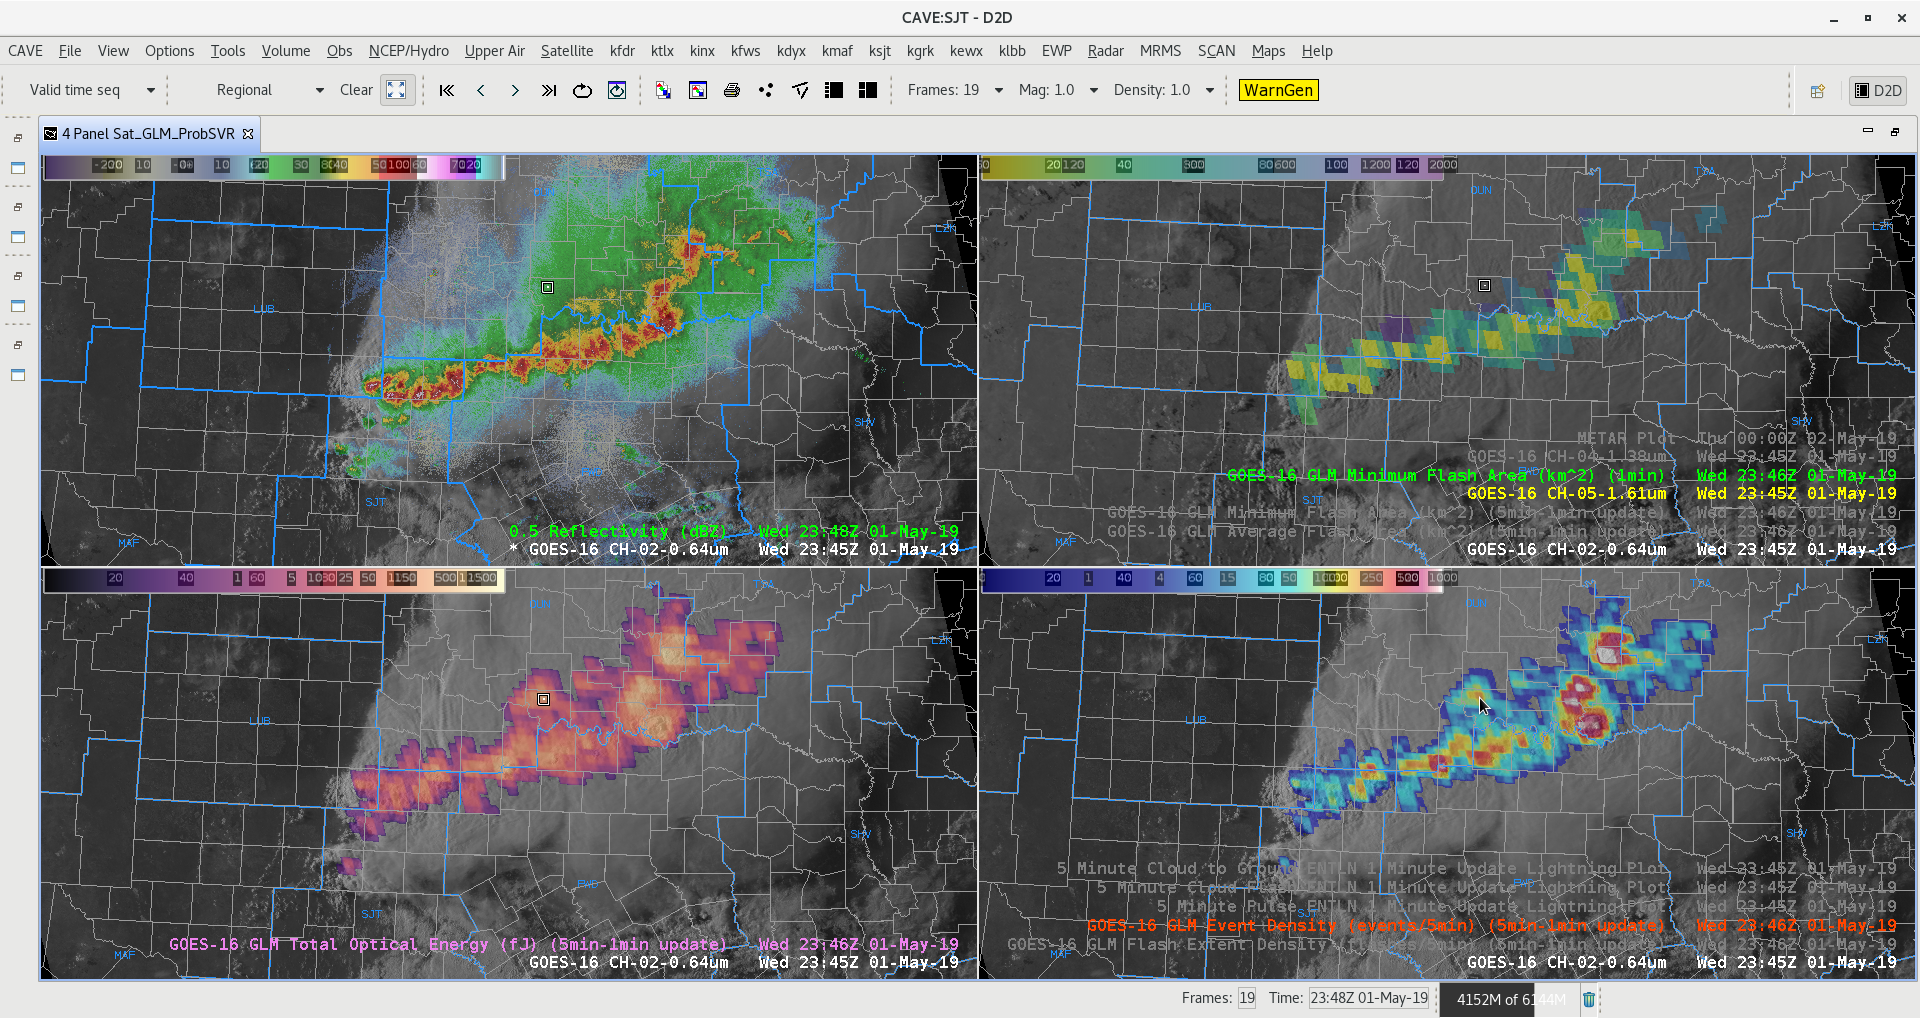
Image 2
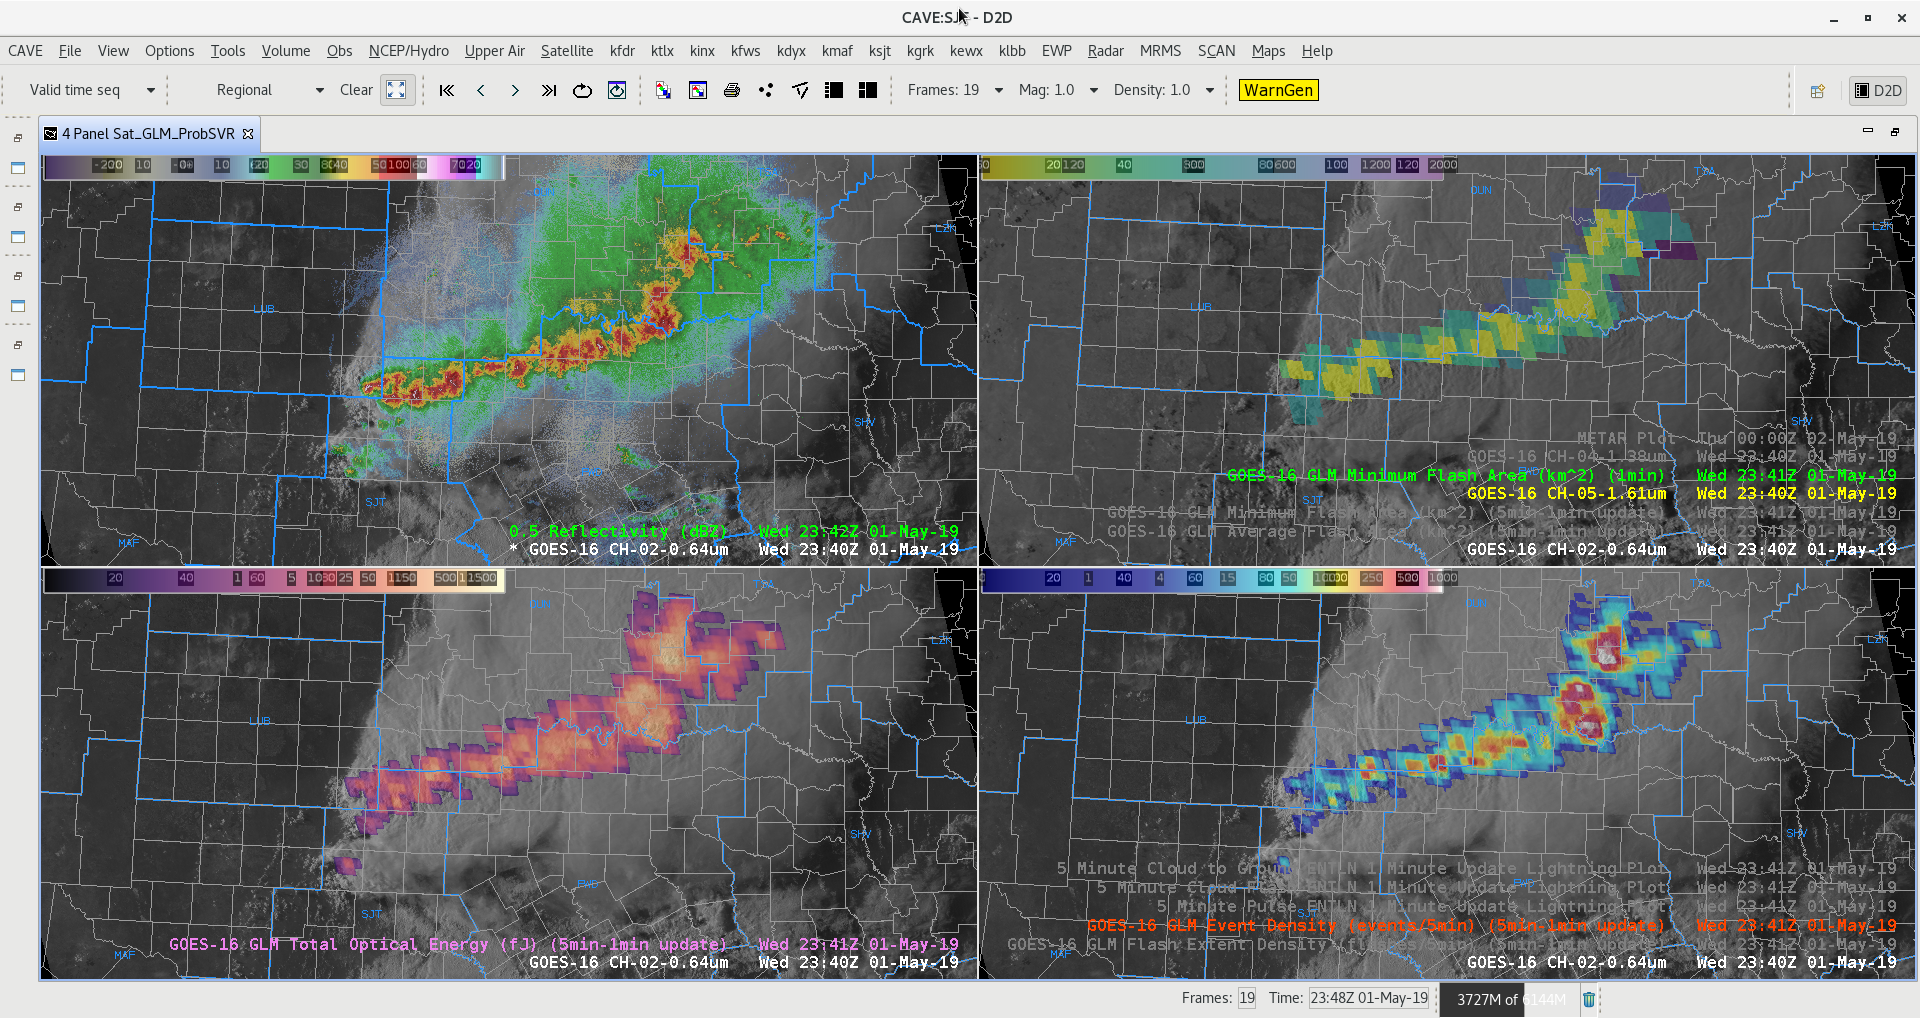
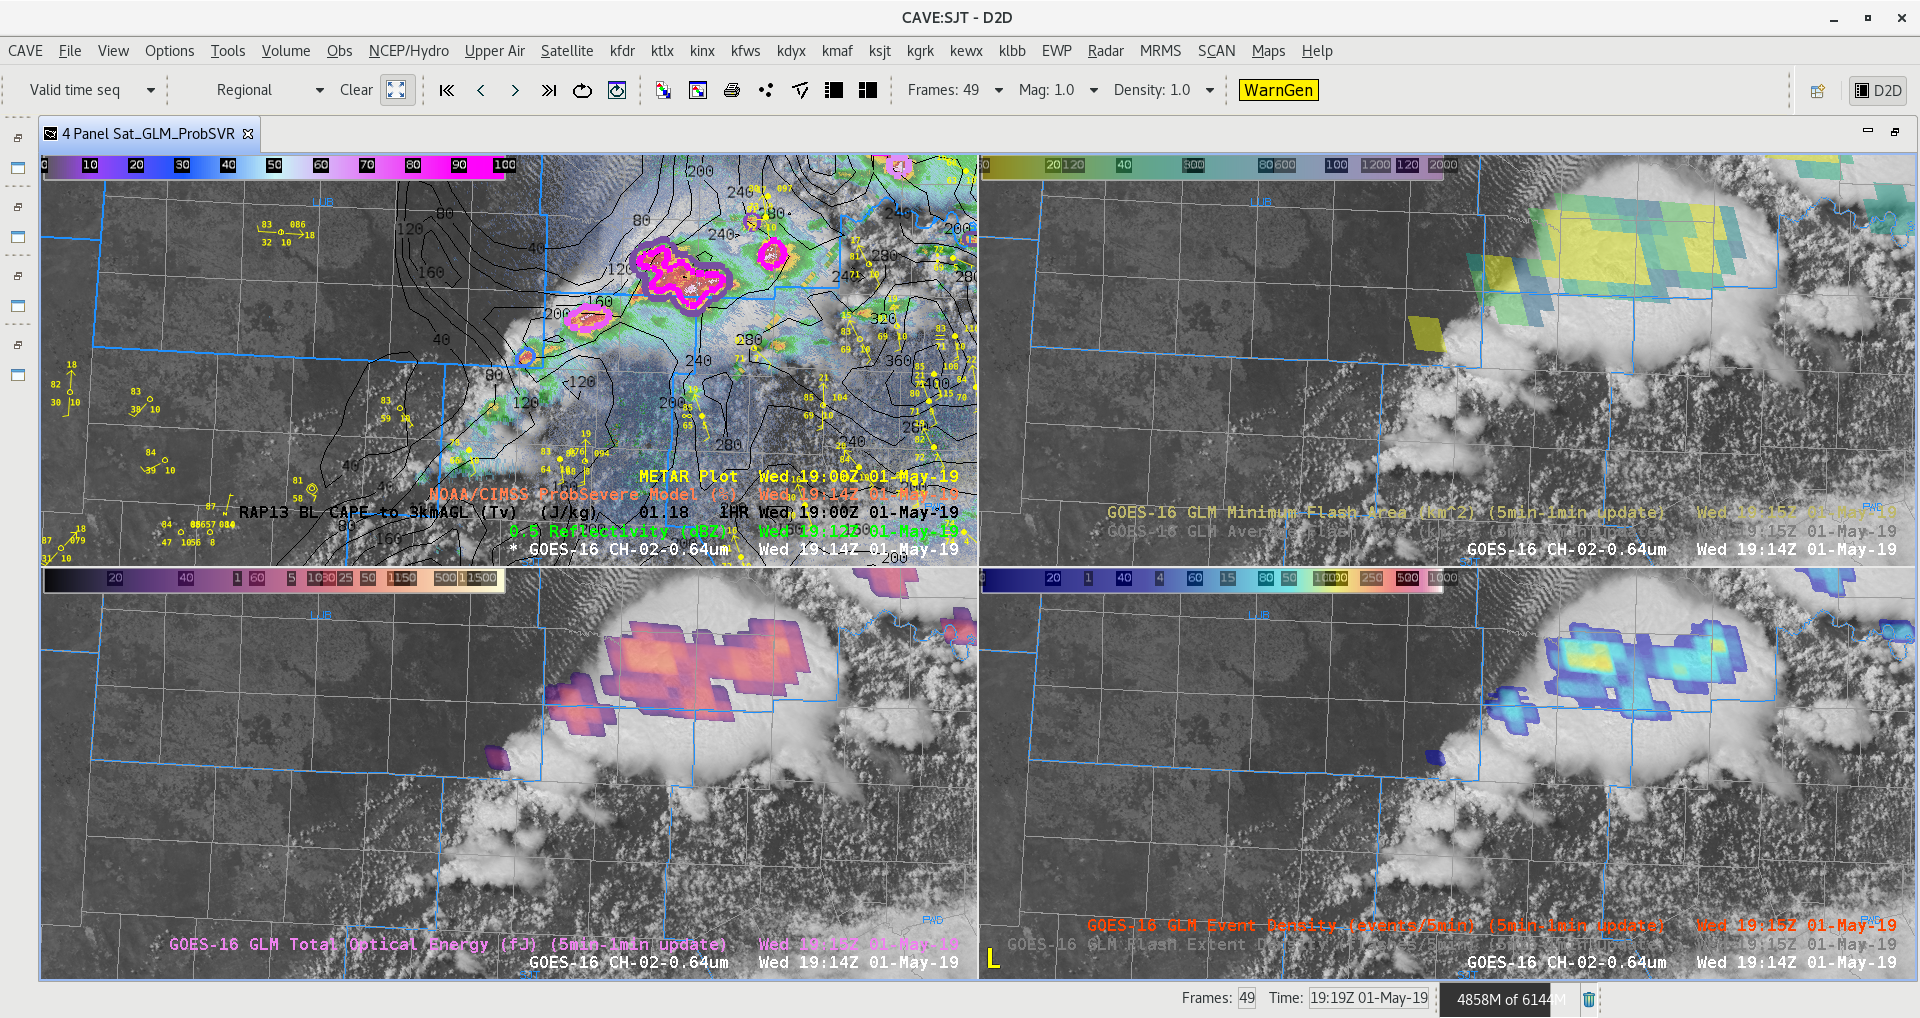
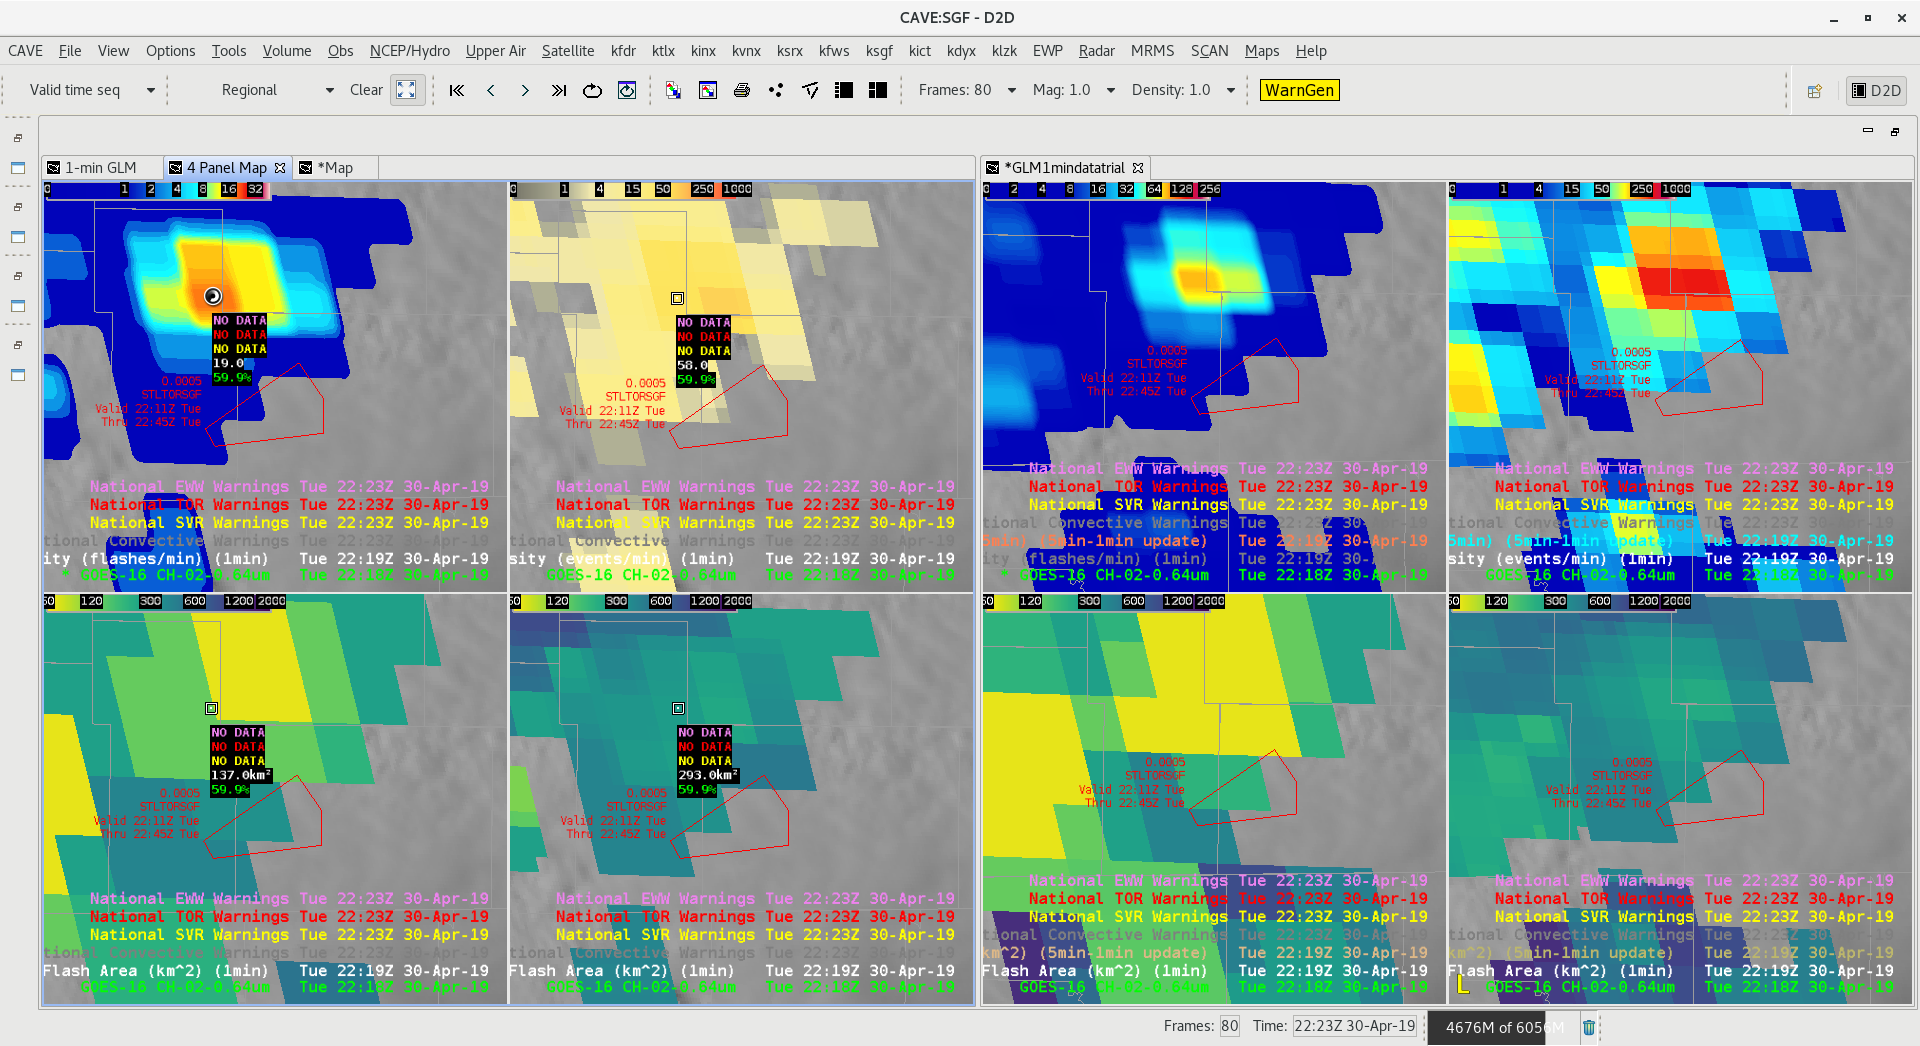
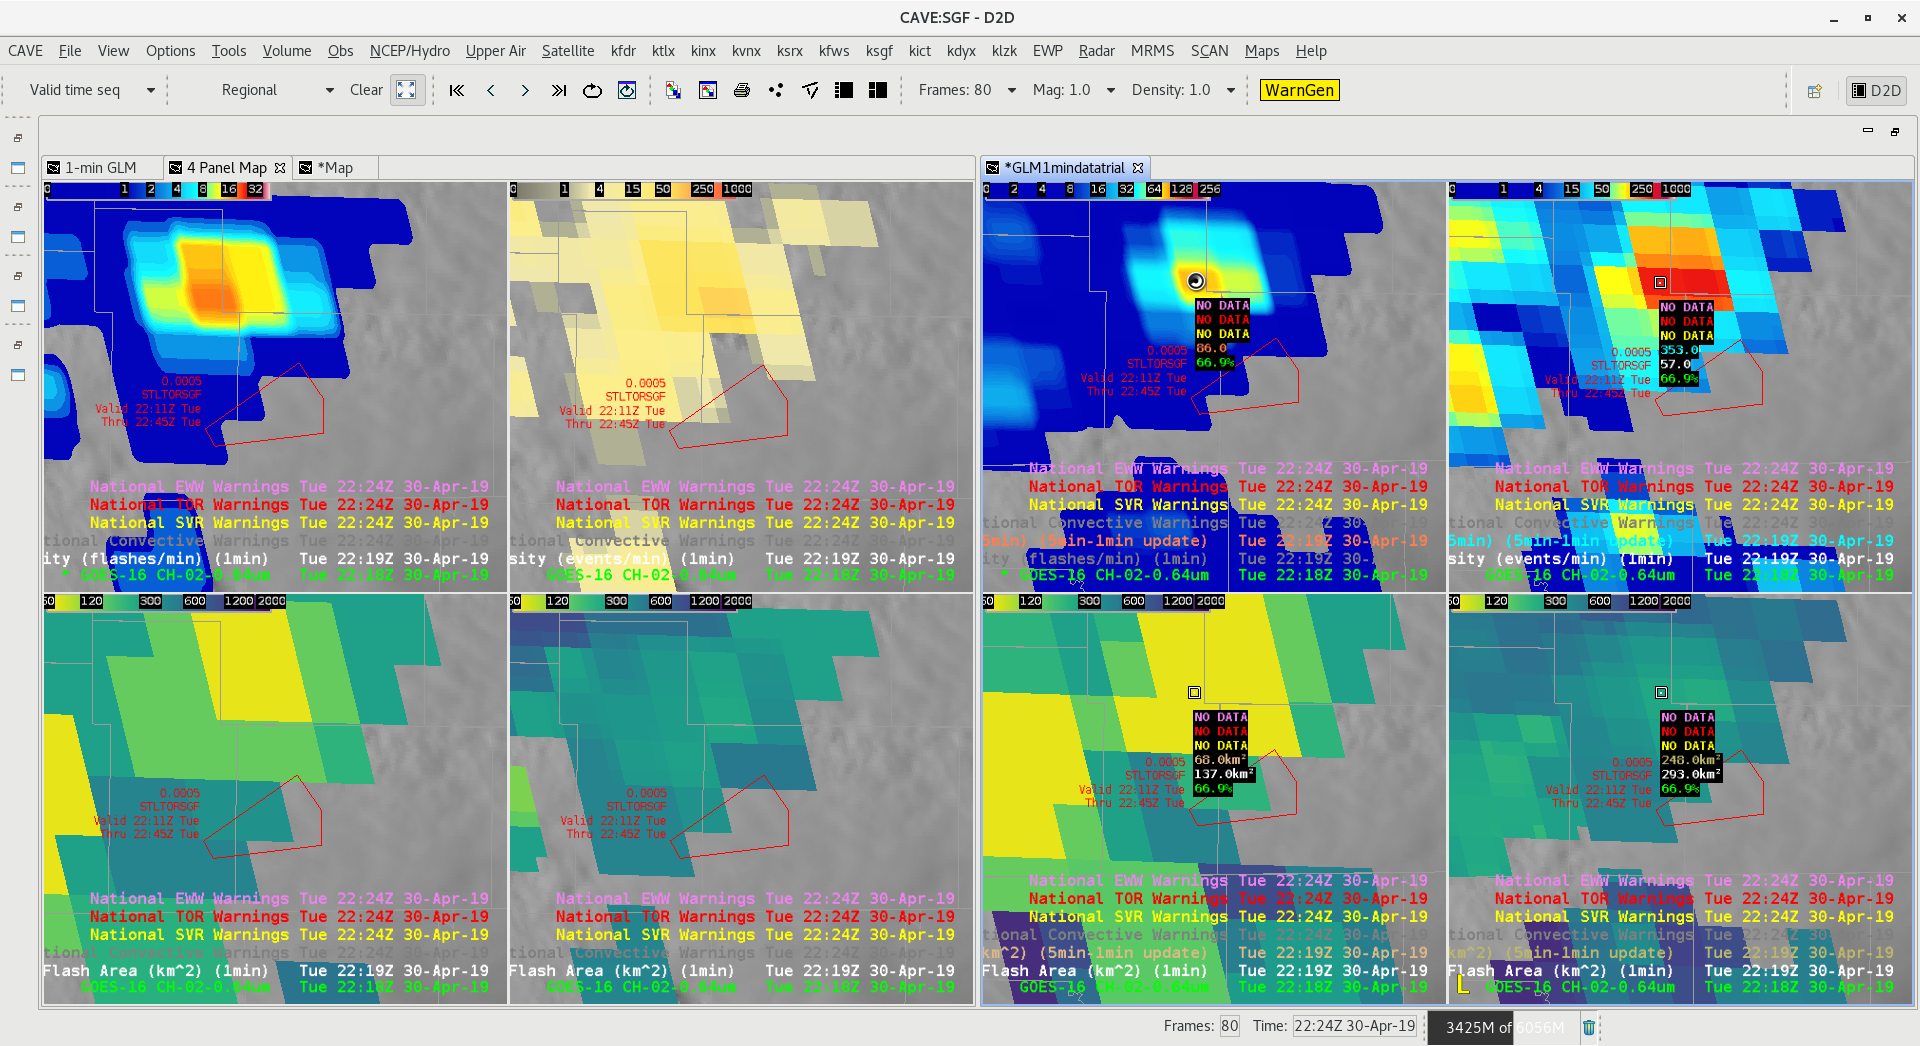
GLM detects lightning flashes in cirrus plume in light rain area north of main convective line. See cursor location in (Image 2) for the cirrus flash spreading northward. -Jake Johnson
Official websites use .gov
A
.gov website belongs to an official government
organization in the United States.
Secure .gov websites use HTTPS
A
lock (
) or https:// means you’ve safely connected to
the .gov website. Share sensitive information only on official,
secure websites.

Image 1
Image 2
GLM detects lightning flashes in cirrus plume in light rain area north of main convective line. See cursor location in (Image 2) for the cirrus flash spreading northward. -Jake Johnson
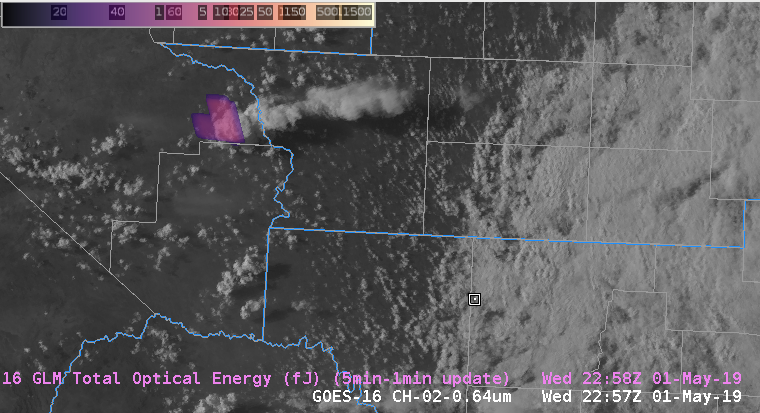
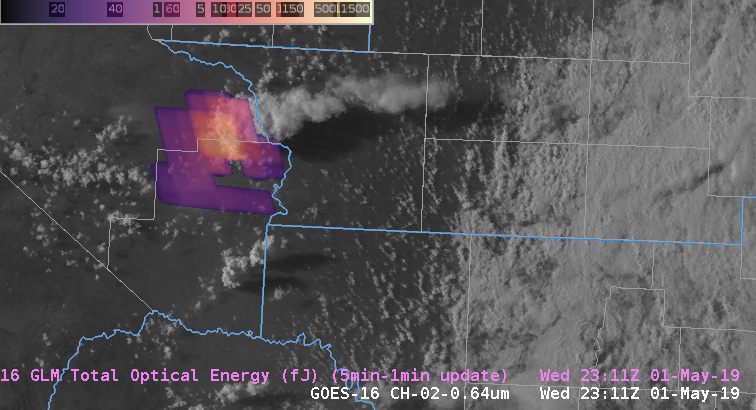
GLM Total Optical Energy product shows rapid increase of lightning in a 14 minute span for a developing thunderstorm in southwest Texas. This is useful information to forecasters for diagnosing storm intensification which usually precedes a response on radar. -Jake Johnson
Comparison of 1 min update GLM .vs. ground-based detection for new updraft tower.
Upper-Left is FED, Upper-Right is 1 min pulse ENTLN and Minimum Flash area, Lower-Left is 1min pulse ENTLN and TOE; and Lower-Right Average Flash area. First detected “pulse” is evident about 5 minutes prior to first GLM detections. Note that the initial pulses in a new updraft may not be associated with a “flash”. Also note the parallax error in the satellite-based detection. – Quik Twip
The storm split over Baylor county was seen in GLM. Higher flash rates remained with the right mover. The average flash area remained small through the transition but eventually some larger flashes were observed in the right mover.
There was also a significant lightning increase with the right mover, from 20 fl/5-min to over 80 fl/5-min in 10 minute period.
— SCoulomb
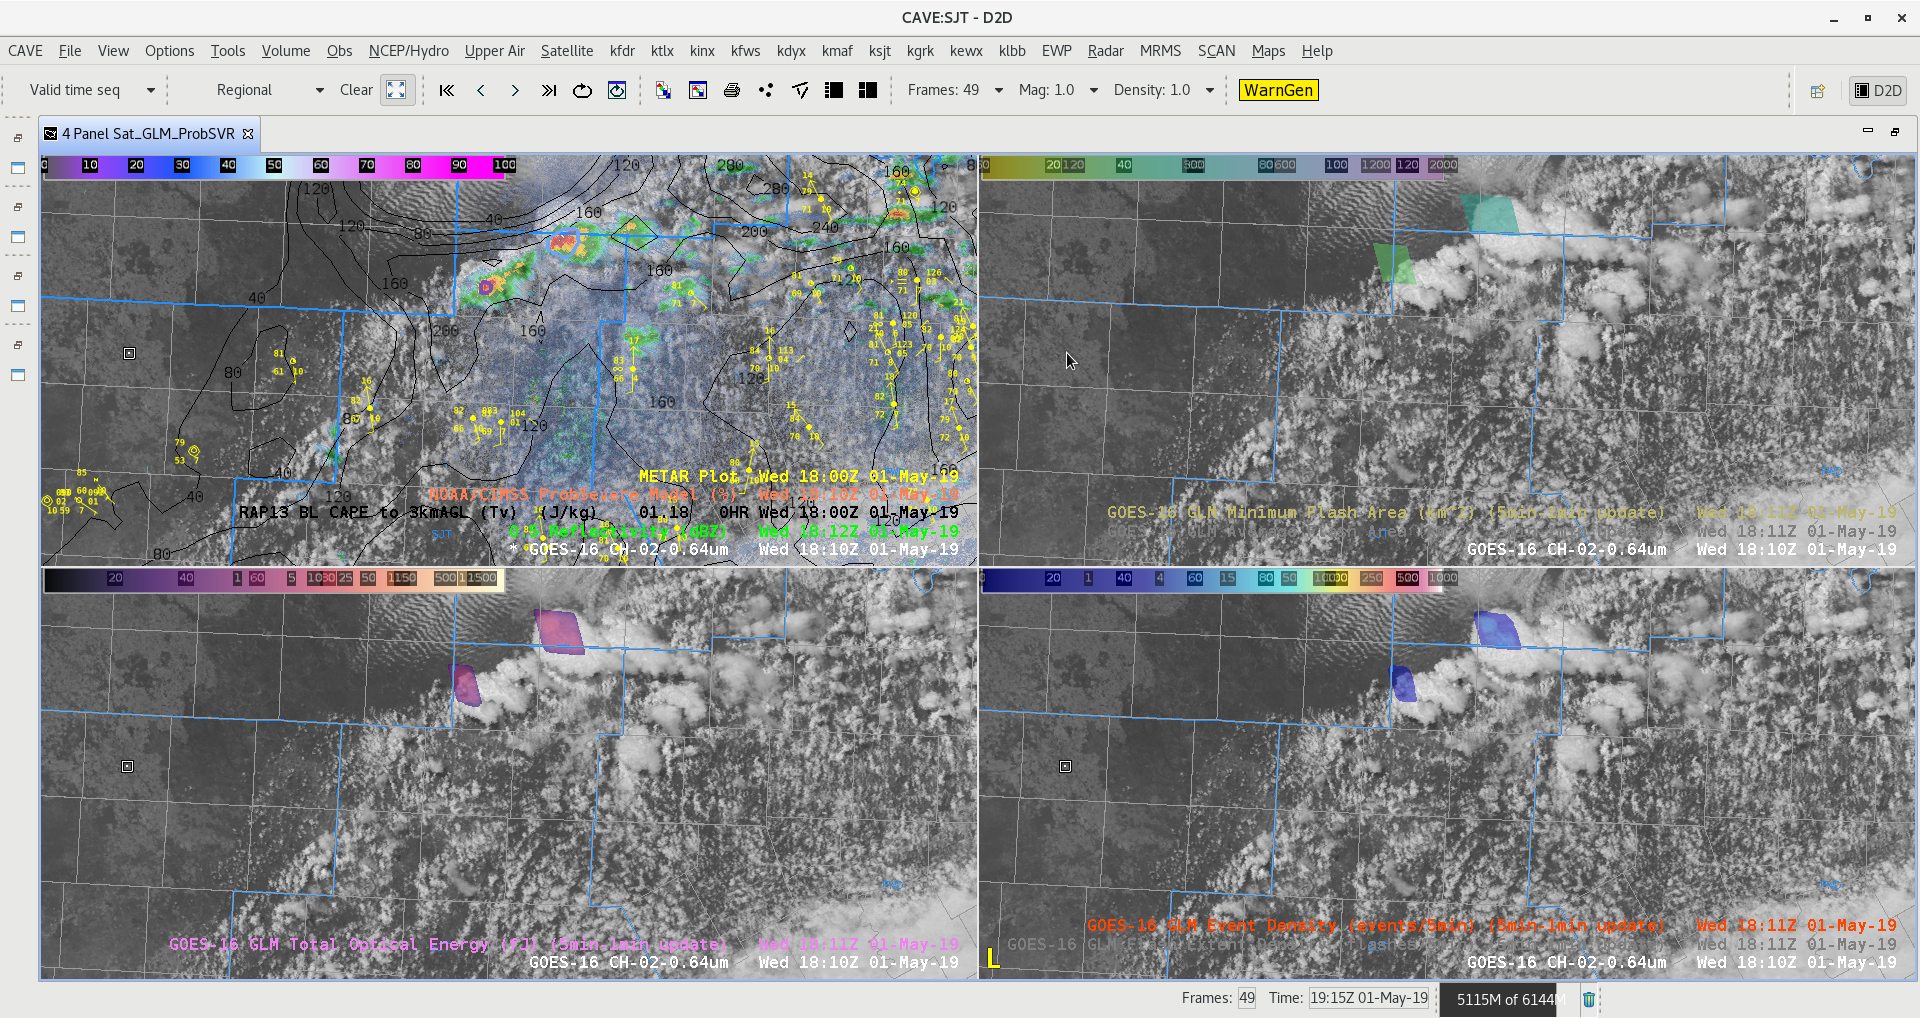
Figure A
Lightning and ProbSVR detection of first storm develop in west Texas. GLM products high-lighting two updrafts at 1810Z in Figure A.
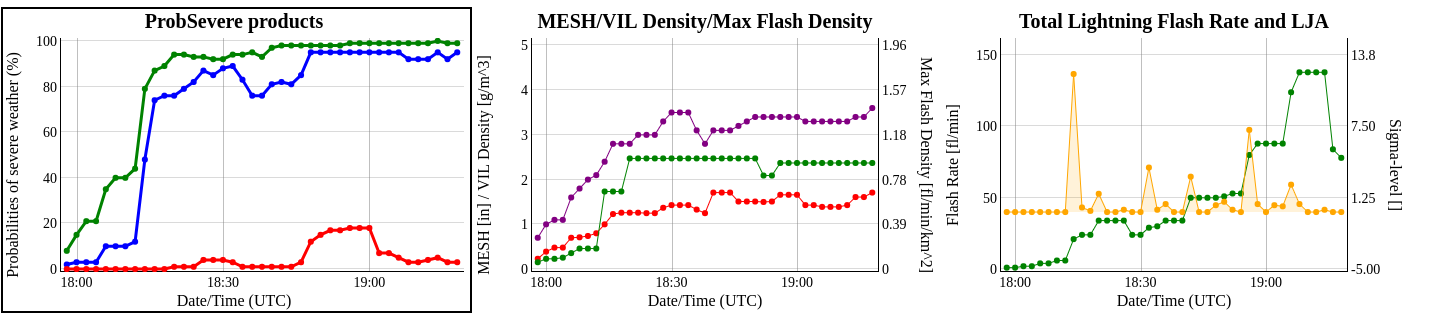
Lightning really increased showing lightning jumps and ProSVR Hail/Wind greater than 90% in time series trends. Notice Tornado trend increased slightly with lowering wall cloud report, however environment is not as favorable for tornadoes today with 0-1km shear on the low end.
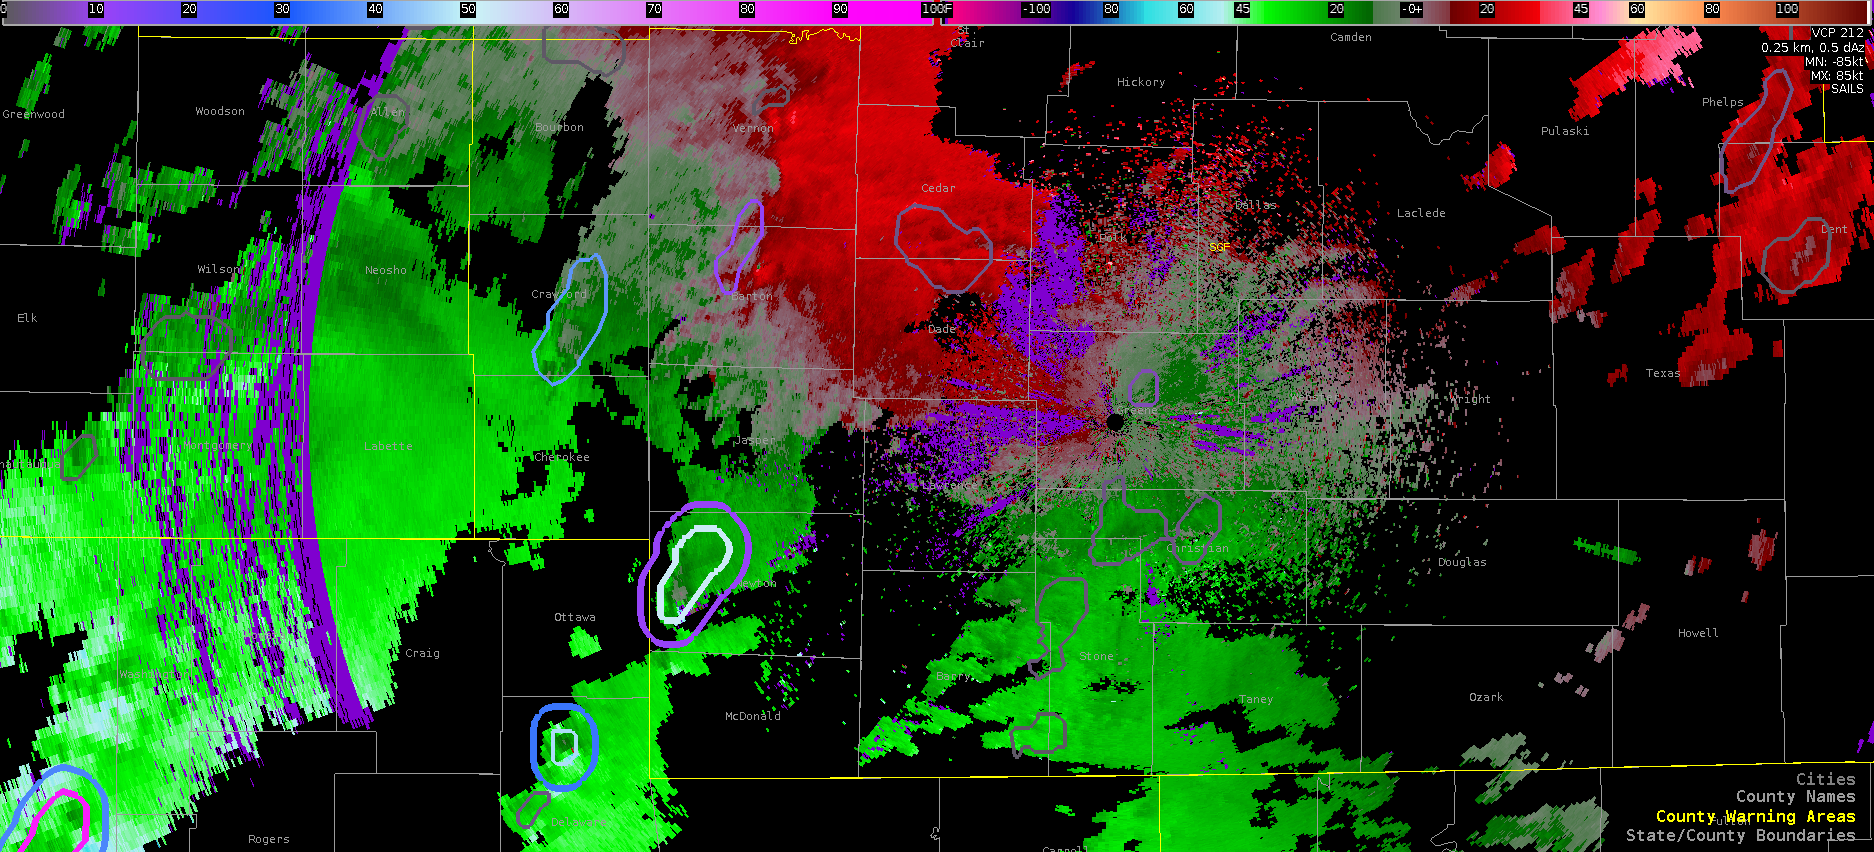
Feature following zoom showing the GLM pulsing phenomena associated with intensification/weakening of a supercell in OK/MO. During the third pulse, a TOR warning was issued.
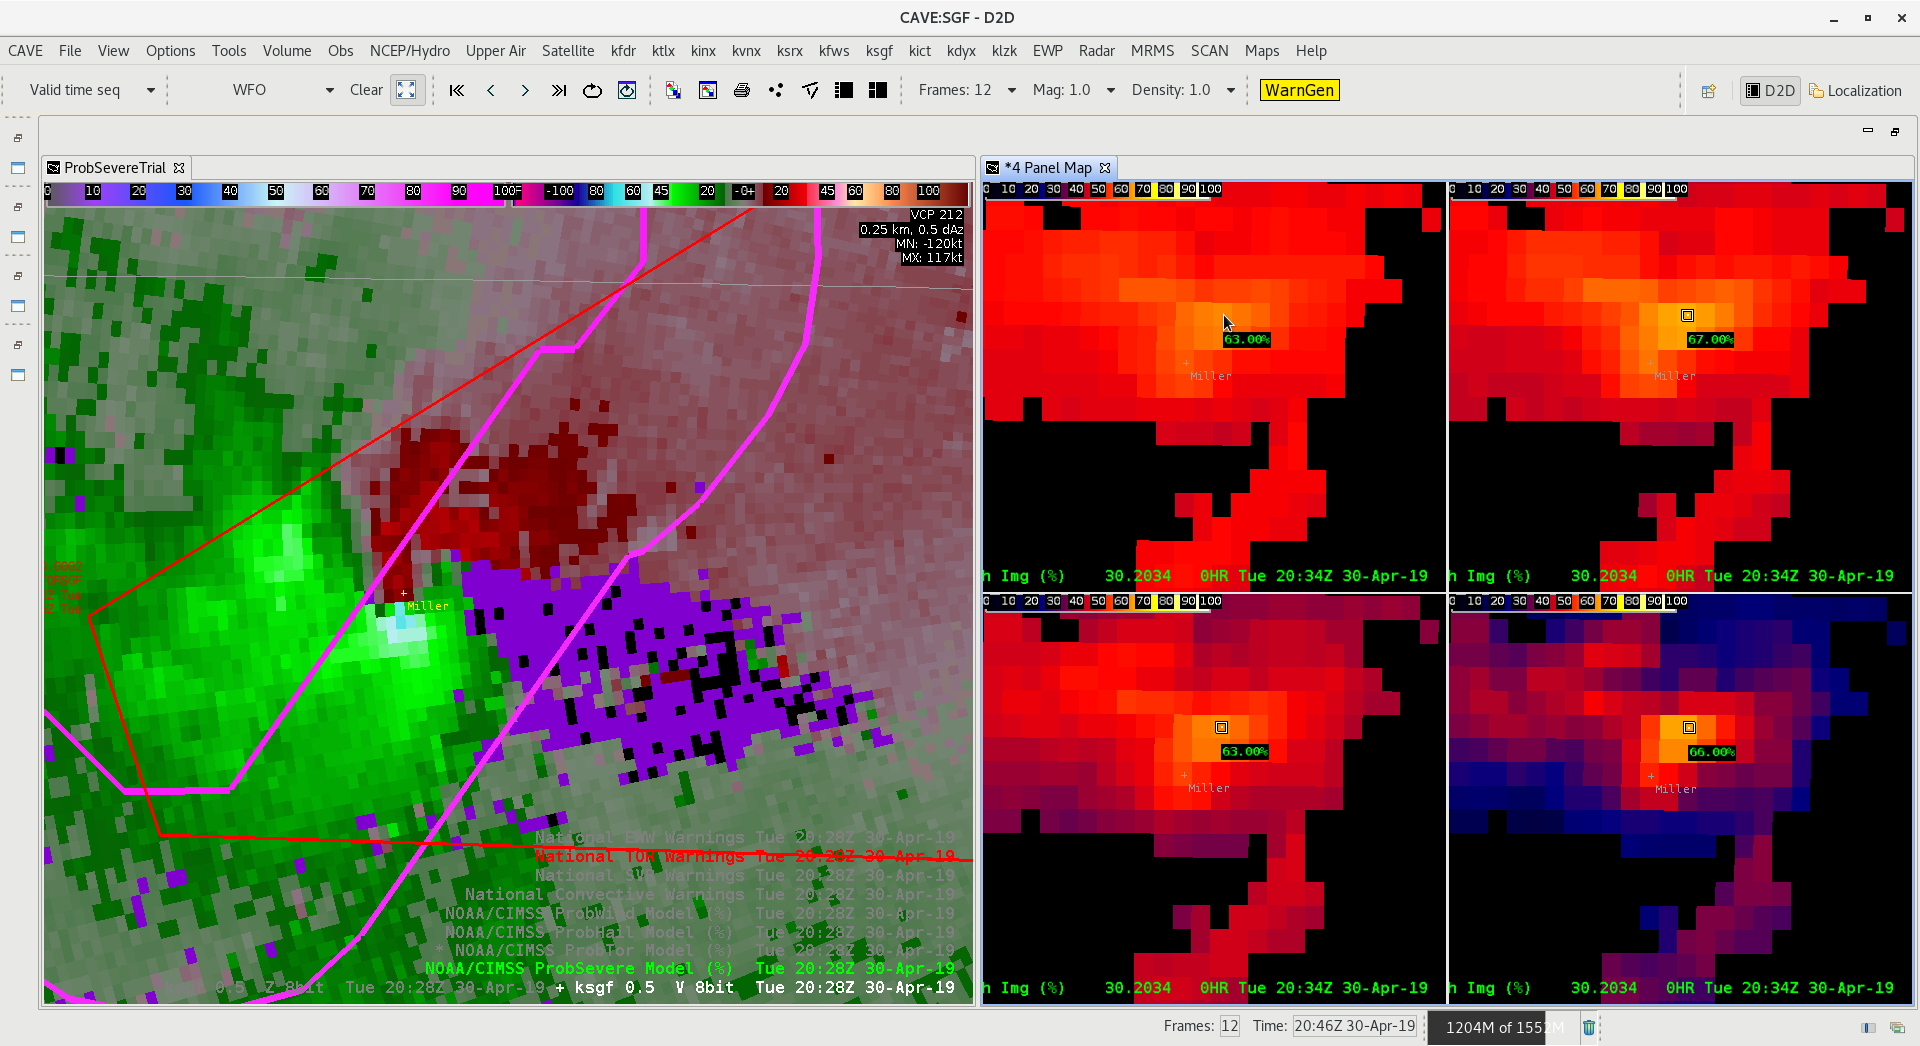
Case of CPTI values on a confirmed tornado near Miller, MO. No confirmed damage estimates yet, but TOR was confirmed at this time visually and with a TDS
Lightning jump preceding a tornado and then confirmed touchdown in MO Event Density over the same cell
 Minimum Flash area showing updraft core
Average Flash Area
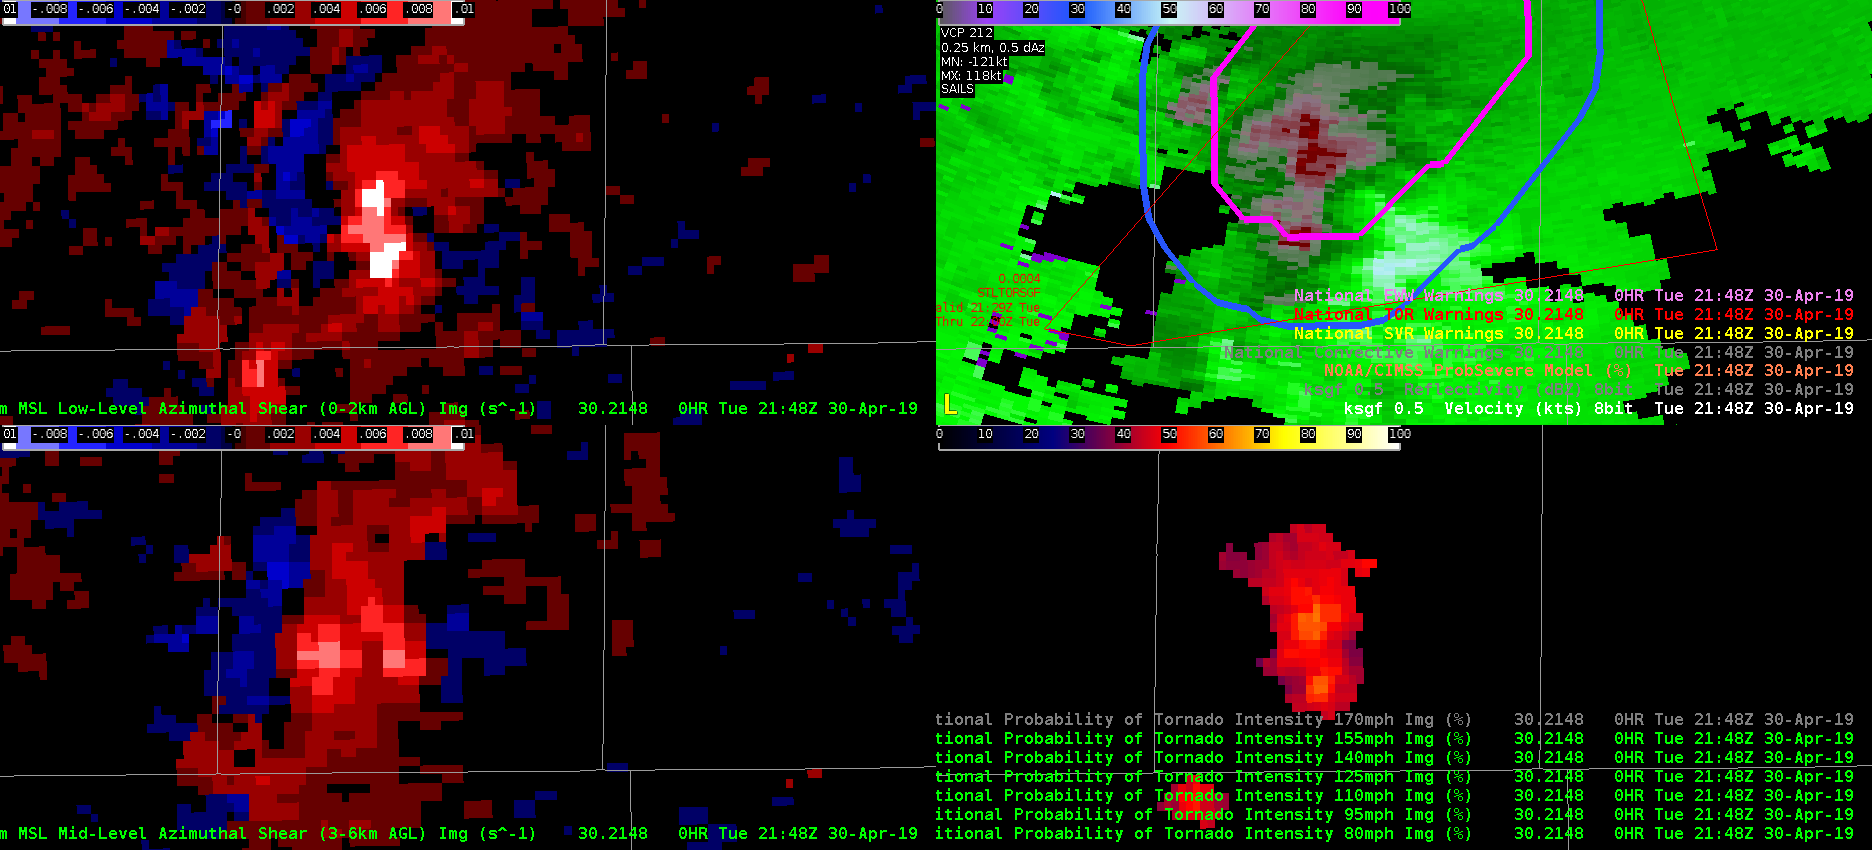 This is a case where AzShear overdid the tornadic threat This supercell had a circulation that never really tightened up. ProbSevere also vastly overestimated the tornado threat, likely due to nearby storm interactions and mergers. When convection gets messy, can we rely on these products as much?
The two images above compare a 4 panel of 1 min GLM data (left four panels) versus 5 min data (right four panels). While the 5 min data was much smoother to view from an animation and trend sense, the 1 min data did provide some fine temporal resolution help during periods of rapid storm intensification preceding this tornado warning.
The above two loops compare 1 min looping (top 4 panel) versus 5 min looping (bottom 4 panels). In a loop the ‘flashy’ nature of 1 min data makes it less desirable in operations, however manual toggling and advancing still make this data useful.
GLM FED maxed out at 160 fl/5-min and TOE at 580 fJ on this cell in southern MO. It would be nice to have the maximum value, at least for the FED and TOE products in the upper left corner like the ground-based networks have. This would also help with quantifying things such as lightning jumps or quickly comparing two cells.
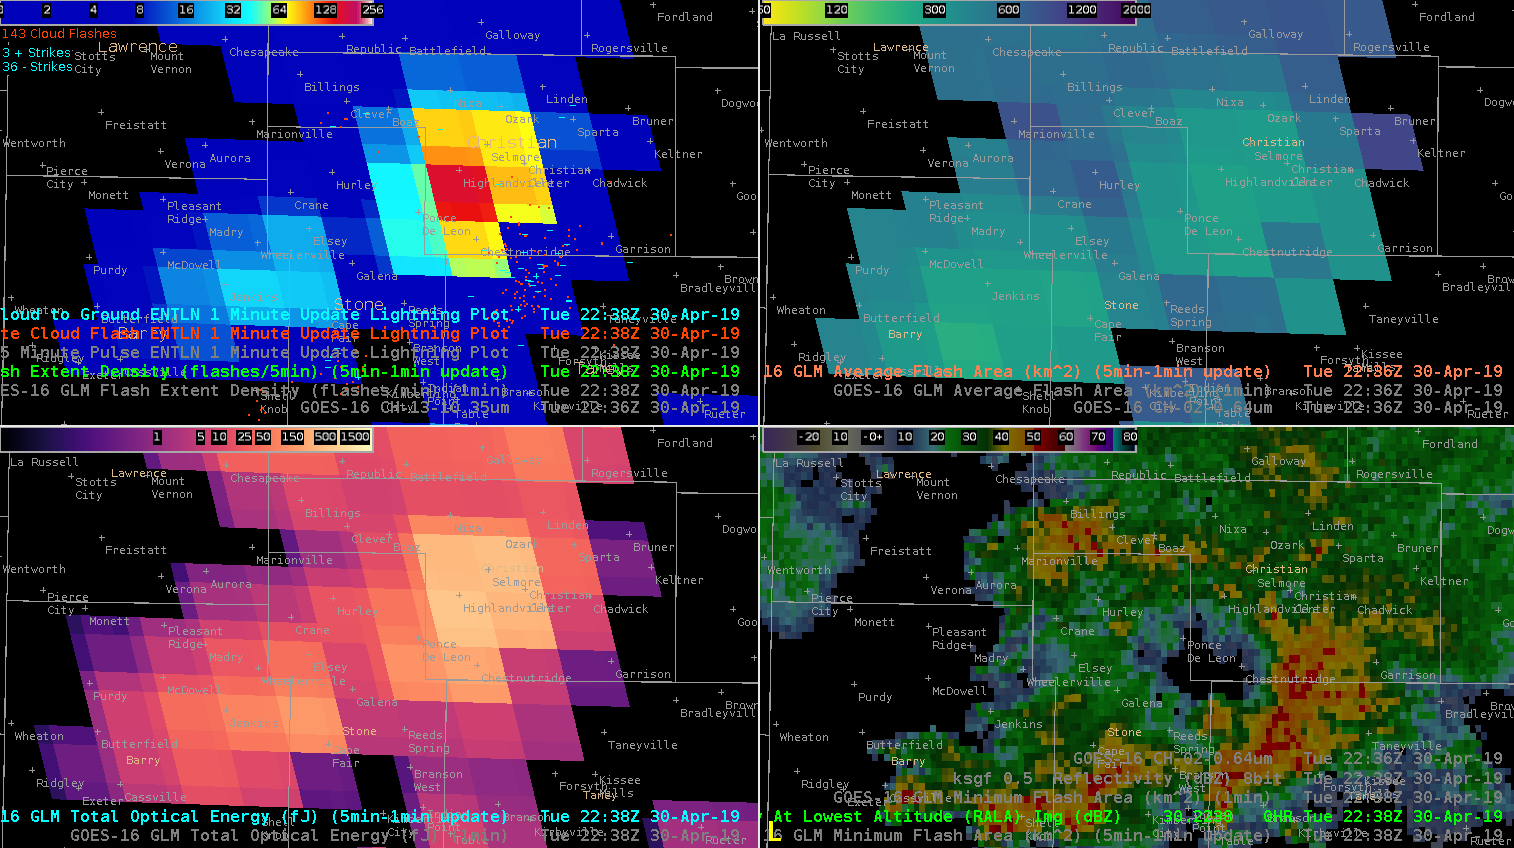
GLM FED (UL), AFA (UR), TOE (LL), RLA (LR)
— SCoulomb
This rapidly developing supercell displayed a GLM lightning decrease as it intensified. This was a good example of optical attenuation due to an updraft core. ENTLN network is displayed, showing that there was a tremendous of CG and IC flashes despite low GLM values. Shown is the TOE product.
The same storm and lightning minimum shown in Event Density.
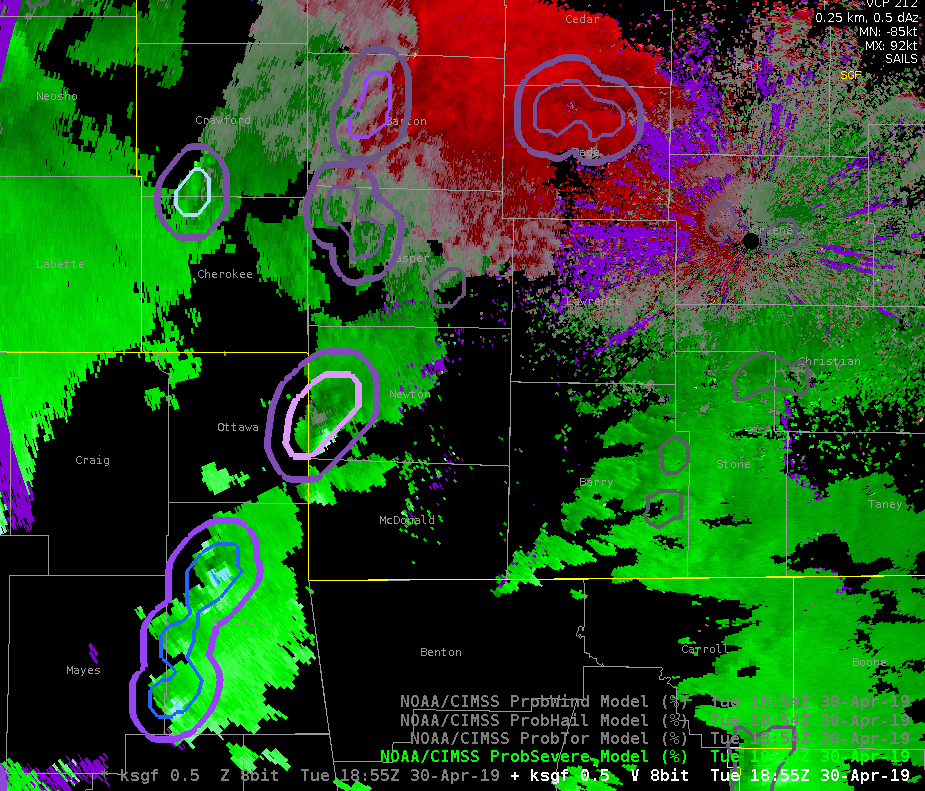
ProbTor was occasionally too aggressive. Only one of these storms was really concerning at this time given the environment and radar tilts further up in the volume. On a day like this, it would likely be prudent to increase the probtor threshold above 3%
Prob Tor contours showing a new probtor threshold of 10% instead of 3%. This was edited on the fly in the localization file of the procedure itself. This view shows a less cluttered display given the amount of rotating storms this day.
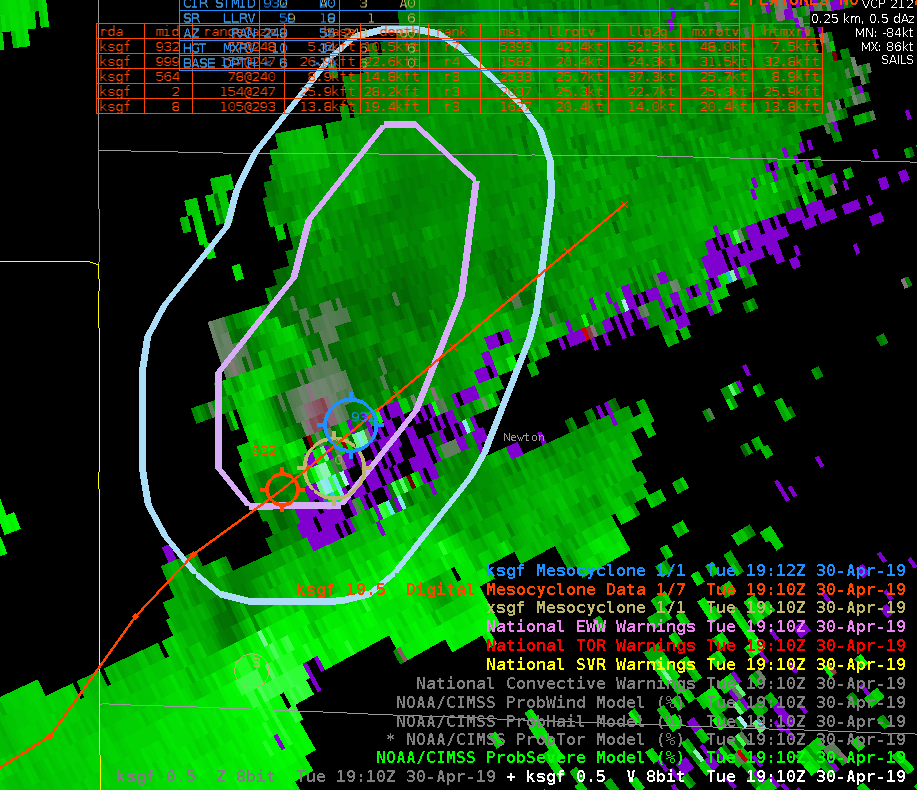
Comparison of MDA products over a weak low topped supercell, as well as showing the probsevere contours. ProbTor was at 47% at the time, prompting the issuance of a Tor Warning.
This wide view of GLM shows the typical small number of very large flashes in the trailing stratiform region across KS and MO. Smaller more numerous flashes, also brighter in TOE exist along the front across central OK into northwest TX. The more discrete cells along the stationary front in southern MO are also evident with the greater flash rates, smaller flashes and brighter appearance in TOE.
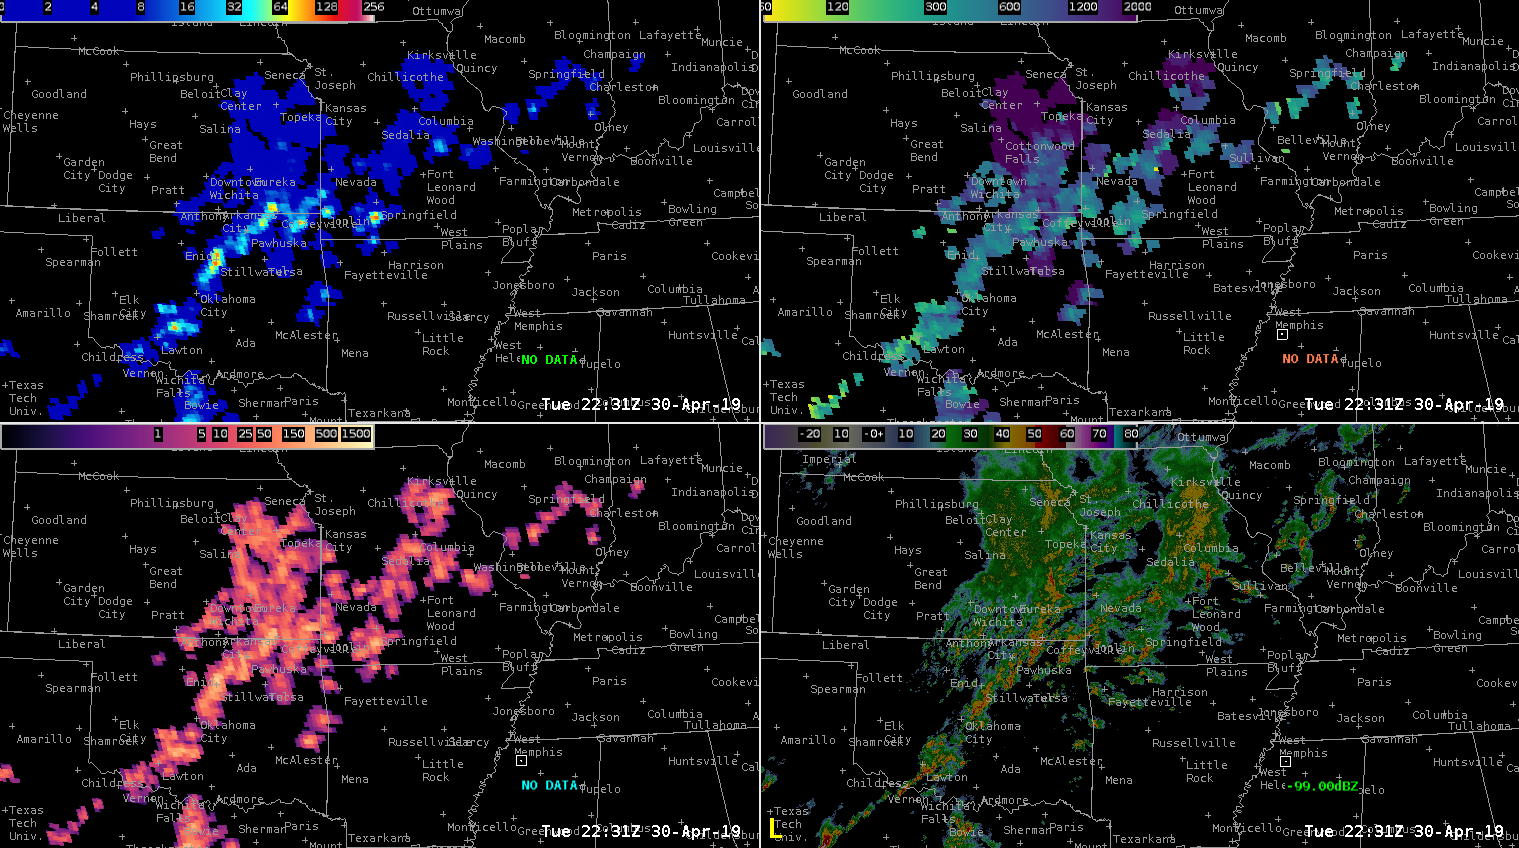
GLM FED (UL), AFA (UR), TOE (LL), RALA (LR)
— S COULOMB
Looking at GLM for GOES-W in Full Disk (L) and GOES-E in meso sector (R) the flash extent density and average flash area compare well to one another. Max FED values were 62 and 64 fl/5-min respectively. They also showed similar overall footprint with even the smallest flash values. Parallax is obvious with the peak values separated by ~15 mi at this longitude.
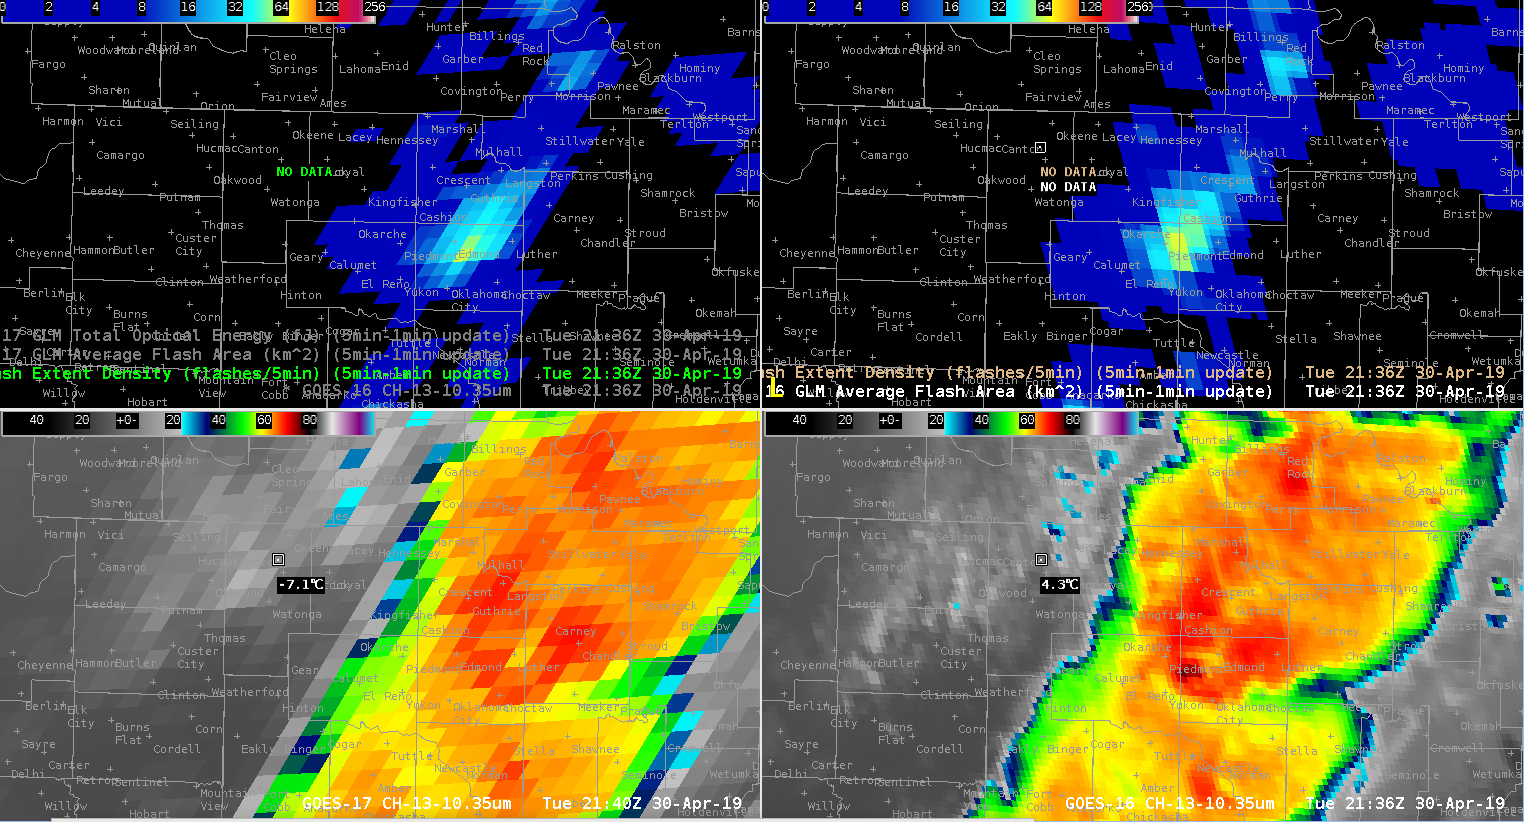
GLM FED from GOES-W full disk (UL), GLM FED from GOES-E meso sector (UR), 10.3 um from GOES-W full disk (LL), 10.3 um from GOES-E meso sector (LR)
— S Coulomb