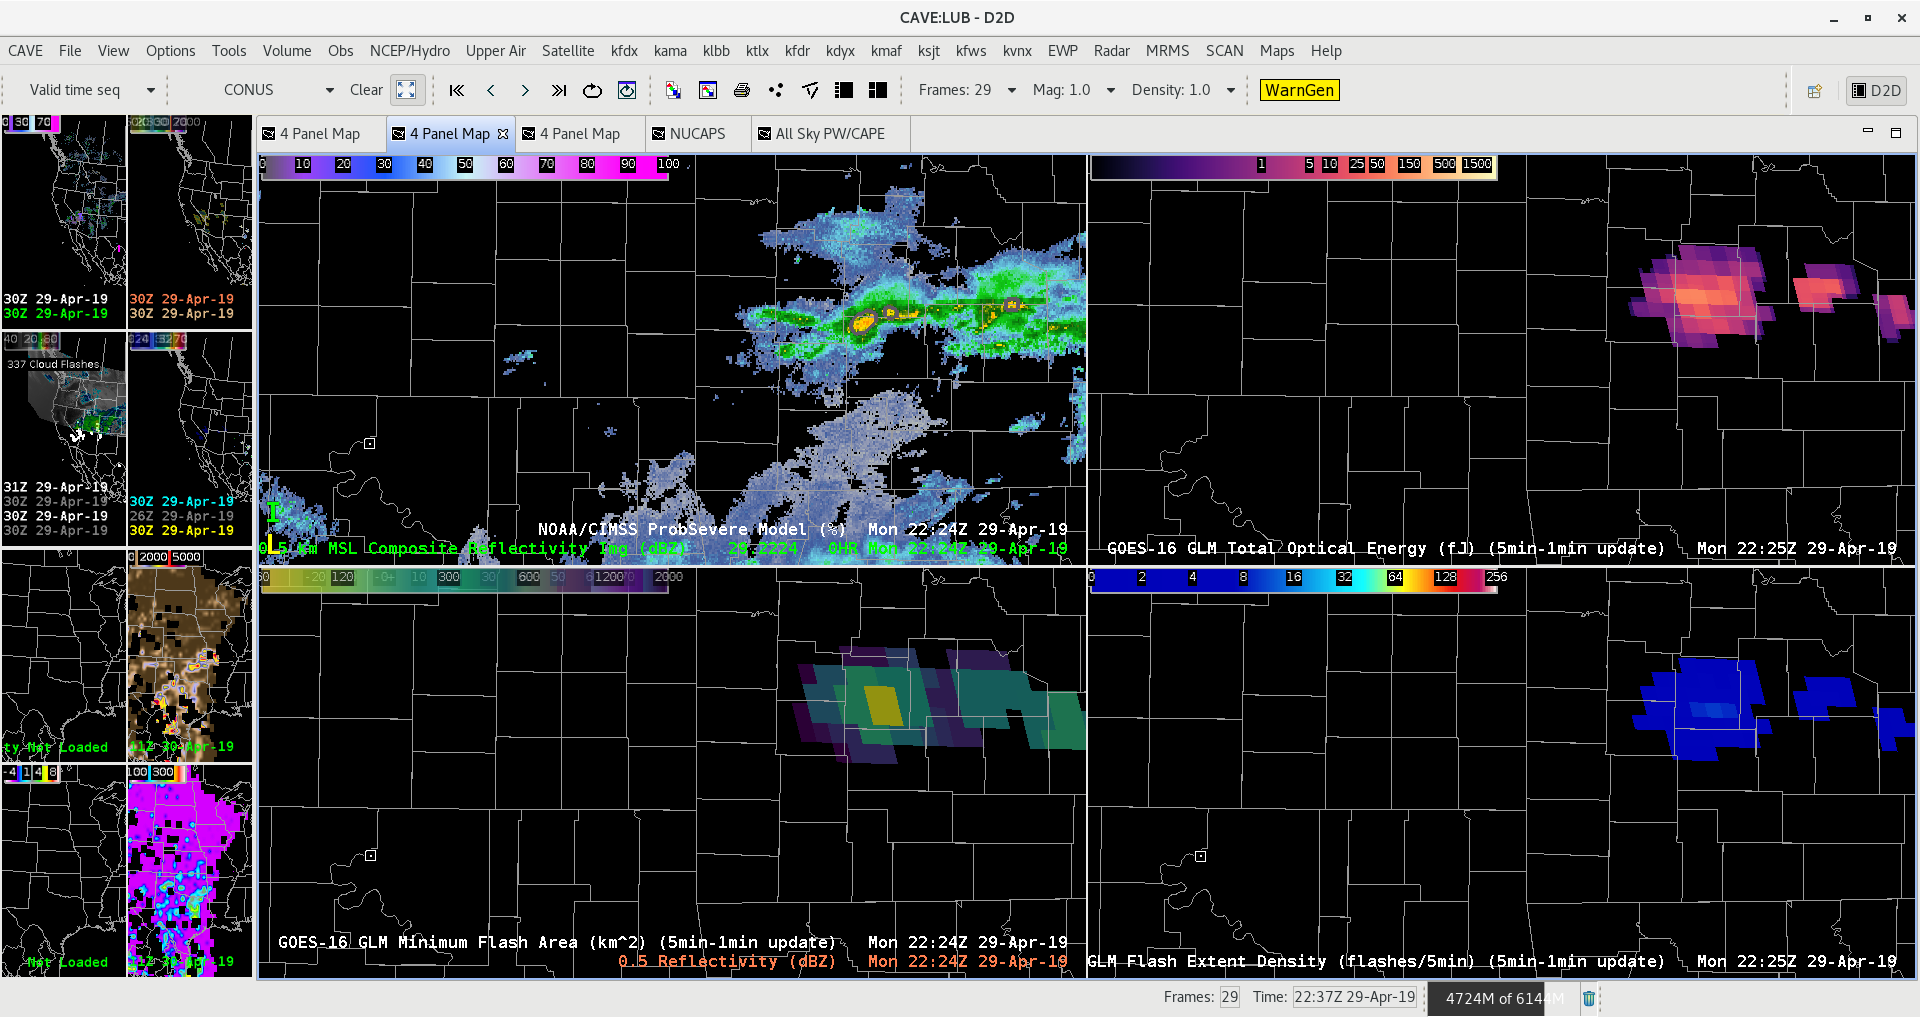
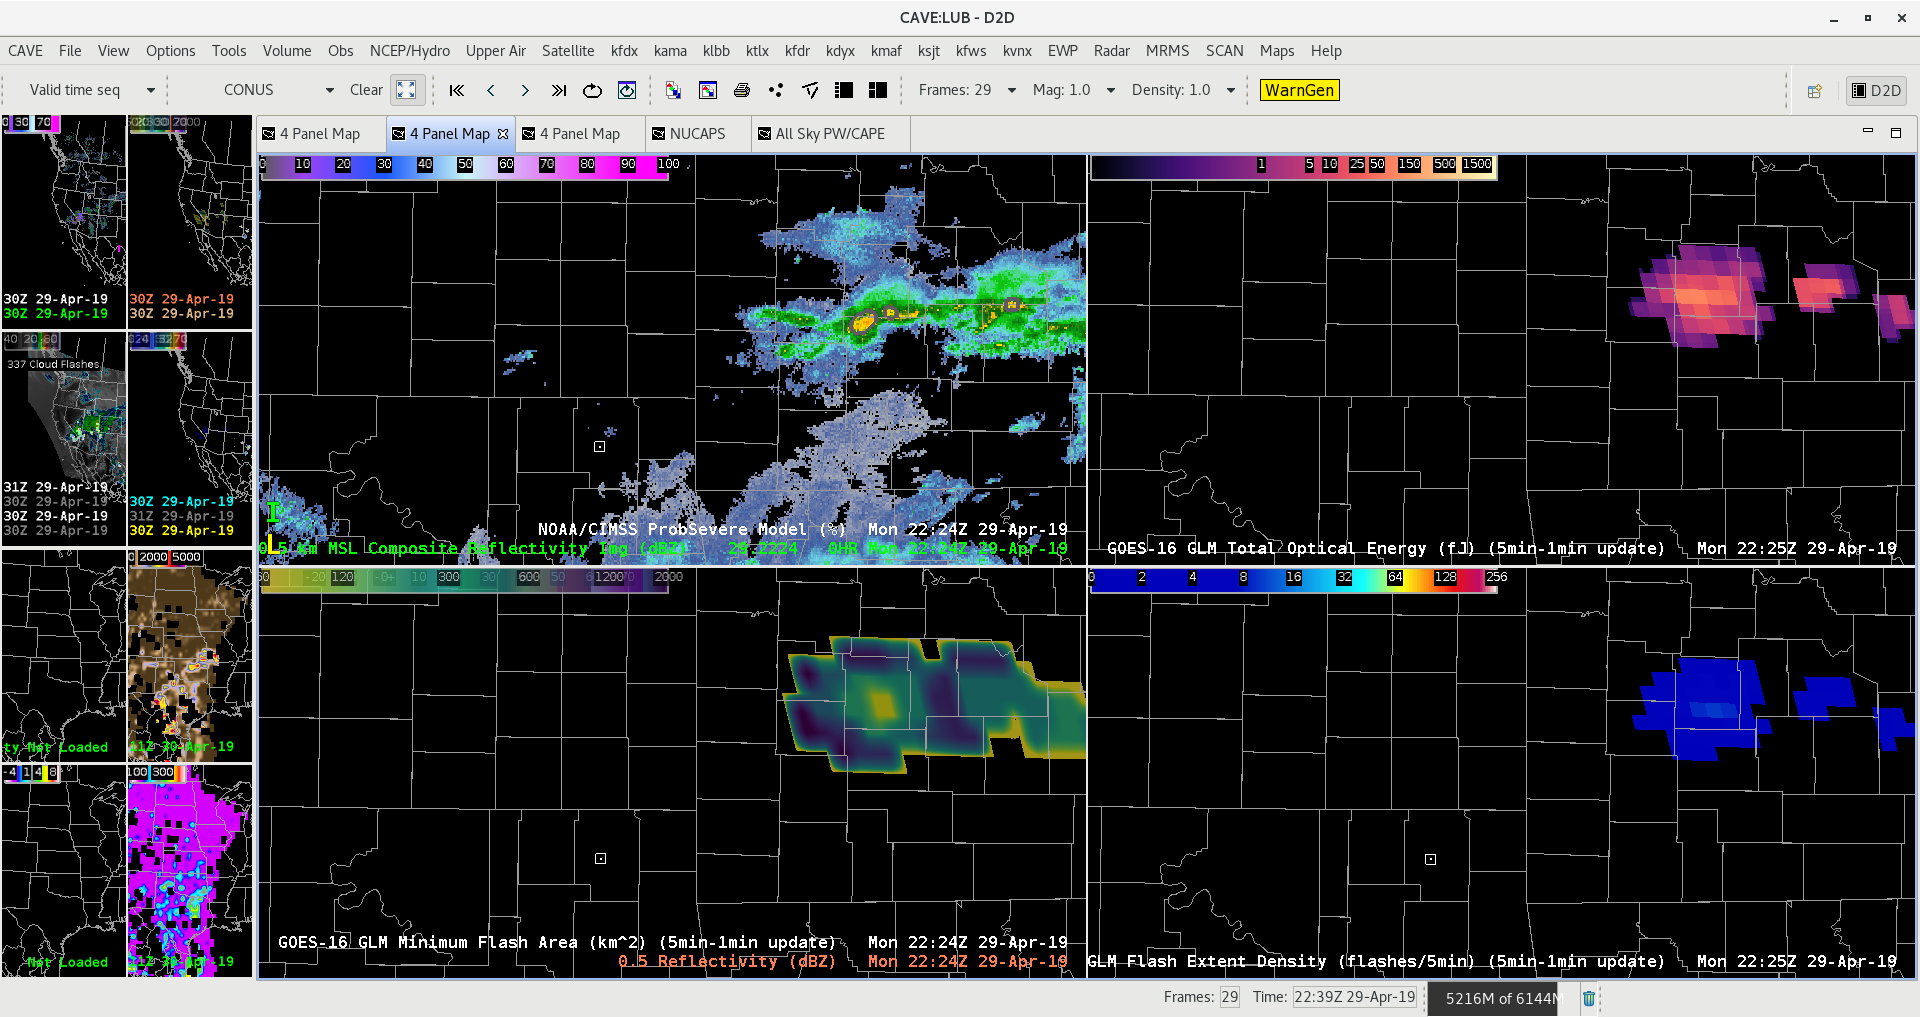
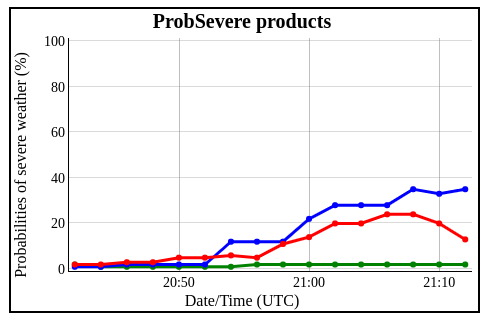
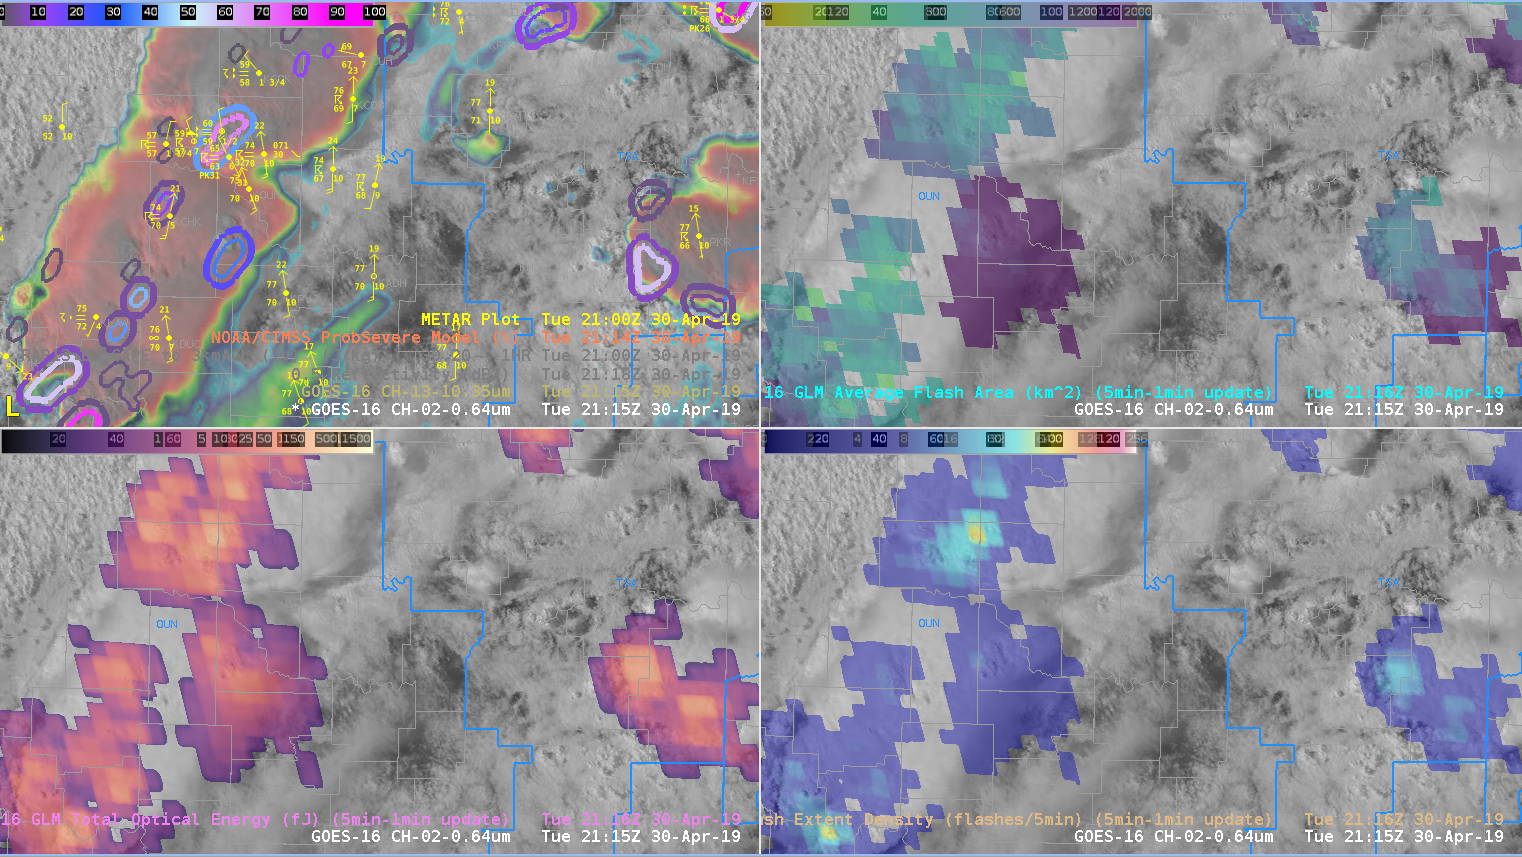
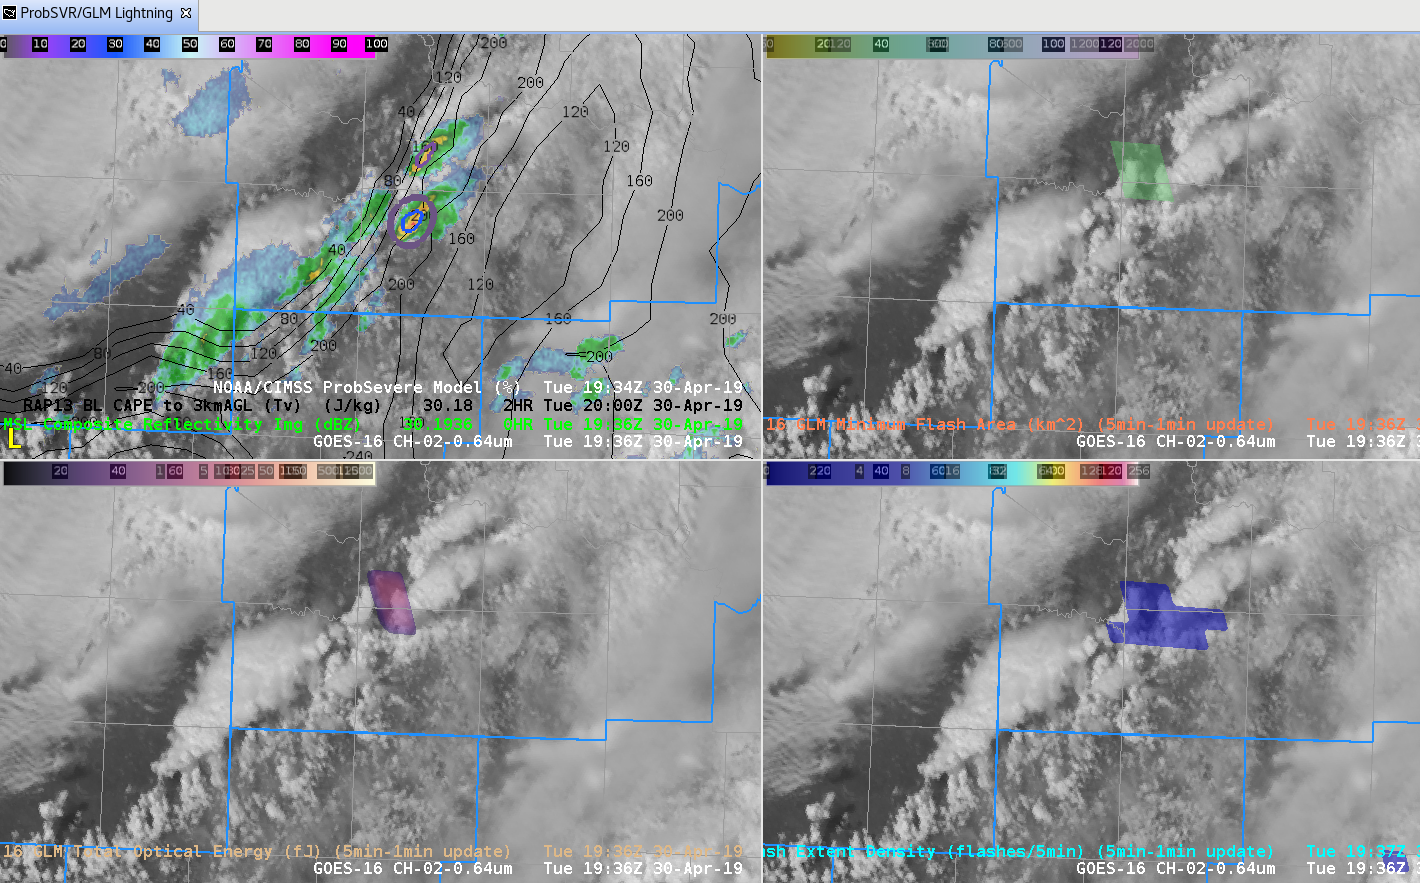
Beginning to see CI in the southwest portion of OUN’s CWA. ProbSevere has progged a 3-4% tornado probability for two areas: the SW storm and a few weaker/young storms in the central CWA. GLM minimum flash area along with total optical energy clearly indicate that the SW storm is the most promising of the two with more persistent updraft(s). Subsequently, 0-2km merged AzShear has perked up with the storm in the southwestern portion of the CWA. Given the storm’s favorable environment (ample 0-3km CAPE, bulk shear, and SRH), this storm warrants watching. Based upon the combination of GLM data, ProbSevere/AzShear, and 1 minute satellite imagery, a forecaster can quickly hone in on the most pressing storms at the moment.
–Stanley Cupp
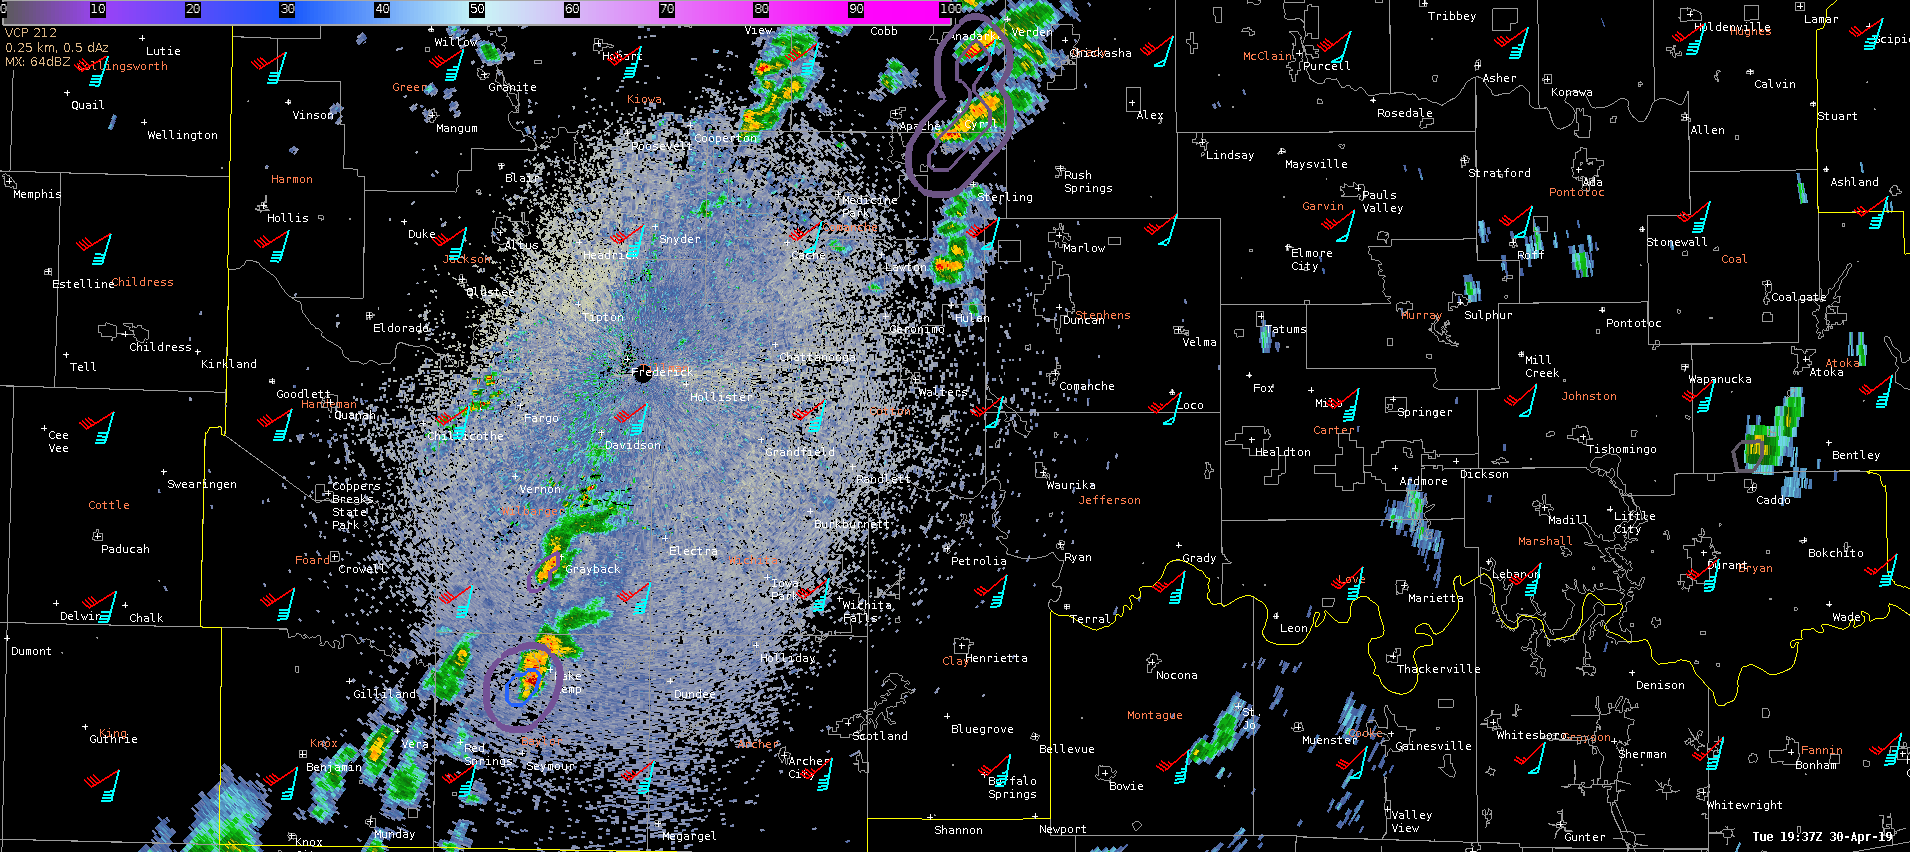
1937z KFDR base reflectivity with ProbSevere overlays (double contour –> tornado prob progged)
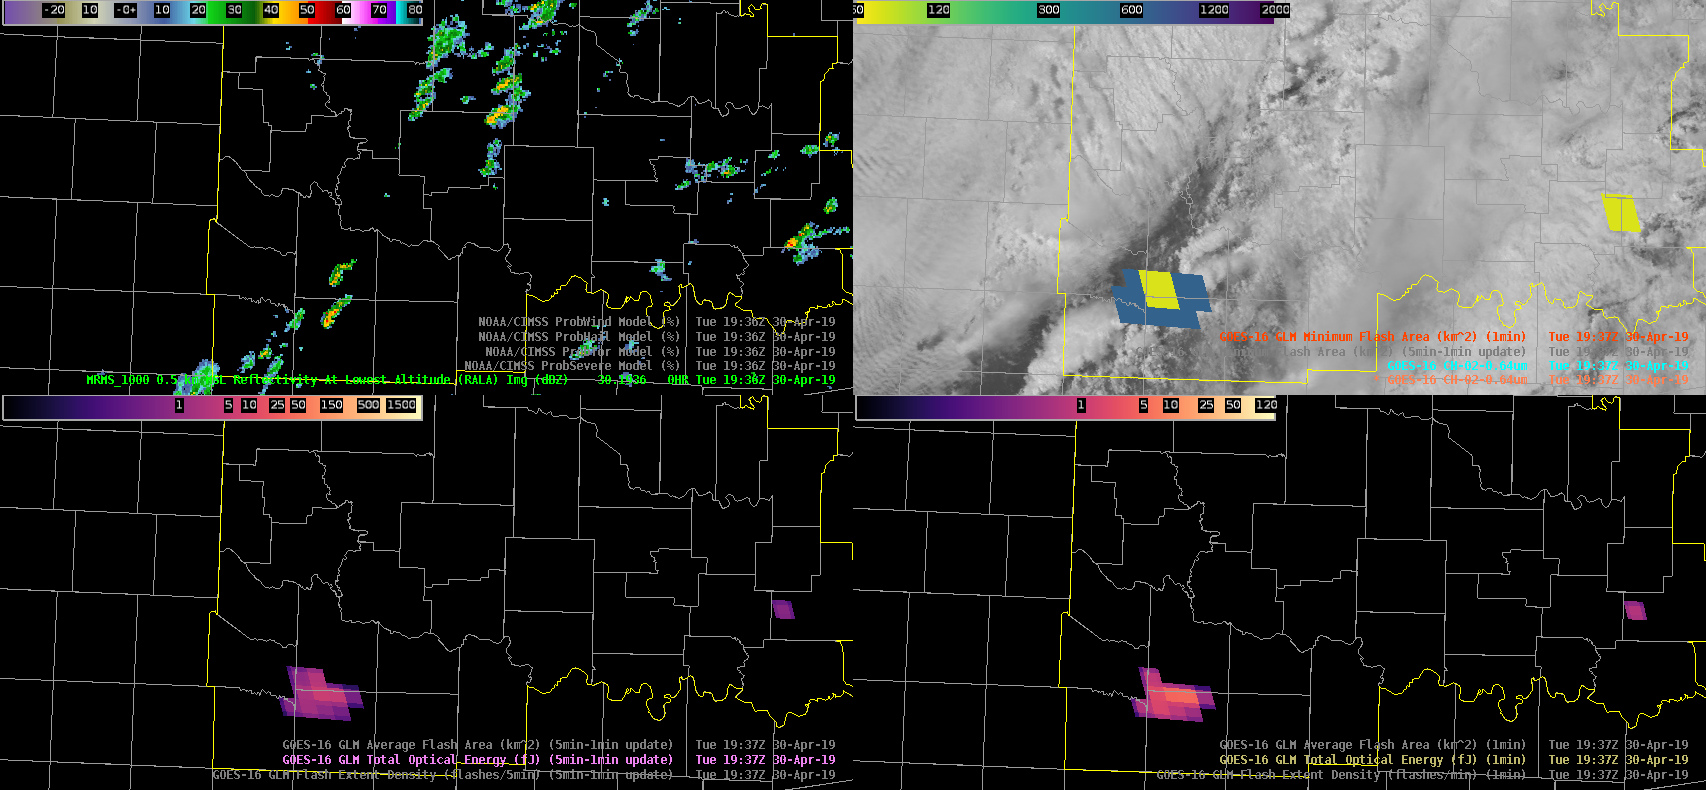
Top left: MRMS RALA; Top right: visibile sat plus 1 minute minimum flash area; Bottom left: 5 minute total optical energy w/ 1 minute updates; Bottom right: 1 minute total optical energy
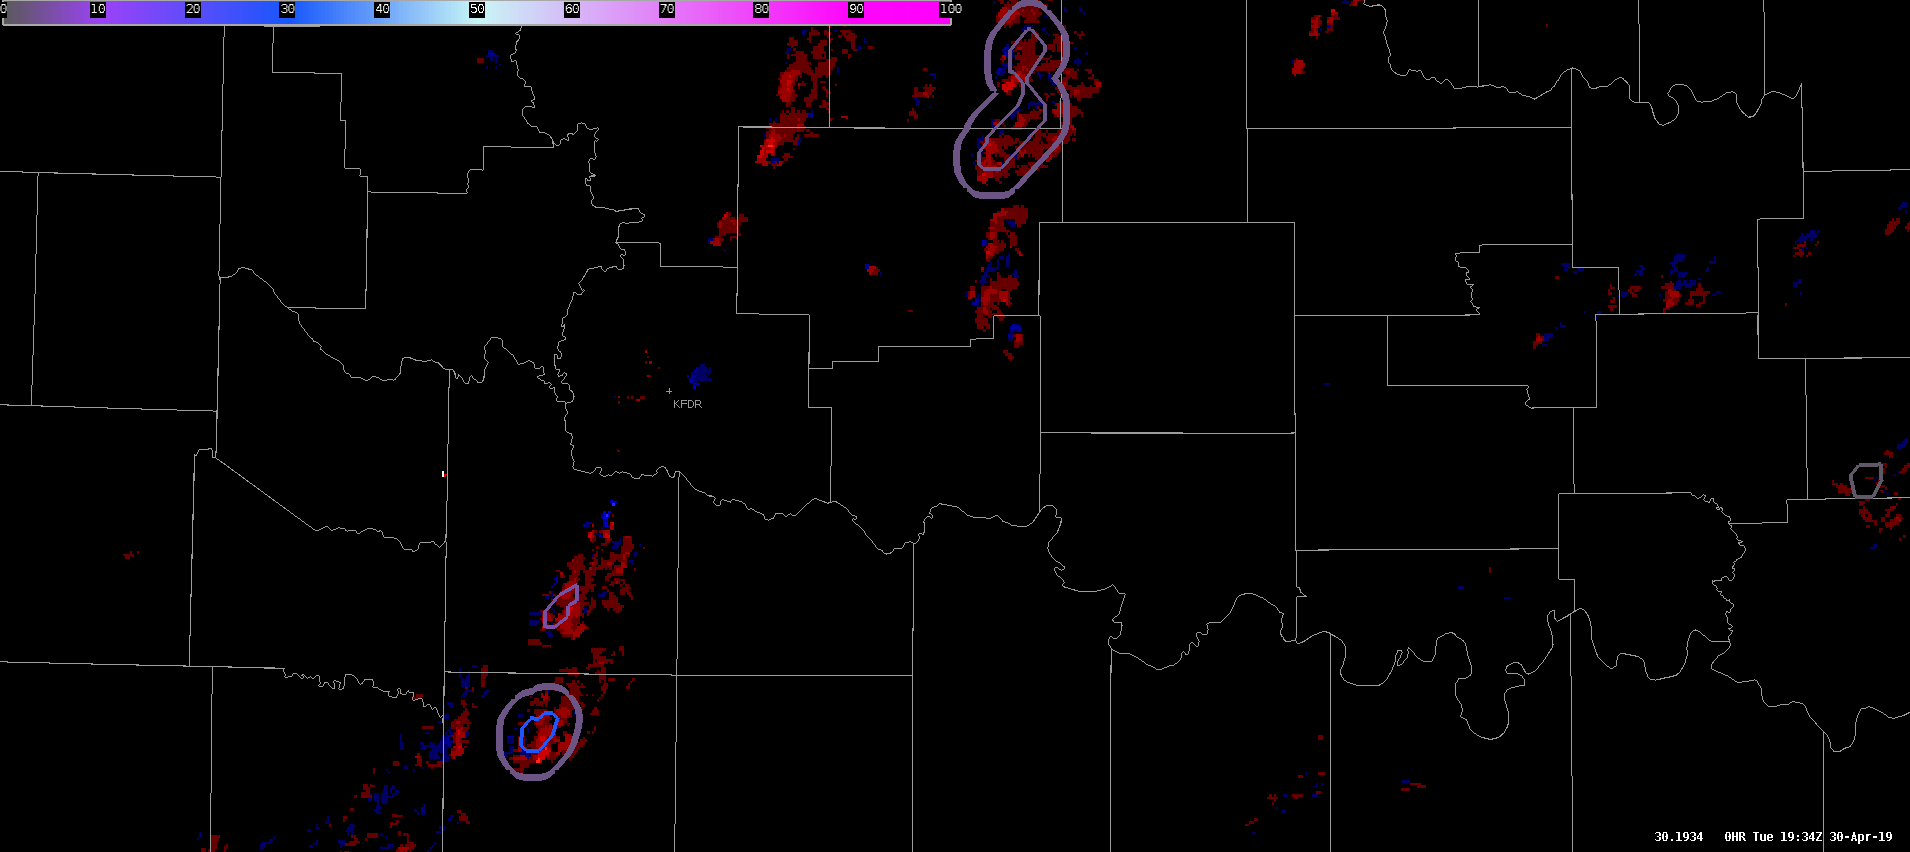
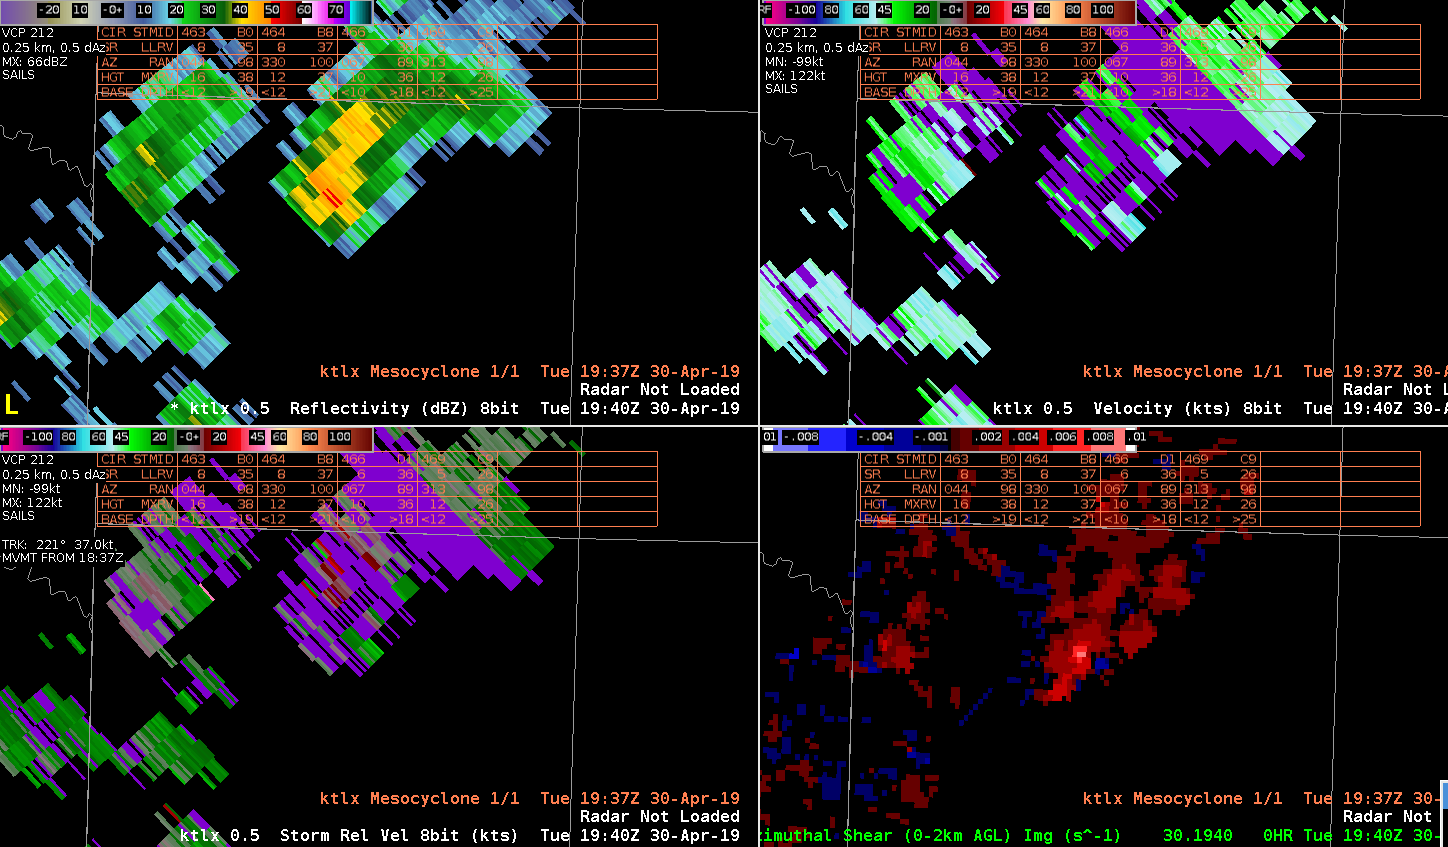
0-2km merged AzShear


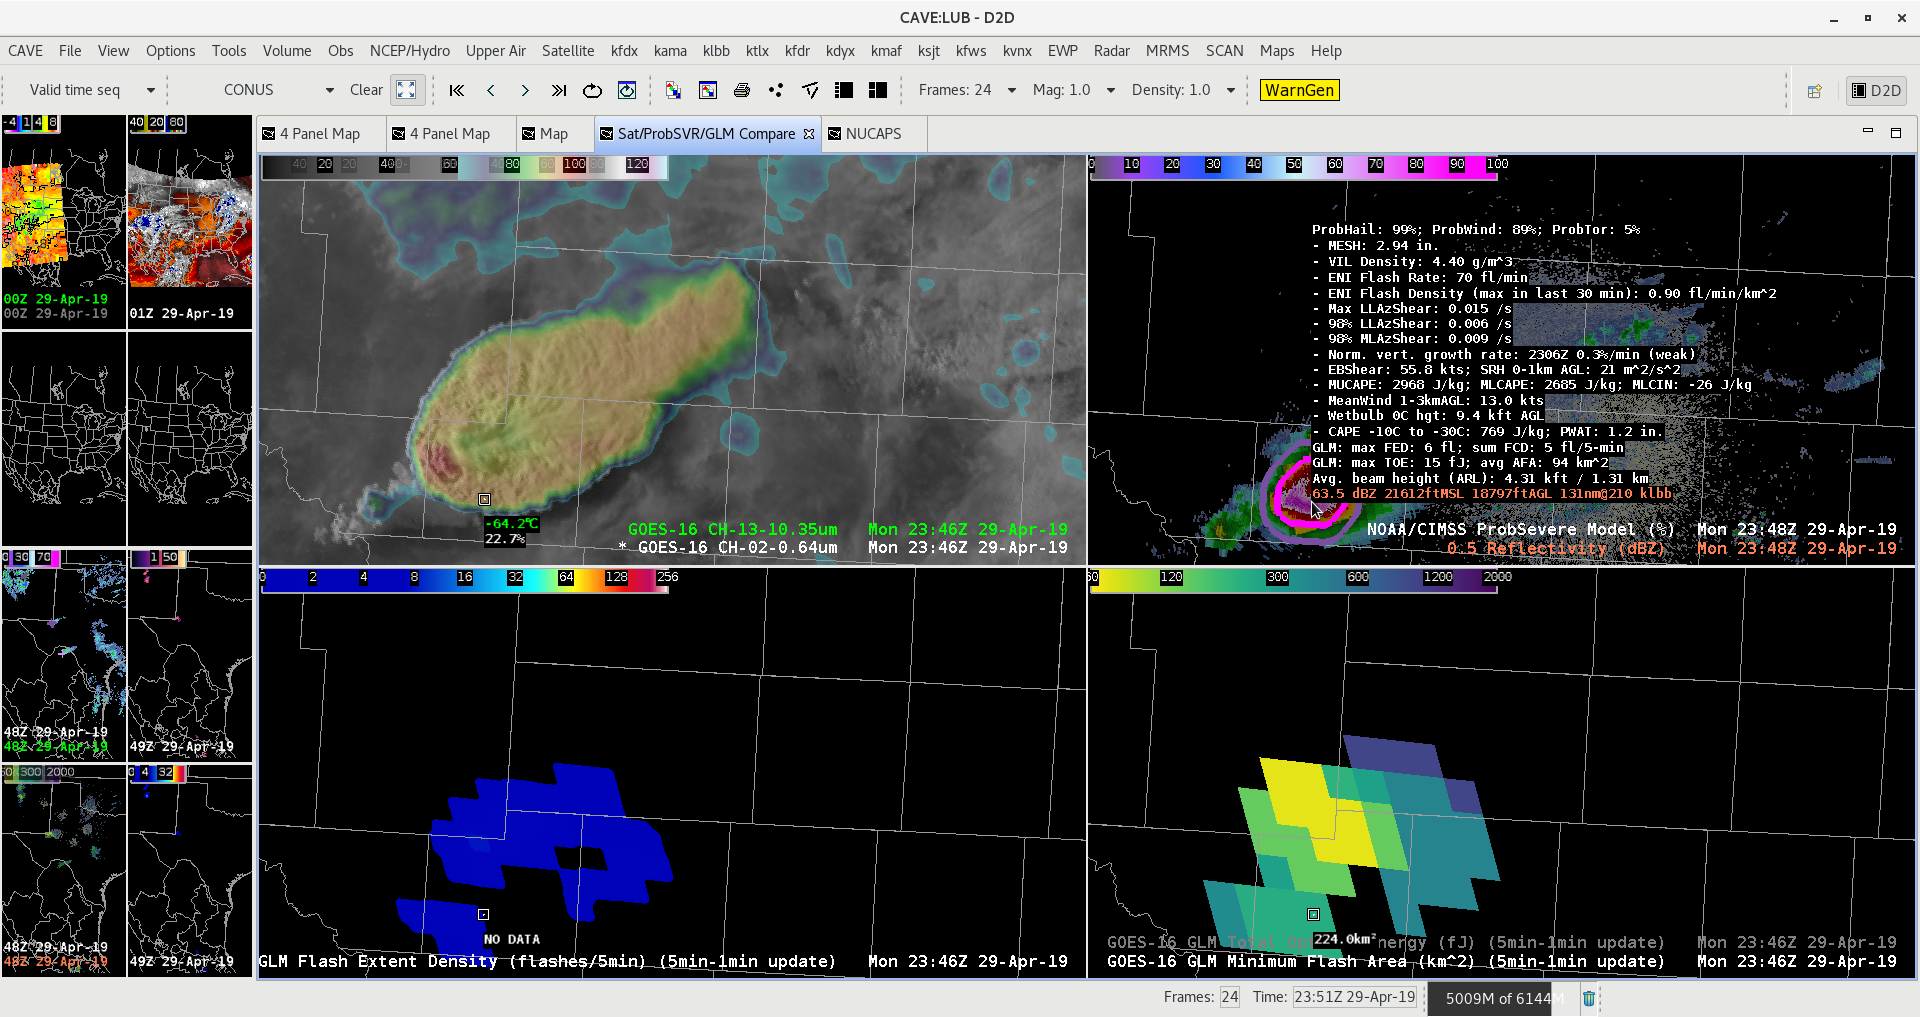
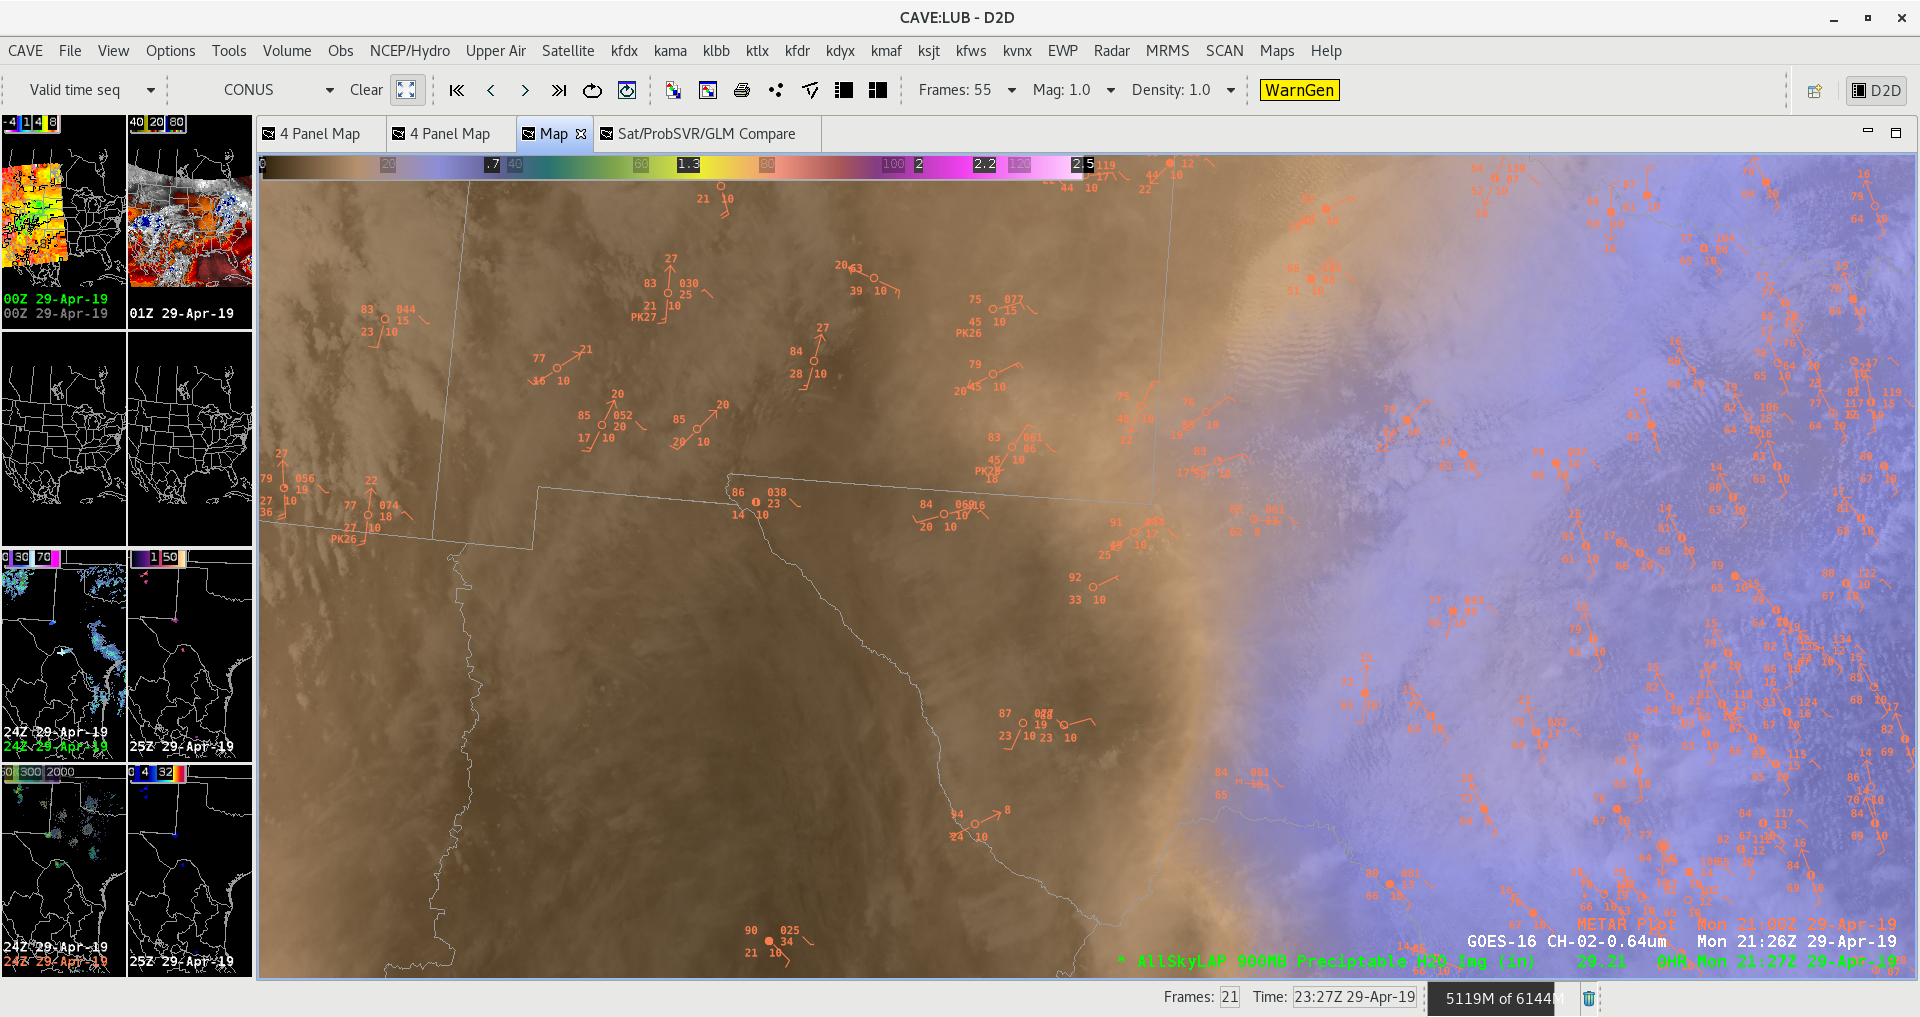
 Loop showing the evolution of a strong cell west of Del Rio in Mexico. Prob Severe values were dominated by Prob Hail in this case. This hail threat makes sense given mesoanalysis and storm mode, supported by 12z Del Rio sounding. Peak values around 97% occurred before the storm split, but after peak dbz values observed on radar. This makes sense considering the beam height at this range (165 mi from MAF) was showing the mid-level core at 30kft MSL – hail would likely have needed time to fall out from this height. This case could be useful for offices with high radar beam heights distant from isolated thunderstorms. Prob Tor did nudge up around the time of the storm split enough to show the ‘double contour’, however V data at low levels was not present.