
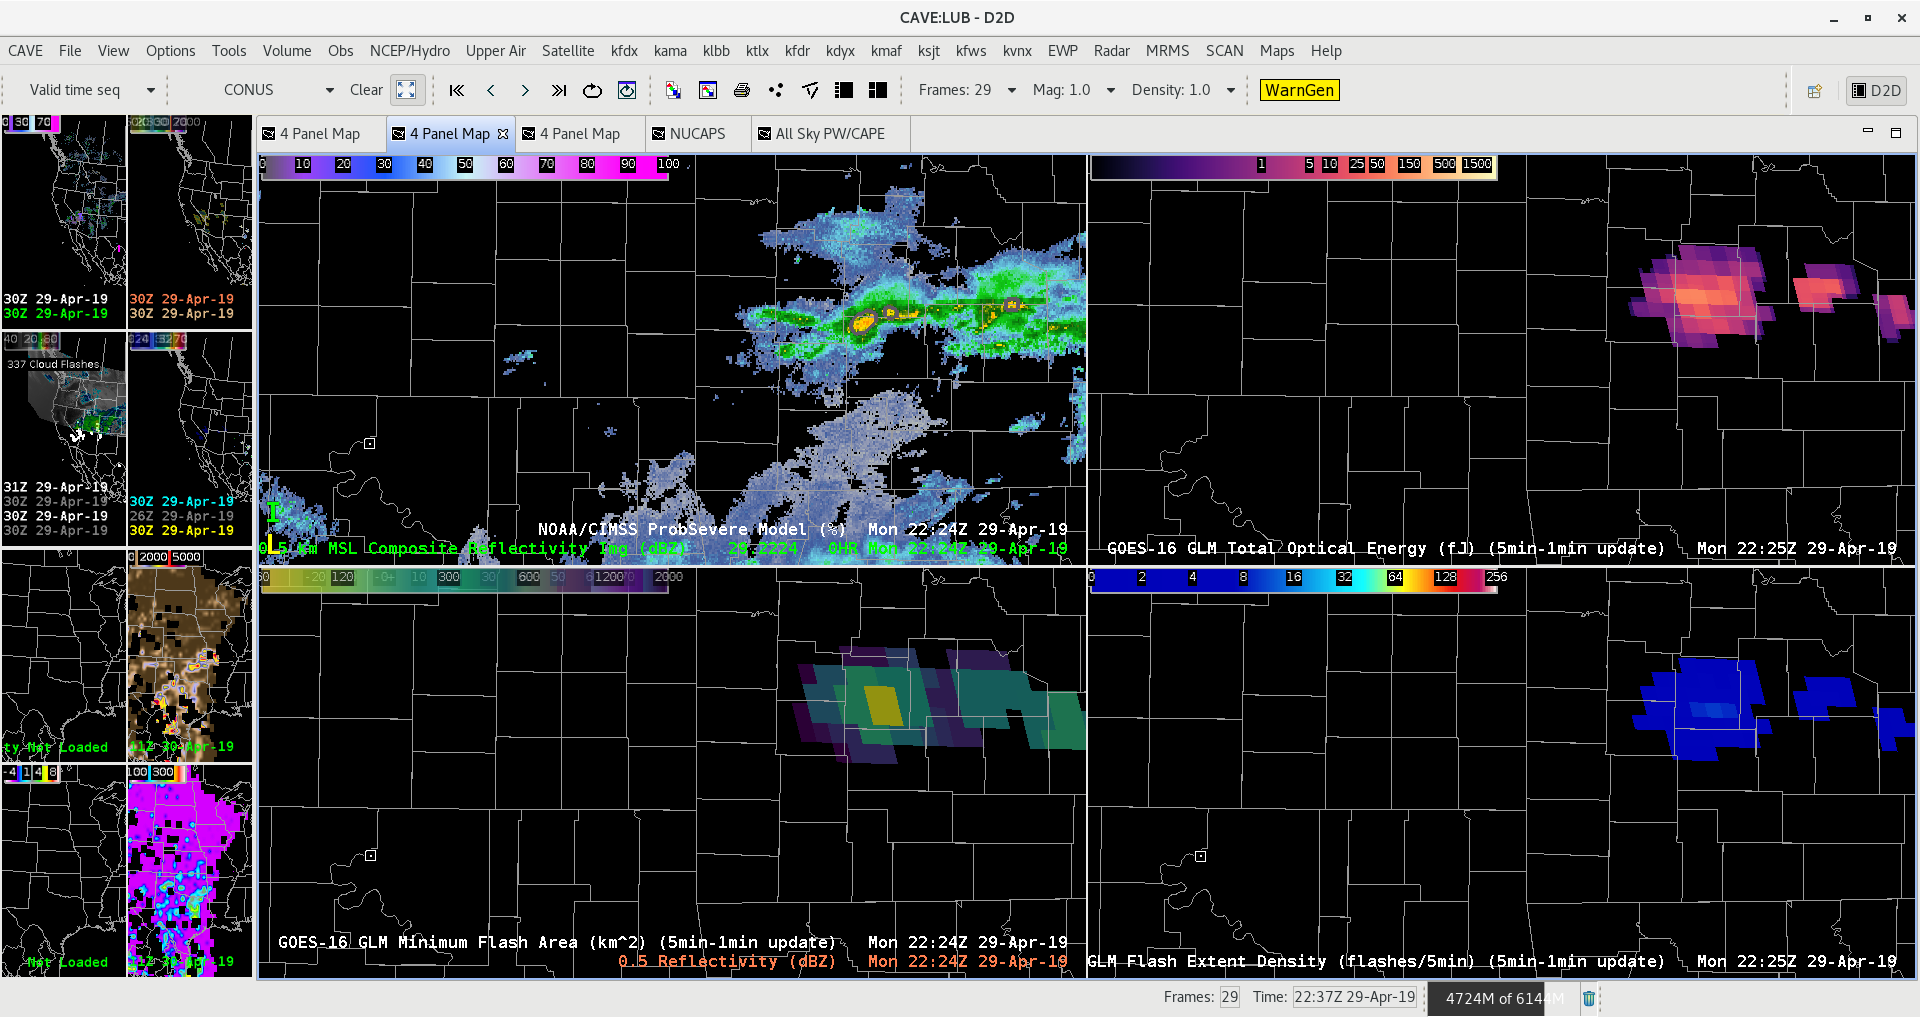
Figure A
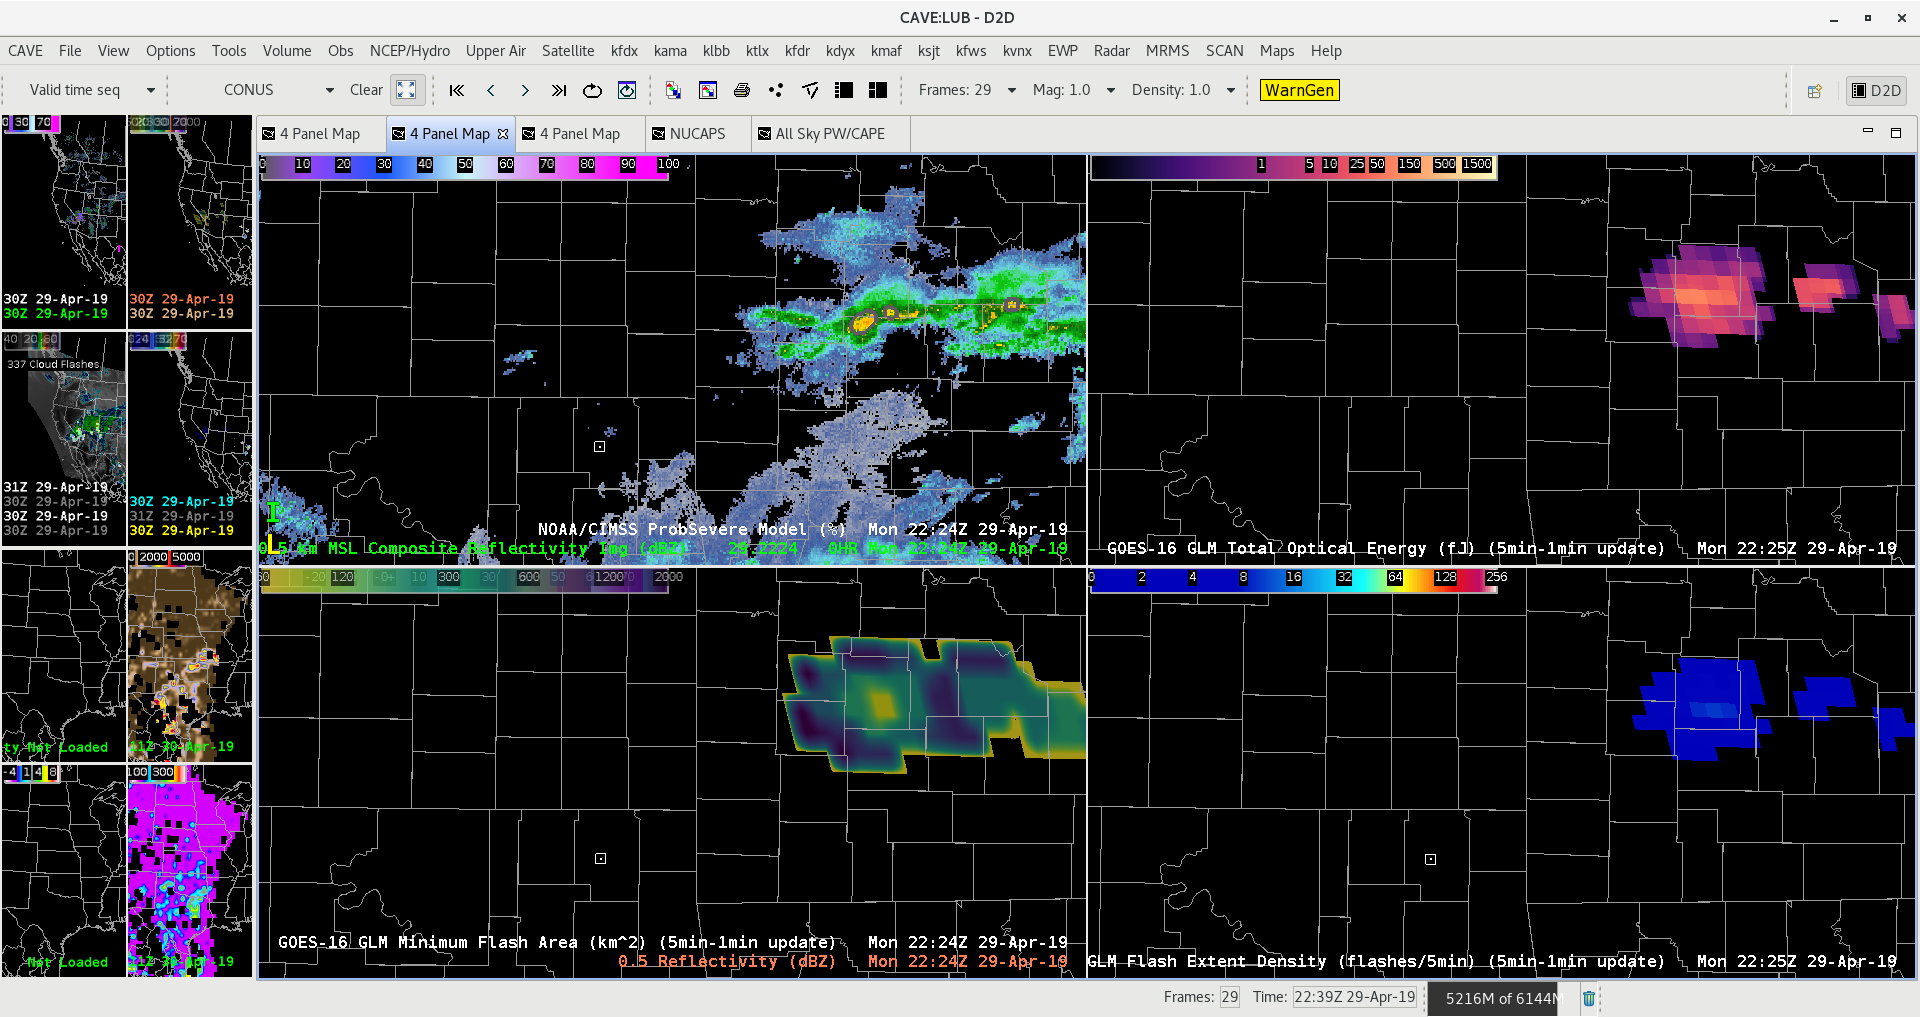
Figure B
Best Practice: Look at lower left image on both Figure A and B (GLM Minimum Flash Area), notice Figure B has interpolate turned on which makes the product less useful since outer edges also have minimum values. The GLM Minimum Flash Area of interest jumped out much better on Figure A without interpolate turned on.
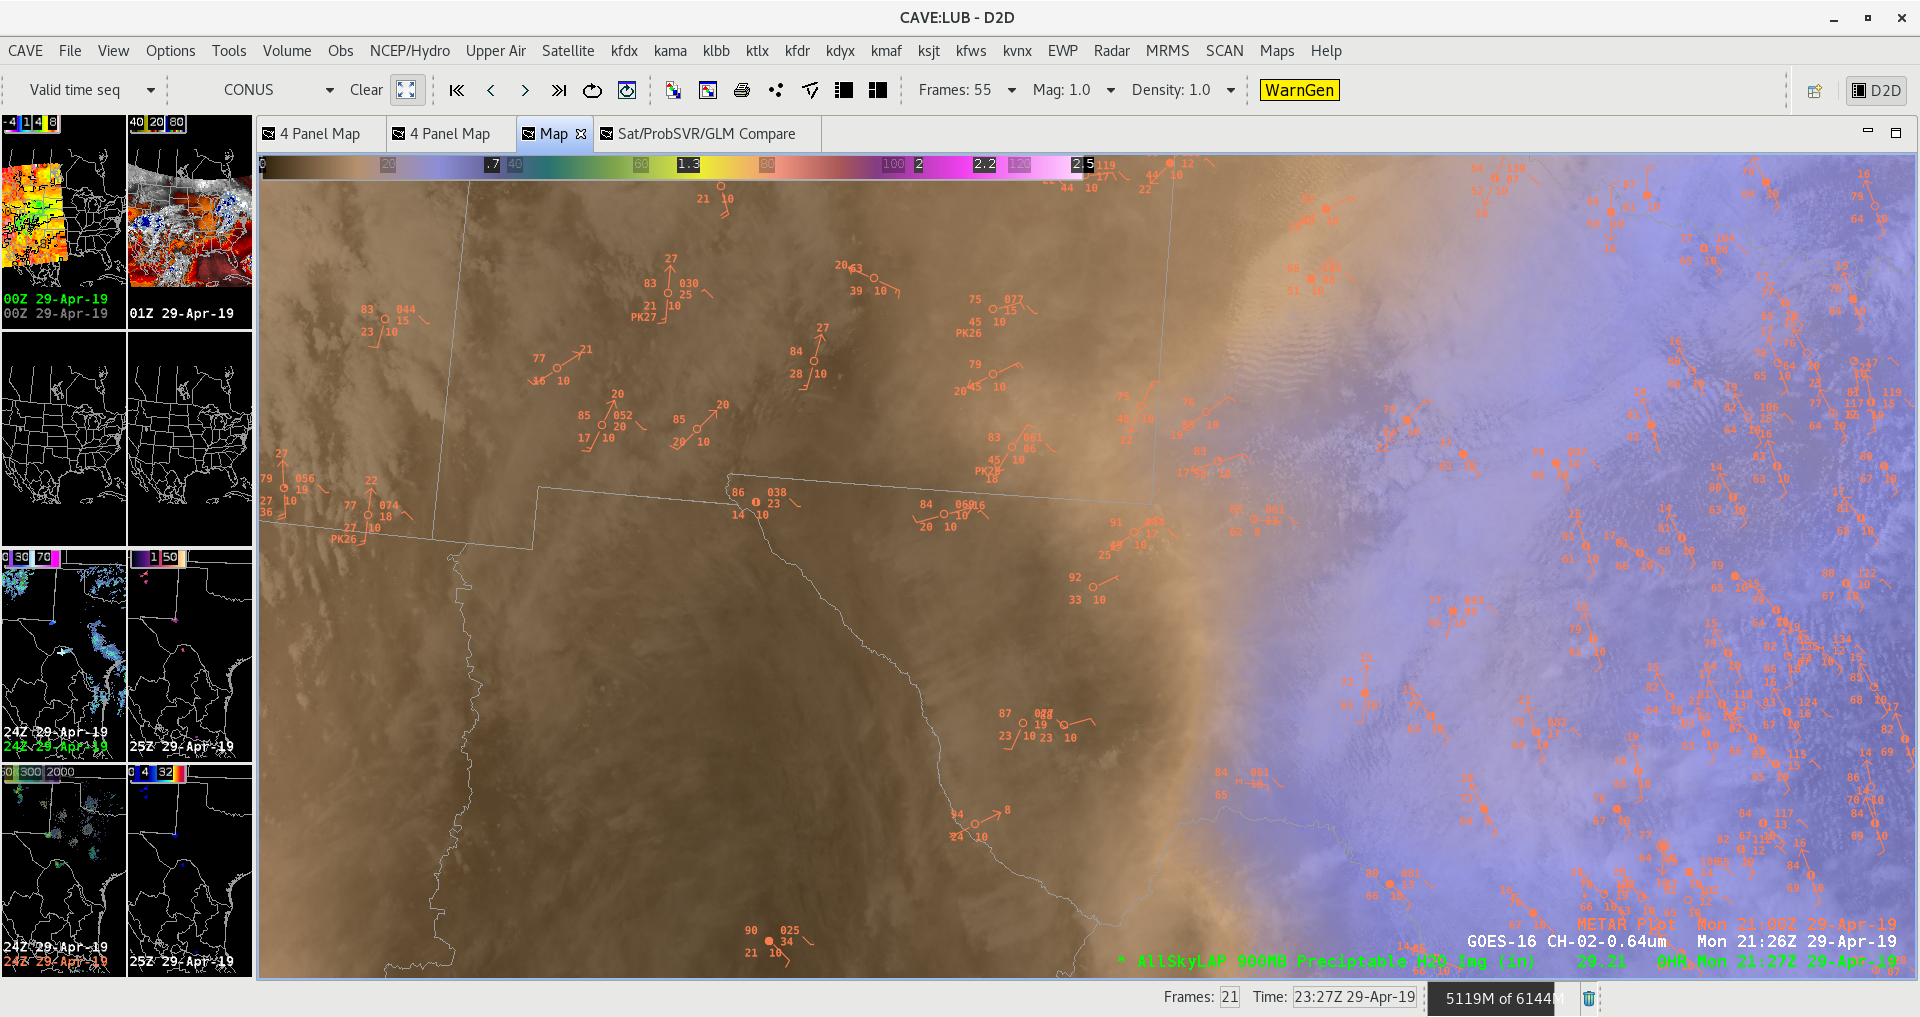
Figure C
Blending both All Sky Sfc-900mb PW and Visible satellite imagery together for convection initiation in western TX panhandle.