

Both storms in the middle portion of the screen very quickly showed low min flash area (MFA), again bringing my attention to those storms. The northern most storm quickly developed classic hail signatures prompting a warning. The southern storm quickly fell apart. Sandor Clegane
Tag: GLM
SJT SVR #1
GLM minimum flash area (bottom left) rapidly fell from ~1600 km^2 to 72 km^2 over a period of 5 minutes in the storm in the NE portions of these images. Maximum Total Optical Energy (TOE) topped out at 228 fJ shortly after the second image below. 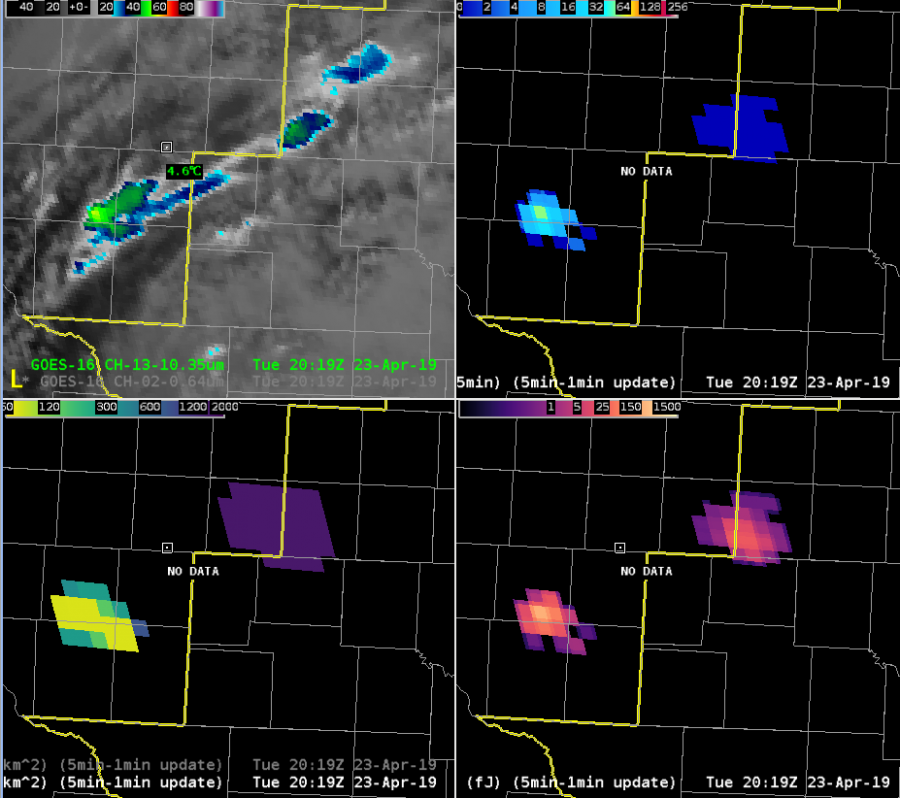
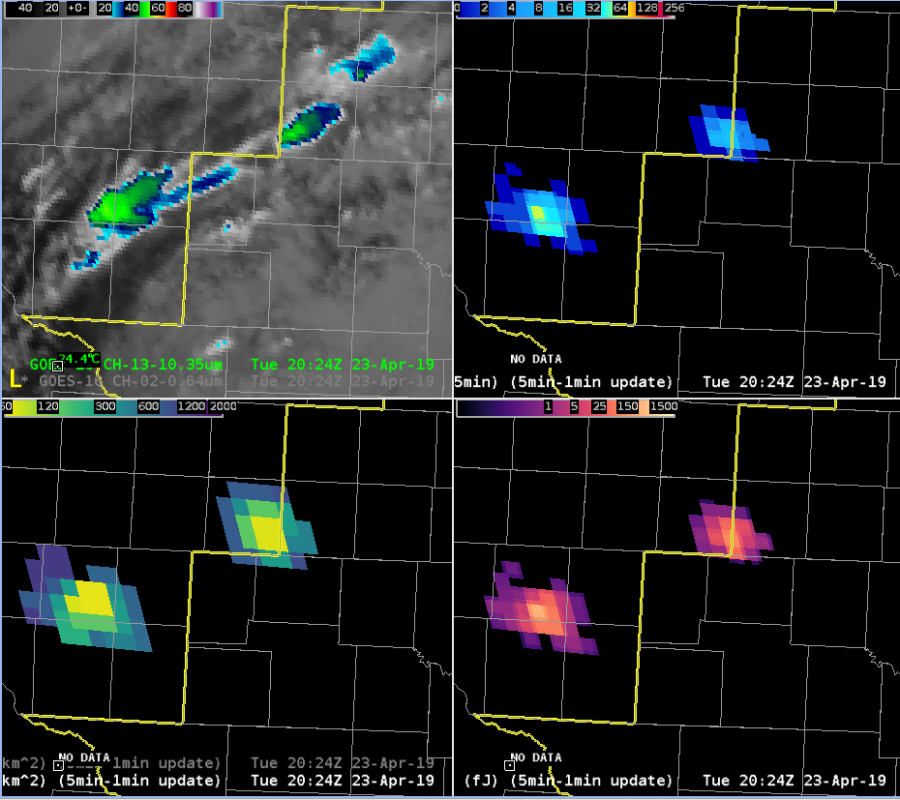 5 minutes later, this storm began displaying classic hail signatures in all-tilts base radar data, prompting a severe thunderstorm warning. I will note that several other storms displayed similar minimum flash area decreases without so quickly turning severe, but the rapid decrease was the first thing that brought attention to this storm.
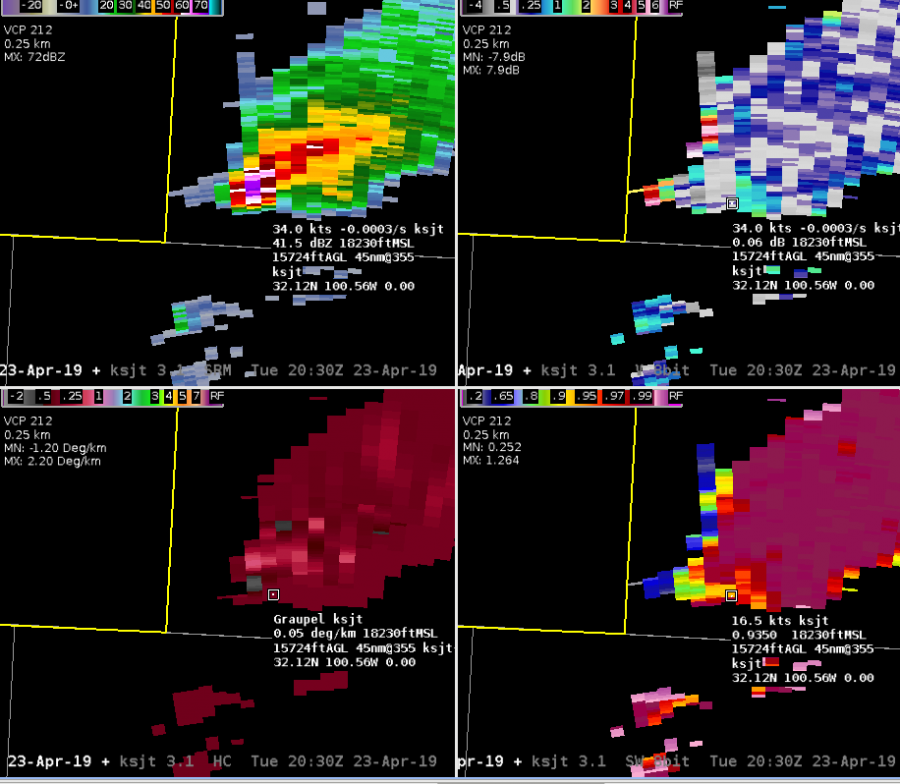
Severe hail very likely occurred shortly after the warning decision. Shortly thereafter, Max TOE fell off fairly dramatically, to around 50 fj by the end of this loop. However, the difference between the pre and post severe max TOE does not show up well with the default color curve.
Sandor Clegane
Minimum Flash Area: Capturing the “Pulse”
Taking a look at the Minimum Flash Area (MFA) product (part of the GLM suite) and comparing it to the Average Flash Area (AFA), my initial analysis leads me to think that there’s more value in the MFA as opposed to the AFA. The MFA, when watching the evolution of a storm in the far northeastern part of SJT’s CWA, shows the pulsiness rather well. The AFA, in comparison, had a washed-out look during the 19Z hour of analysis. I had a side-by-side of the meso-sector VIS satellite imagery with the MFA on top (1-min.) and the ProbSevere suite with radar products, including reflectivity (GIFs below). The MFA provided a few minute lead time over the ProbSevere and reflectivity products of the storm pulsing up. Thought: watching the trend of the MFA could provide some insight into the overall nature of the storm. In this particular case, the smaller flashes were consistent for several frames/minutes, and the ProbSevere/reflectivity core showed an uptick shortly thereafter. Because the smaller flashes remained confined to a smaller area/grid box (<72km^2), this indicated to me that this storm would remain pulsy and likely either sub-severe or low-end severe. Taking a look at what WFO SJT issued during this hour indicated to me that this thought process likely held true. From a mesoanalyst perspective, this could prove to be invaluable information to provide to a radar operator.
~Gritty
Weak Pulse Storm Analysis – GLM
In the below GIF from Top Left to Bottom Right you have:
- GLM Flash Extent Density from GOES-16 (East) and GOES-17 (West)
- GLM Average Flash Area from GOES-16 (East) and GOES-17 (West)
- GLM Total Optical Energy from GOES-16 (East) and GOES-17 (West)
- ENTLN Ground Based Lightning Detection and GOES-16 1 Minute Channel 2 Visible Satellite.
The animation shows the quick pulse life cycle of the storm – you can watch the updraft grow and then the anvil get sheared off of the storm in the visible satellite. The Flash Density and the Optical Energy show a quick uptick and GLM registers at the same moment the first ground indication shows up. The Optical Energy maxes out as the storm grows to its tallest before the top gets sheared off. The Flash Density seems to follow the progression of the updraft eastward as well. The smallest Average Flash Area also follow the ‘newest’ and/or ‘growing’ parts of the storm. While convection continues from the cell (it is sitting along a boundary across the SE Part of MAF’s CWA), it does weaken (looks like lower tops in visible – could certainly check this in other ways) and you use lightning from all networks.
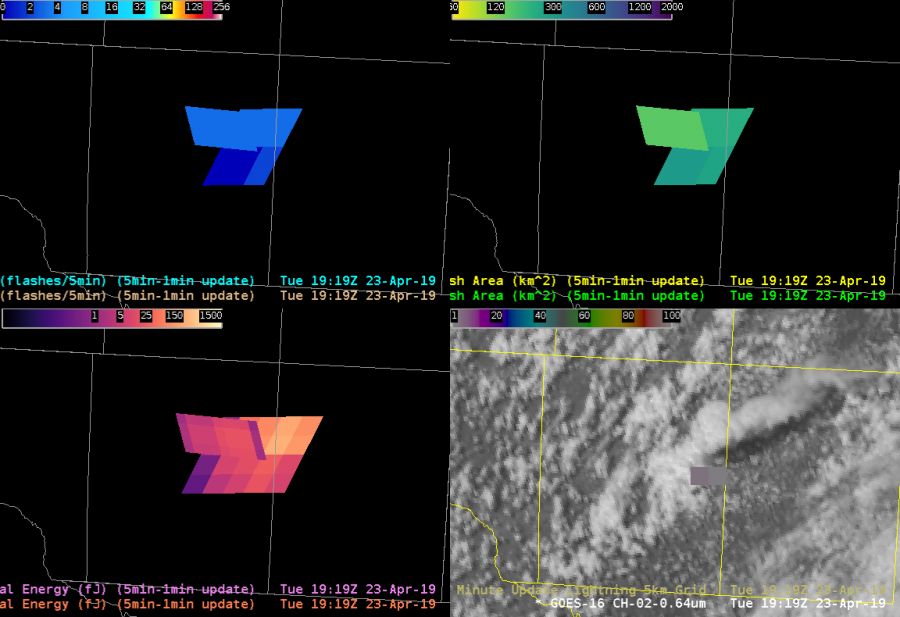
While there is nothing ground breaking here it does show how GLM handles pulse convection and the trends in the GLM data. The one downside that I would note here is the lack of some sort of downtrend before the storm weakens. It seems the data generally peaks then goes away rather than drops before the storm dies. It is important to note that the coverage of the various products did gradually decrease (went from several pixels, to two, then none) as the storm weakened.
-Alexander T.