Lightning trends helpful for distant storm

radar_2319z lightning_plot_2317z

Our southeast BYZ CWA storm keeps on going, but the lowest tilt is hitting it at more than 8500 feet AGL. Storm interrogation is obviously compromised at this distance.

However, the lightning trend on this storm has continued to climb, which would suggest that it continues to intensify (or, at the very least, maintain its strength). This is really helpful for a distant storm in which radar sampling is less useful.

Jason Williams

Tags: None

CI Probability Along Outflow Boundary

The CI probability product keyed in on some convective development along an outflow boundary from a storm moving southeastward across Morton County. It went from 43% at 2145Z over northern Grant County to 68% at 2200Z. Comparing the product to radar reflectivity, there were dBZ values over 50 just east of Heart Butte Dam at 2151Z and the cell continued to intensify for the next few scans.

I think that this data would be more useful during warning operations if it was available every 5 minutes versus every 15.

CIprobability(Click image to see animation)

Reflectivity

(Click image to see animation)

-Helen Hunt

Tags: None

Thoughts on 1min SSRO Data and Severe Weather Forecasting and Ops

Having the 1 min satellite data was vital to my knowledge of the environment and subsequent warnings. Here’s how.

I was able to identify boundaries important to convection and initiation across northwest NE.  There were limited obs there, but it was clear from the satellite imagery.  With the one minute satellite data I was able to find the 6 min satellite derived wind data.  This data was a check to the models.  The RAP had 0-6km shear AOA 30 kts, this suggested that multicell would be the dominate storm mode.   The satellite obs suggested that there was actually a H3 jetlet moving into the area.  The winds associated with this max increased the 0-6km shear to around 45 knots with near 0 surface winds across western NE.

I developed a thought that the storms would initiate across eastern WY and then move into western NE and intensify.    I thought that the jetlet would cause the storms to become stronger and more supercell in nature until it moved out of the area.  This in fact happened.  This lead to a small window ~2 hours of supercells with large hail.  Knowing that the boundary to the north was stationary and cu was starting to initiate along there, suggested that we would could see a short tornado threat as well.  Storms that formed or road the boundary showed rotation.  With lightning jumps and the one min overshooting tops data, I decided to issue a tor.  My thought was that with a long lived overshooting top and a collapsing reflectvity core, that the updraft intensified, leading to more stretching of  vort in the storm and possibly the RFD coming down.  Knowing that 12kft was my lowest tilt, I decided the environment and radar signature may be enough to warn,  No idea if it verified, however without the one minute data looped, I would not have been able to see fine details that suggested what was actually going on

Tags: None

June 2 — Flash Density Color Curve Comparison (CYS)

There has been some question as to the utility of the current default Flash Density color curve or developing different color curves to help forecasters pick out the highest flash densities.

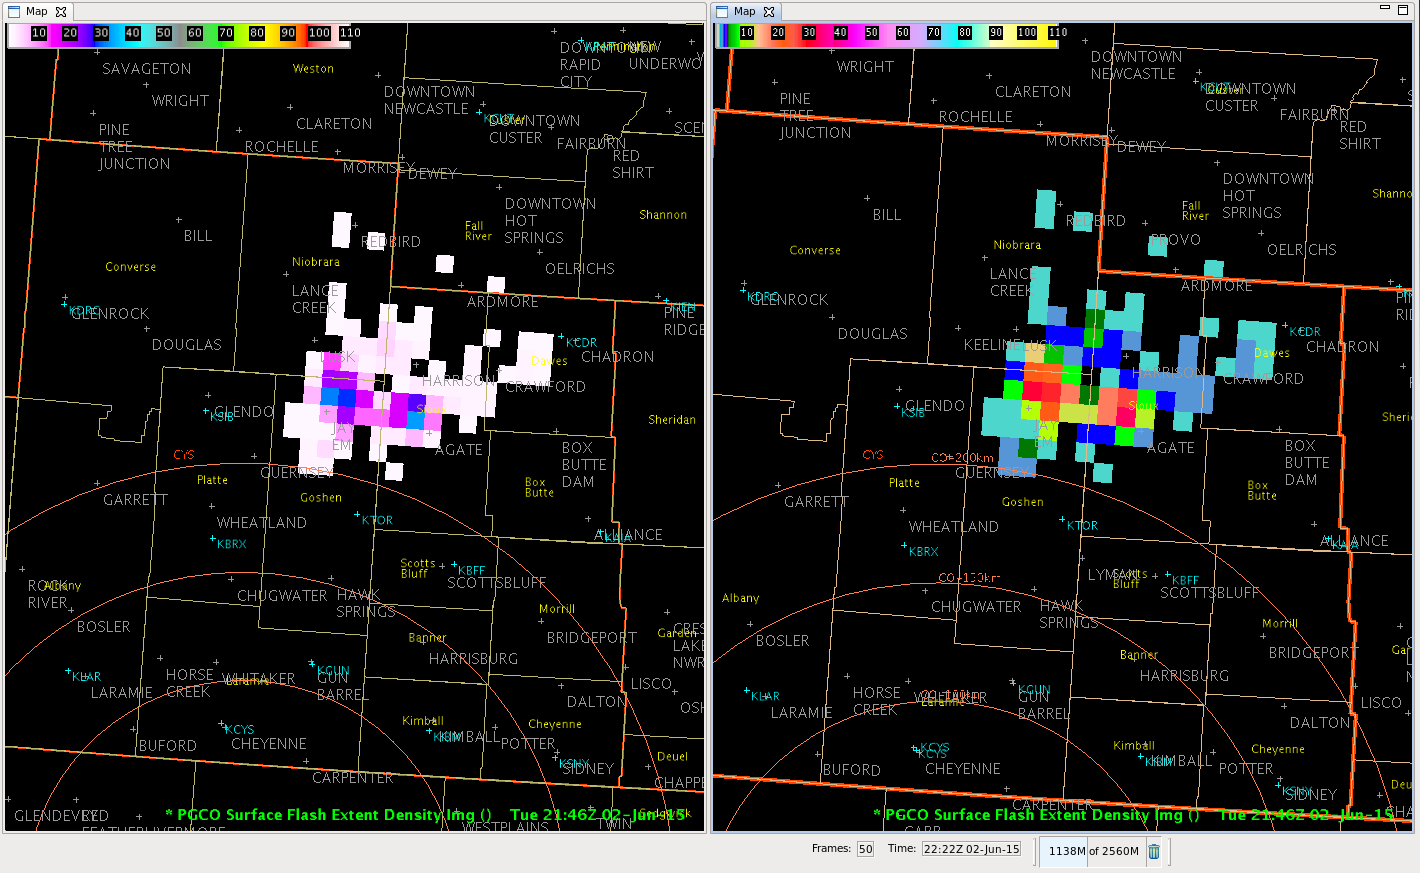
Here is an example of high flash densities we saw this afternoon (2146 UTC) in the CYS CWA, looking at the default color curve and one of the possible options:

FlashDensity_Color_Curve_Comparison


The image on the left is the default color curve, with the right image one of the options. The problem with the right image is the use of blue/green shades and red/orange shades for those that are colorblind.  Those colors can cause problems in figuring out the highest flash rates without use of the sampling tool.  Being a non-colorblind person, I prefer the right image as I was able to pinpoint the highest rates quickly.  It is still a good idea to use the sampling tool with both color curves to ensure finding the highest rates.

CoonieCatEye


Tags: None

CI-East: Success and Failure all in one.

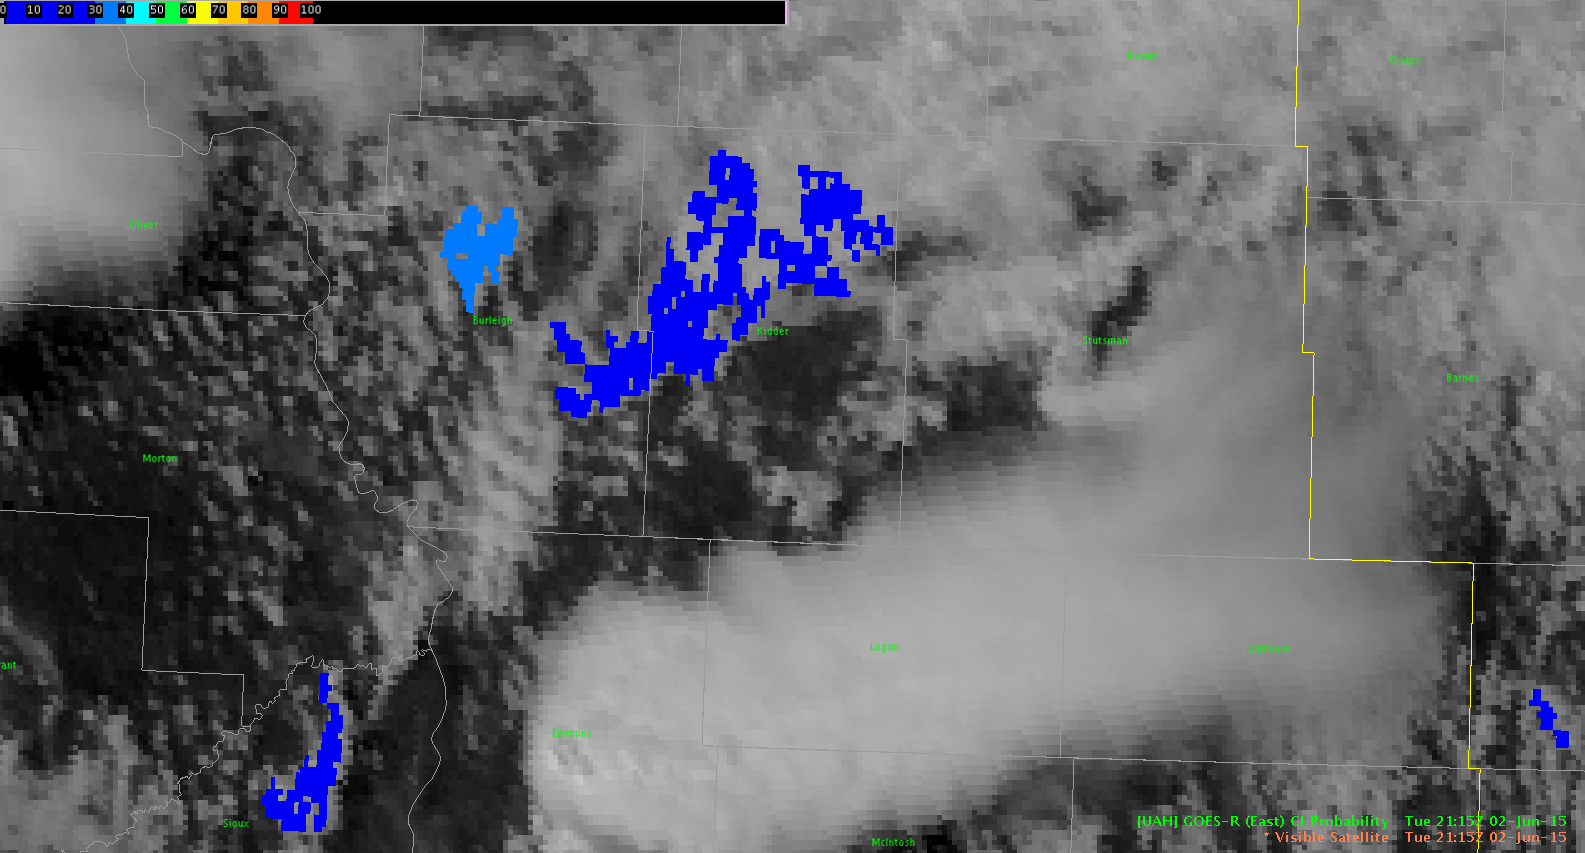
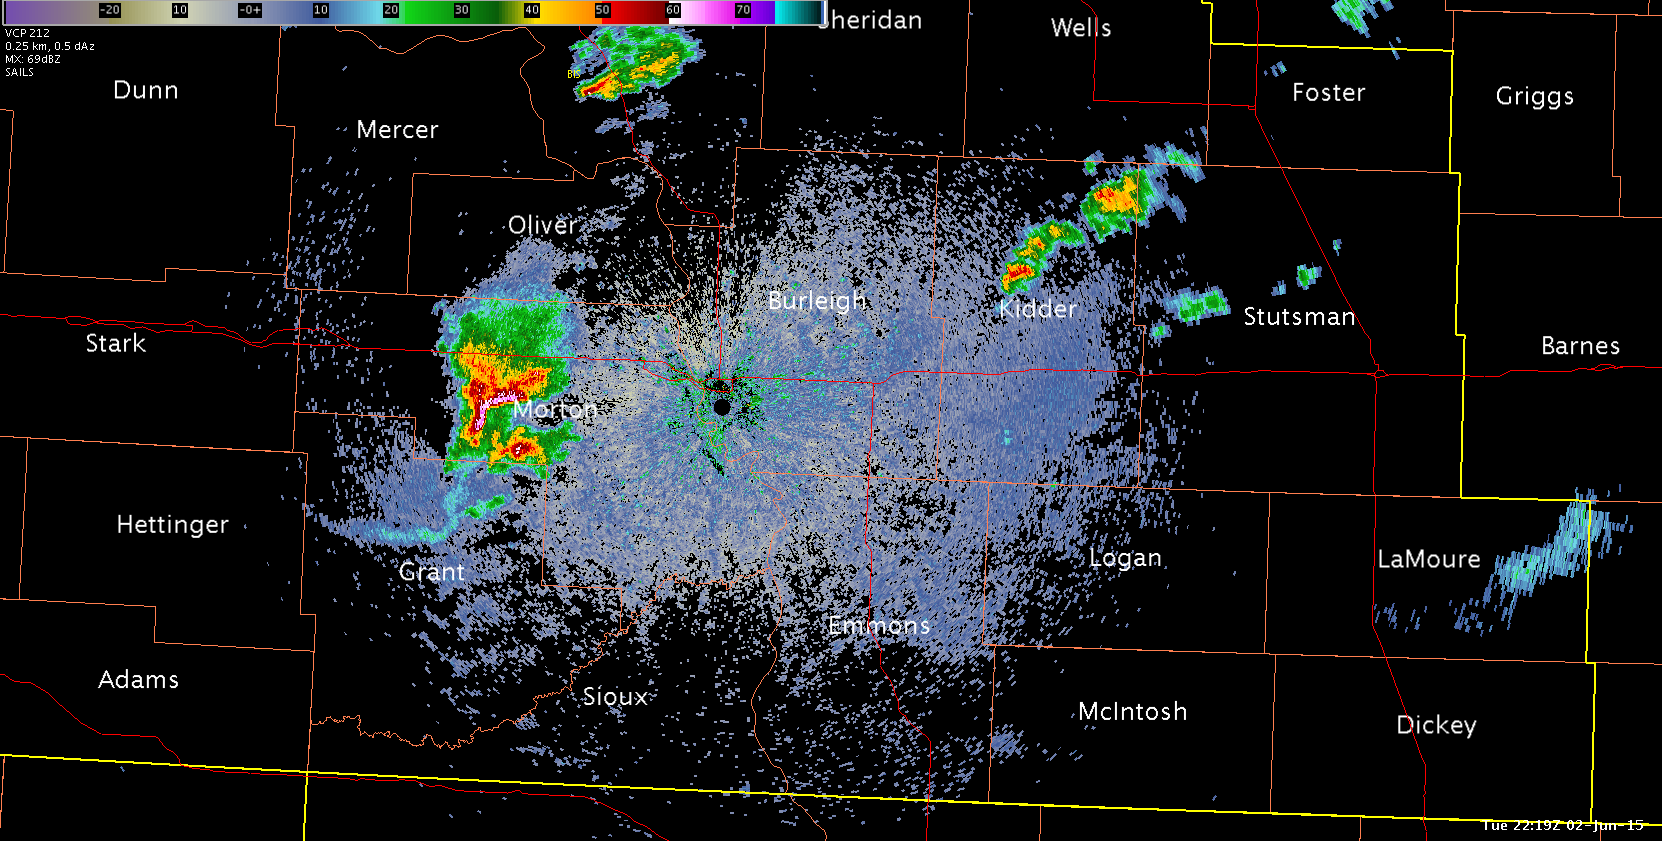
This is a case where I found CI to be helpful in helping focus attention where there was nothing on radar but it was showing potential for convective development. Fig 1 shows a swath of about 23% over Kidder Co and about 33% over Burleigh Co to the West at 21:15z.  About a hour later at 22:22z (Fig 2), we saw development on radar over Kidder Co but nothing over Burleigh which had the higher probability.  This was helpful in this case because I was not anticipating development in this area, but the CI helped grab my attention to watch this area. –Cattywampus. CI_2115ZFig 1: CI-East over Burleigh and Kidder Co

2217z
Fig 2: Convective development over Kidder at 22:22z.

Tags: None

Flash rate jump and high reflectivity/TBSS in Montana

lightning_radar_2218z lightning_plot

Our (likely) hailer in the southern BYZ CWA had a pretty big jump in flash rate. Big TBSS showed up at 2206z as the first climb in lightning rate occurred – although maybe this first climb was an artifact of the dubious lack of lightning noted in my previous post. That said, I don’t think it accounts for all of the increase – the updraft really cranking up is evident on NEXRAD, too. The two in tandem were good for increasing confidence in a warning.

Jason Williams


Tags: None

Rapid Flash Rate Changes, Cell algorithm mergers.

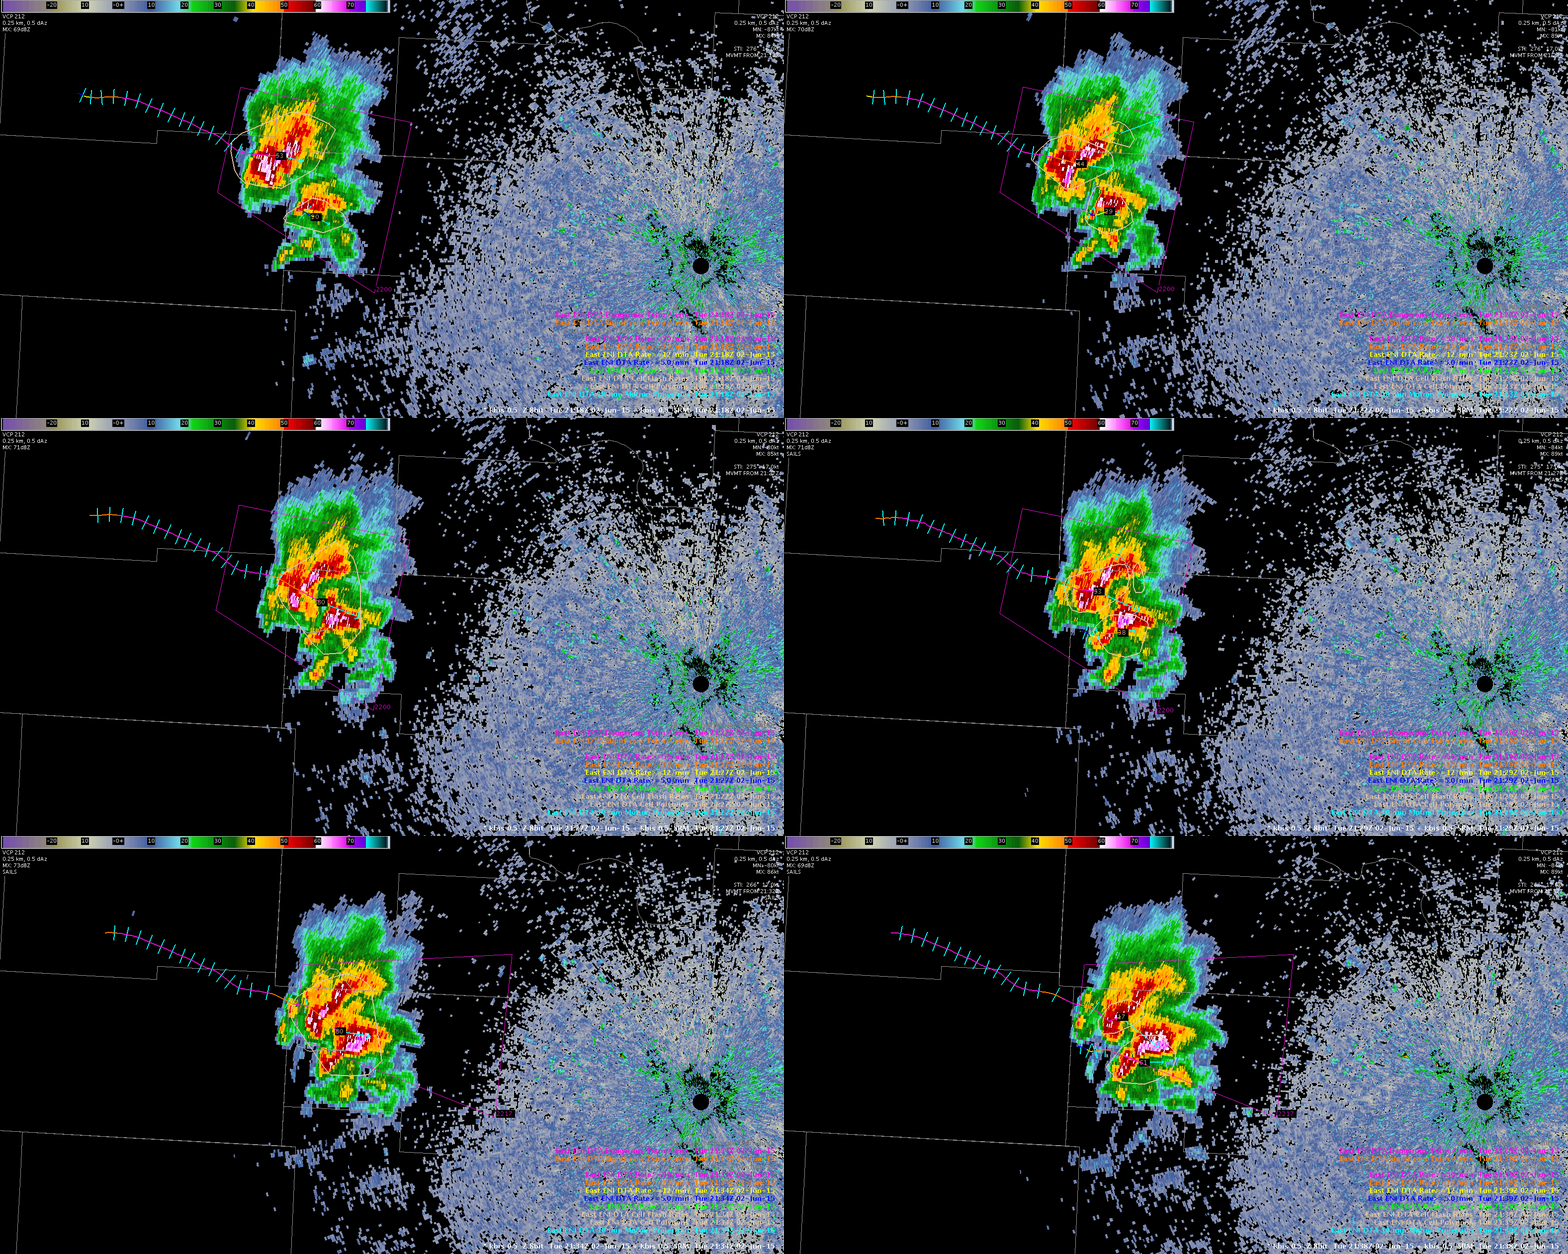
Just a case when lightning rate plot shows large fluctuations (fig 1) but seems to be of little use due the fact that data may not be necessarily showing updraft intensification and area broadening, but mainly a result of cells merging together.  Initially ENI, identifies a rapid jump as the two identified cells are merged into 1, then a quick drop as the cells separate back into two different cells, than another jump as they merge back together (Fig 2 – gif loop).  –CattywampusENI_Flash Rate2142

Fig 1: Flash Rate Jumps

merger

Fig 2: Cell mergers

Tags: None

ENI lightning in southeast Montana

eni_2201z radar_2159z

We have a high reflectivity thunderstorm southeast of Fort Smith, MT, but the ENI data is at a Thunderstorm Alert. There’s almost certainly more lightning occurring with this storm (it has 60dbz at 22,000 ft AGL), but the lightning detection efficiencies in this part of the country is down around 40-50%. Certainly a caveat to keep in mind – its helpfulness is somewhat in limbo in warn/no warn confidence in a sparsely populated area since the chances of a svr report are low. Positive thought: trends can be helpful when lightning is being detected, even if its value is lower than in reality.

Jason Williams

Tags: None