Is there a way to display the lightning jump algorithem with more transparancy? I like to look at it however I do not like how it masks the relfectivity underneath. Just a thought…
torman1
Official websites use .gov
A
.gov website belongs to an official government
organization in the United States.
Secure .gov websites use HTTPS
A
lock (
) or https:// means you’ve safely connected to
the .gov website. Share sensitive information only on official,
secure websites.

Is there a way to display the lightning jump algorithem with more transparancy? I like to look at it however I do not like how it masks the relfectivity underneath. Just a thought…
torman1
Initial cell as weakened below severe limits with a secondary storm strengthening directly to its south. Overall thoughts on PROBSvr remain unchanged as it seems to lag behind observed radar trends. Traditional radar interrogation methods (50 dBZ core above the -20C line) continue to provide greater lead-time for warning decisions.
Convective initiation algorithem actually did hint at general region of southern TX for new storm development over 1-hr in advance of new storms forming. Once storms form, is there something that could be displayed to show that the CI algorithem is no longer tracking the area?
torman1
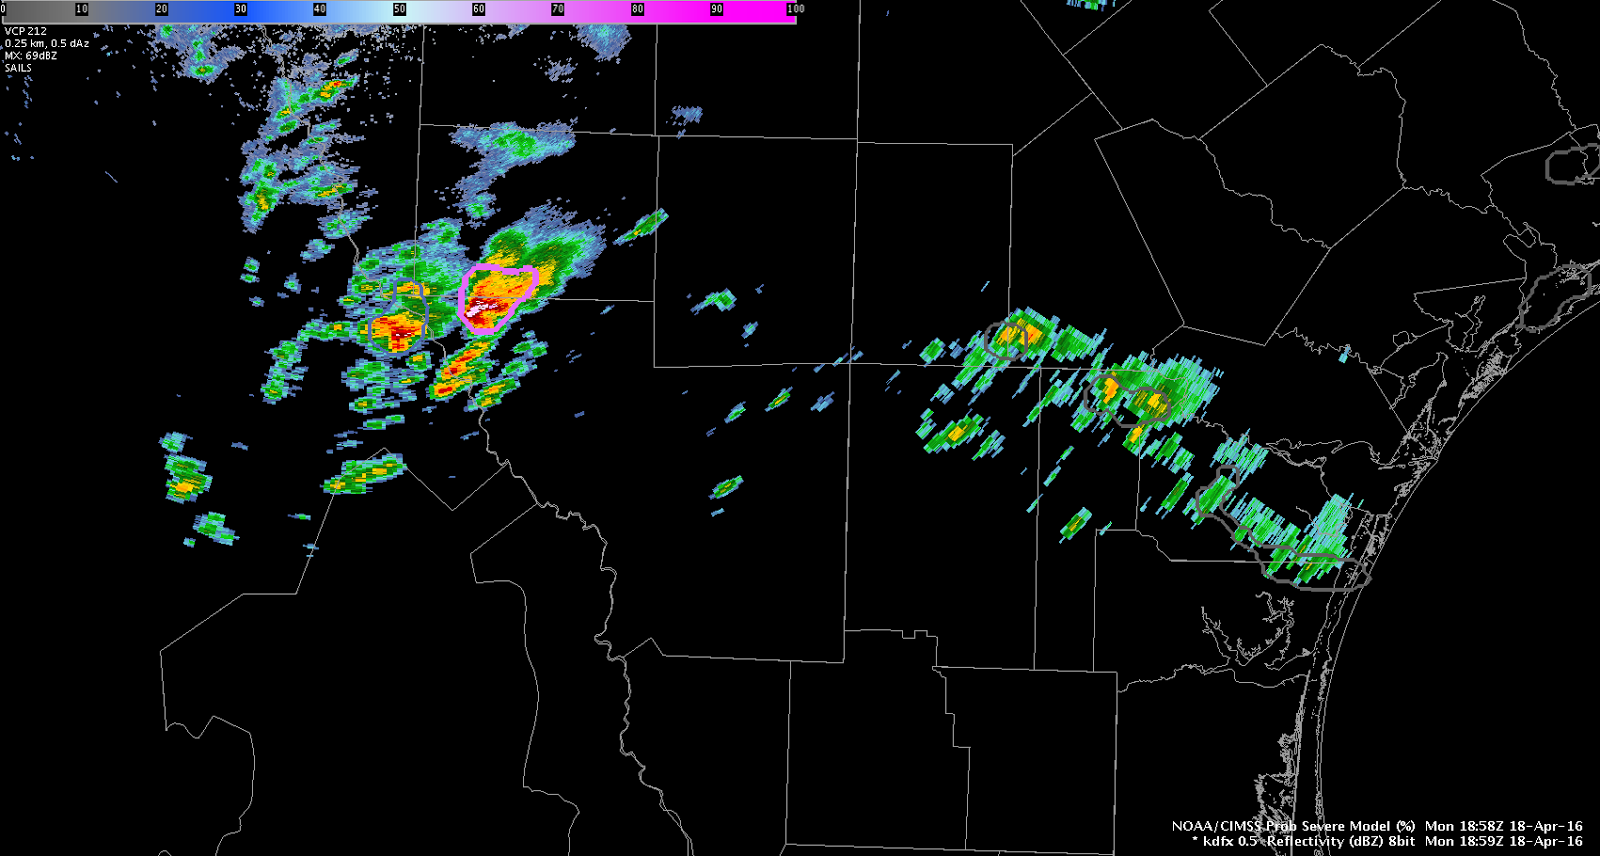
Additional severe thunderstorm warning issued for flanking line developing SW of initial storm in Northern Webb county, TX. Large hail is again quite probable, with deep, tall core through the mid-levels.
Interestingly, severe CI has seemingly remained fairly low with this storm, while ProbSevere has elevated values.
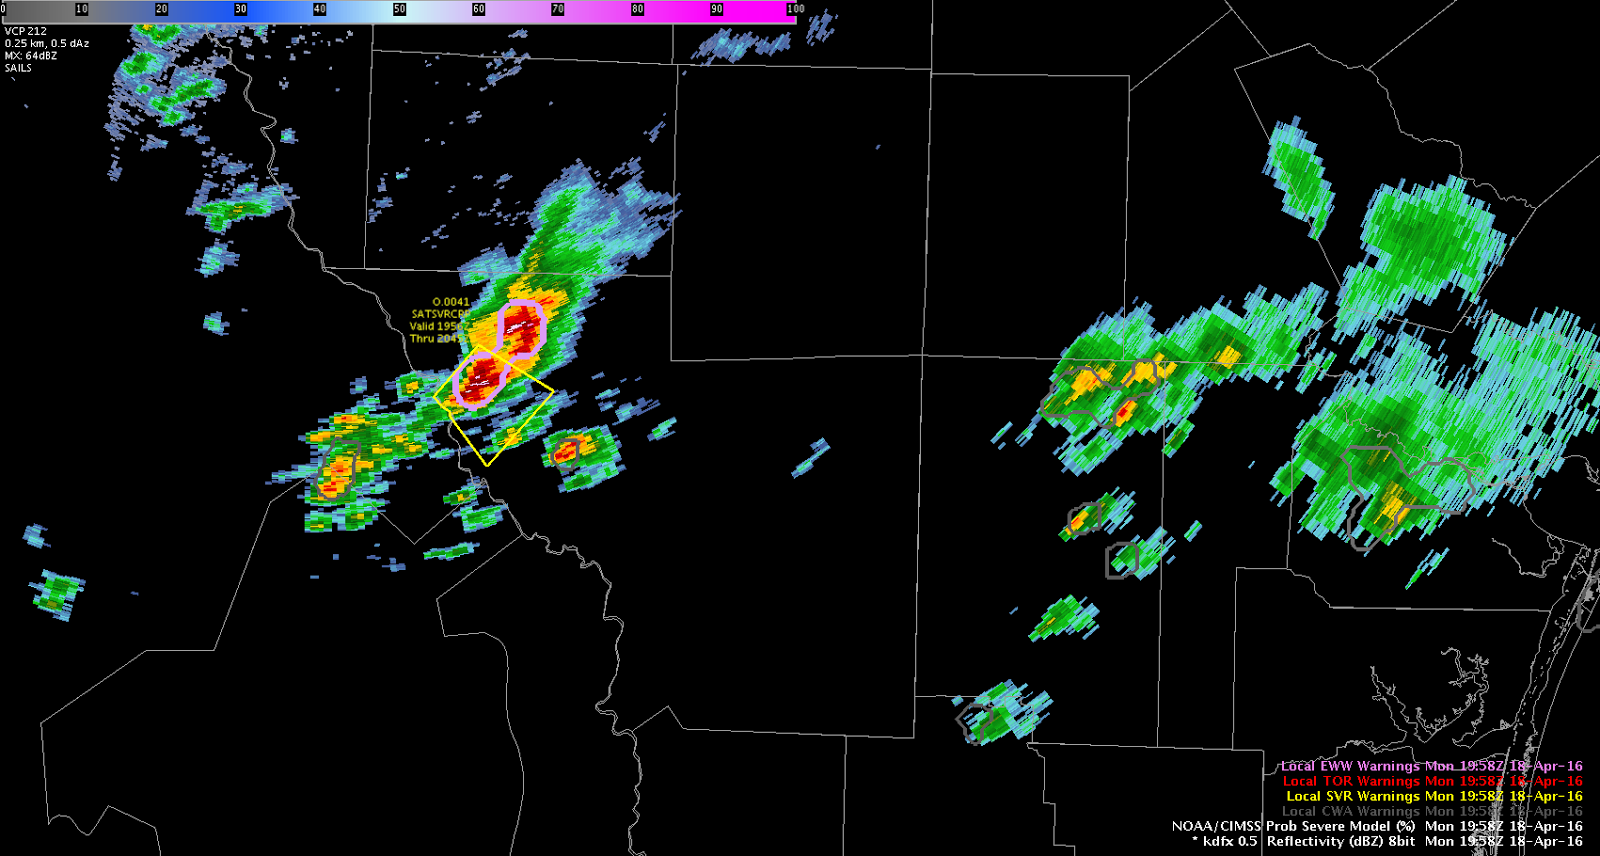
Overall, PROBSvr continues to show high probabilities of severe hail. So far no reports have been received at the WFO, not surprising considering the low population density in this part of TX. Otherwise, Lightning Jump data showed a 2 sigma increase approximately 20 minutues before warning went out the door. Finding little utility with the Convective Initiation products so far.

Severe thunderstorm warning issued for large hail in the NW edge of the CWA, just south of KCZT. Strong deep-layered shear (0-6 km layer), versus weaker 0-1 km values argues for hail producing supercells and possibly isolated downburst winds, versus tornadic storms. Reflectivity jumps in the mid-levels on the KDRT radar seemed to portend a near-future jump in ProbSevere values for this storm.
A collision of a northward moving convergence boundary with the southward moving synoptic boundary at the eastern end of the CWA has touched off additional convection. This is near a gradient zone in stability/shear. Lightning flash rates/overshooting tops are not overly impressive, as of yet. We’ll continue to monitor. – J-money
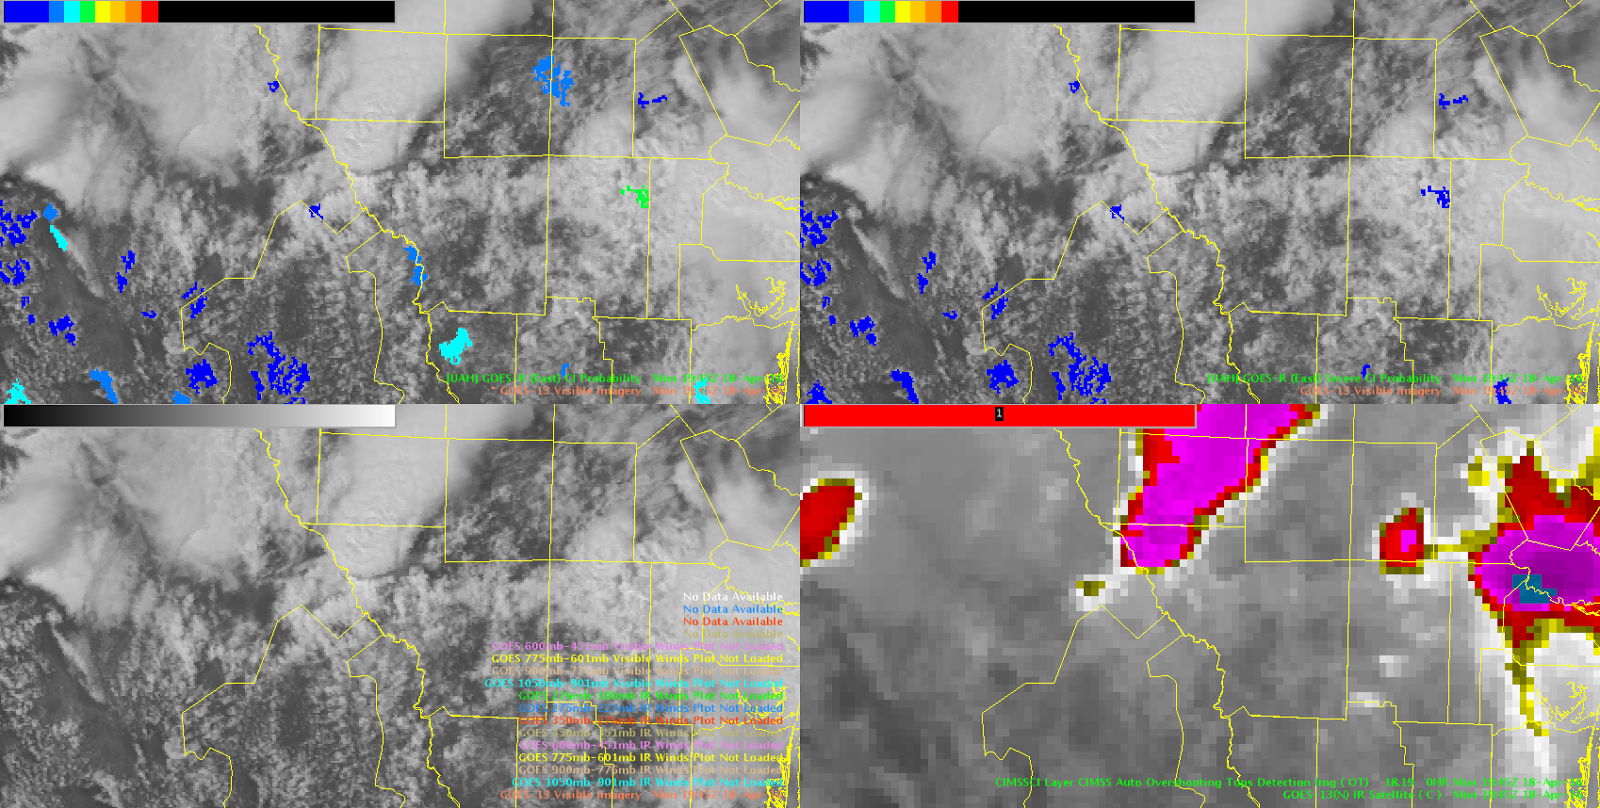
Today’s focus will be over extreme southern Texas as an outflow induced frontal boundary continues to sag south across the Corpus Christi and Brownsville CWAs. Ahead of this boundary, ample amounts of low-level moisture are in place with early afternoon dewpoints hovering in the lower to middle 70s. Latest 1-km SRSOR visible imagery from GOES-14 indicates plenty of low-level CU in place south of the boundary, however SPC mesoanalysis is already showing a moderately unstable airmass with MLCAPE values currently exceeding 2000 J/kg is some locations across far southern Texas. So far, convection has been slow to kickoff in the unstable airmass south of the boundary, with the only notable convection of interest located along the Texas/Mexico border where the outflow induced front appeared to begin interacting with elevated terrain just west of the Rio Grande River. That said, PROBSvr has been tracking this cell quite well so far, however probabilities for severe remain low at this time. Also of interest is a northward moving outflow/differential heating boundary which will continue tracking north this early afternoon, before eventually colliding with the outflow induced frontal boundary approching from the north. As these two boundaries collide, expect developing/strengtheing convection as the airmass largerly remains uncapped per latest SPC mesoanalysis grapics. Effective bulk shear of 40-45 kts remains more than supportive for severe development, however deep layered shear vector orientation along the effective outflow boundary may keep developing convection in linear segments. Of interest however, Rapid-Refresh soundings from south-central Texas show deep inflow directly from the east with quick veering with height above 900-hPa. As a result…cannot rule out an isolated tornado or two, however very dry air aloft along with steep mid-level lapse rates will likely keep large hail and damaging winds the primary focus of severe weather concerns.
torman1
Products to be evaluated include:
You can follow this blog for live updates and forecaster posts from within the HWT.
Bill Line, SPC/HWT Satellite Liaison
The extended manuscript entitled, “Probabilistic Hazard Information (PHI): Highlighting the Benefits via New Verification Techniques for FACETs” by Stumpf, Karstens, and Rothfusz, is available on the program of the American Meteorological Society 3rd Conference on Weather Warnings and Communications, Raleigh, NC.
The information in the PDF manuscript summarizes a lot of the content in this blog. It also includes new work to apply the verification scheme to severe weather warning-scale Probabilistic Hazard Information (PHI). These thoughts will be expanded upon in the blog in the near future.
Greg Stumpf, CIMMS and NWS/MDL
MRMS Data Sources
MRMS Web Browser:
http://mrms.ou.edu/applications/mrms_2d_maps_main.html
MRMS Google Maps:
http://wdssii.nssl.noaa.gov/maps/
Past Hail and Rotation Tracks:
http://ondemand.nssl.noaa.gov
NWS Enhanced Data Display (EDD):
http://preview.weather.gov/edd/
RealEarth (U. Wisconsin):
http://realearth.ssec.wisc.edu
MRMS Information Sources
Warning Decision Training Division training courses:
http://www.wdtb.noaa.gov/courses/MRMS
NOAA Virtual Laboratory MRMS Community:
https://vlab.ncep.noaa.gov/group/mrms/home
Scattered to numerous strong to severe thunderstorms develop along and ahead of a surface cold front. Many DTA’s were triggered by the intense convection from mid afternoon into the early evening. The DTA boxes and 5km lightning grid total flash density product worked well as an SA tool and quick indicator of rapidly deepening convection. In addition, the storms that developed near the MO/IA line where flow was more backed did a good job in showing the right turning storms.
-Wacha
The high frequency satellite imagery enables the ability to better match the frequency of radar data and combine them to give a unique view in this case of the radar data near the ground and the top of the storm via satellite. In the following animations, you can see the supercell SE of PUX in feature following zoom mode in AWIPS. Evident are storm structure, outflow boundary, inflow, and anvil development and storm top outflow all in the same image. This helps verify the conceptual model of supercells. MrSnow/Shasta.
Click on the images to see the animation.