Evolution of outflow boundaries in SRSO vs standard visible imagery

Just to compare and contrast what GOES-R and SRSO offers compare to routine visible imagery is shown below. The SRSO loop contains 120 images while the standard imagery contains only 6 .  There is so much more evident in the SRSO in terms of convective development and outflow boundaries and interactions with other cells not so easily seen or imagined in the standard  imagery.  Click on the images to see the animation.  MrSnow/Shasta


VISSRSO

VISnorm

Tags: None

NUCAPS soundings just in time

A nice clear field of view in was in the development region southeast of Denver. Based on the differences in CAPE analysis in the LAP, GFS, and RAP, the NUCAP sounding was available at the optimal time to check its vertical profile, observed and derived CAPE in the undisturbed environment where the storms were headed.  This image below shows that clear area on the visible imagery vicinity KLHX La Junta, CO where the surface temp and dewpoint were 83/59.  The unmodified NUCAPS  sounding yielded about 1900 J/kg SBCAPE as the surface dewpoint was 60 but the temperature was much cooler than observed.  However, modifying the sounding with the observed surface T/Td at KLHX, the resulted CAPE was over 2800 J/kg much higher than just about any other method.   MrSnow/Shasta

NUCAPSpick


NUCAPS_Unmod

NUCAPSmod

Tags: None

LAP gets a bad RAP

Looked at the LAP CAPE output again today at 1800 UTC 11 June 2015 southeast of Den ver, CO.   It did not seem to capture the magnitude of the CAPE.  In the first image below the sampled 460 J/kg grid seems to represent where the satellite added information to the GFS background and agreed nicely with the GFS 6h first guess.  The overall gradient and orientation seems pretty good as well. CAPE

The problem is that the CAPE seems very low when compared to the RAP analysis.

Given the strong supercell development, tend to believe the RAP vs the LAP analysis.  The second image below shows the same sampled location in the LAP. That is overlaid with the RAP which is showing 1600 J/kg at 1800 UTC.

RAPLAP

MrSnow/Shasta


Tags: None

Downstream SVR for Reno and beyond Charley

SVR2_ICT_2SVR2_ICT_1

Lightning data steady state on time series.  DVIL is a little low, but SRS showing another updraft with shadow in the area of the cell.  Had a report earlier of pea size hail in Langdon, which was southeast of the core.  ProbSevere indicated a mature storm with continued high values.

SVR2_ICT_3

Tags: None

Using All Tilts Base Data to interrogate long-lived supercell SE of PUX

This amazing supercell has persisted since just after 1900 UTC and its now 2330.  Used  Using All Tilts Base Data since FSI is not available to us.   The radar base data is still the goto basis for warnings, while algorithm output can increase confidence or alert or provide a “safety net” if storms develop in areas you might not be monitoring or while you are busy issuing warnings.  Can you see the NOAA seagull signature?  MrSnow/Shasta

PUXZPUXV........

Tags: None

Cell split in Reno county Charley

reno_county_split

Cell in Reno county split.  Cell track from ENI helped set the warning in the correct direction, along with following where the All Tilts showed the core was moving.  SPC meso showed a higher value of the left moving supercell parameter.

left_moving_sc

Tags: None

Integrating SRSO Visible imagery with 1 minute total lightning data

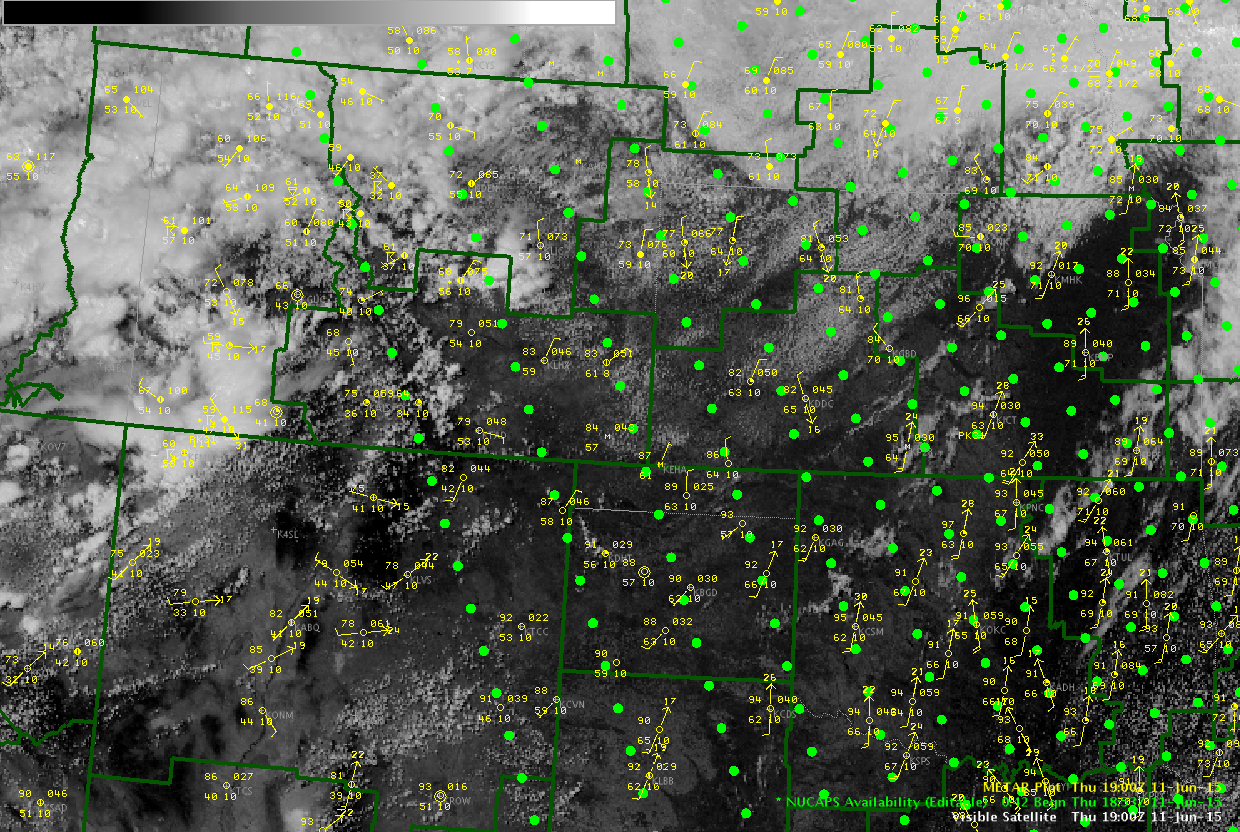
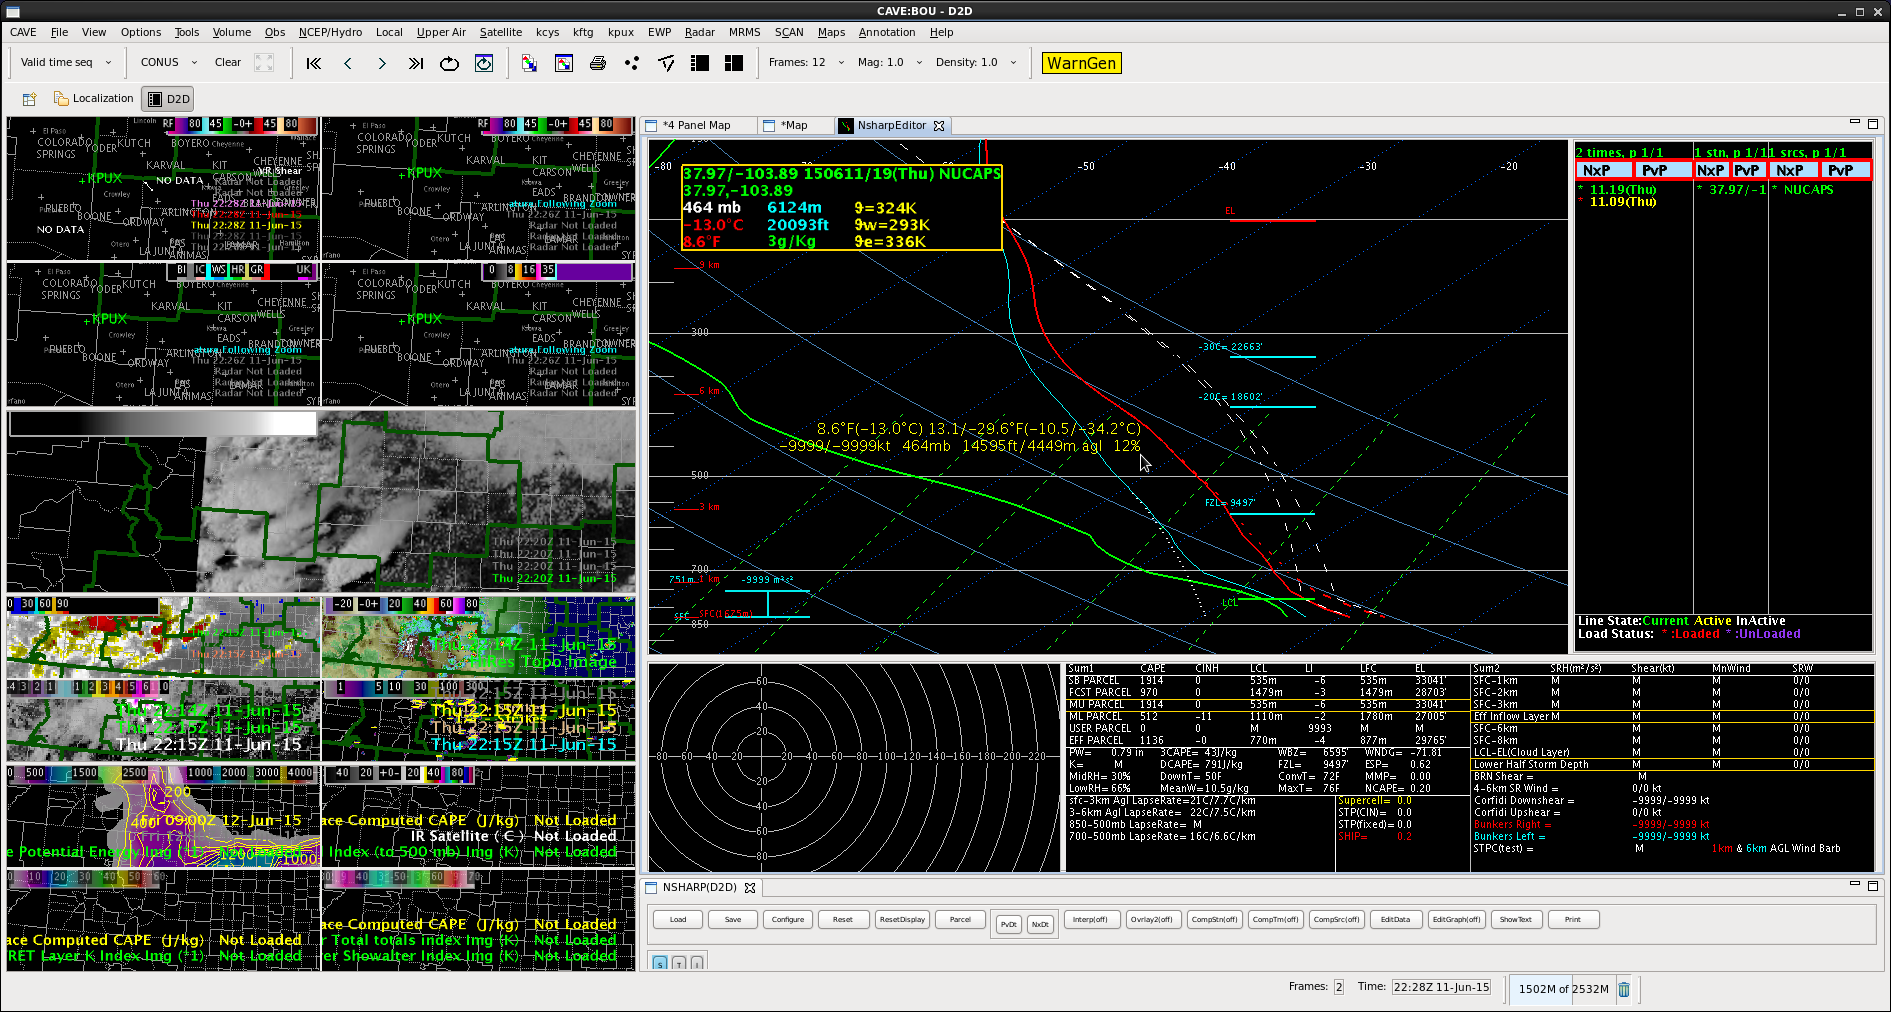
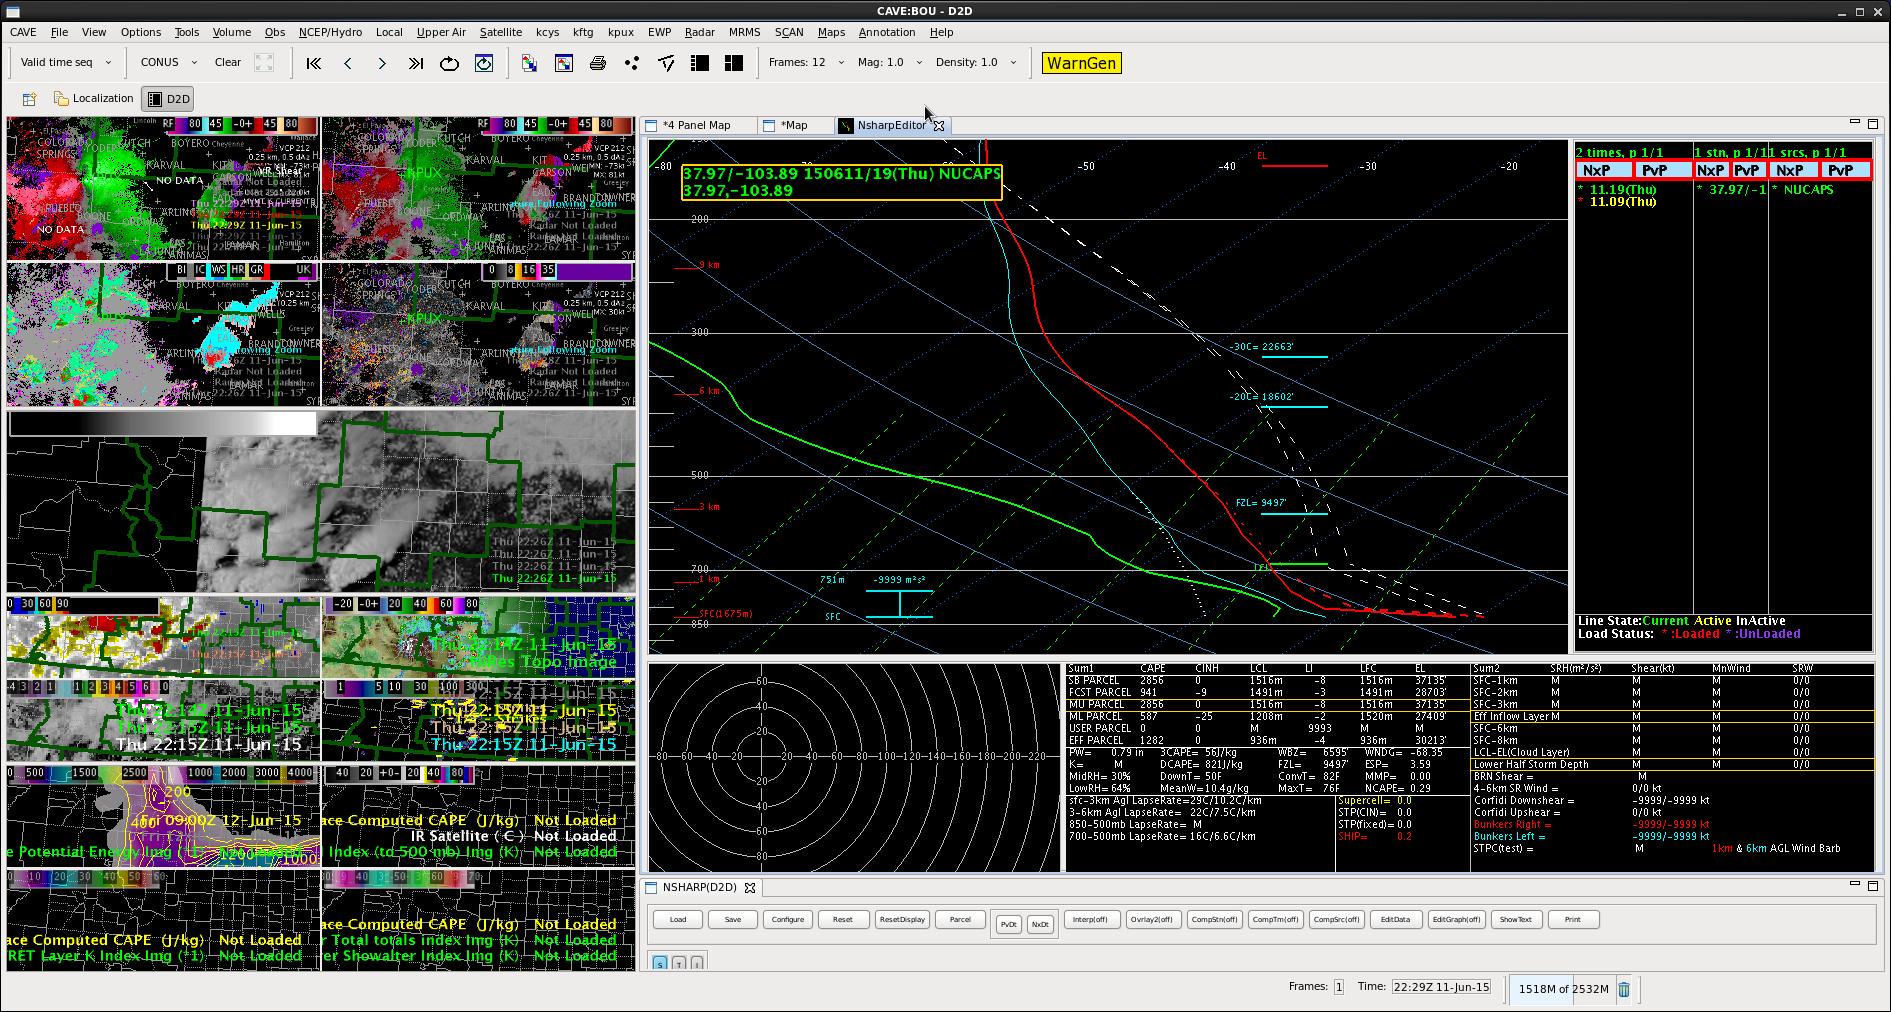
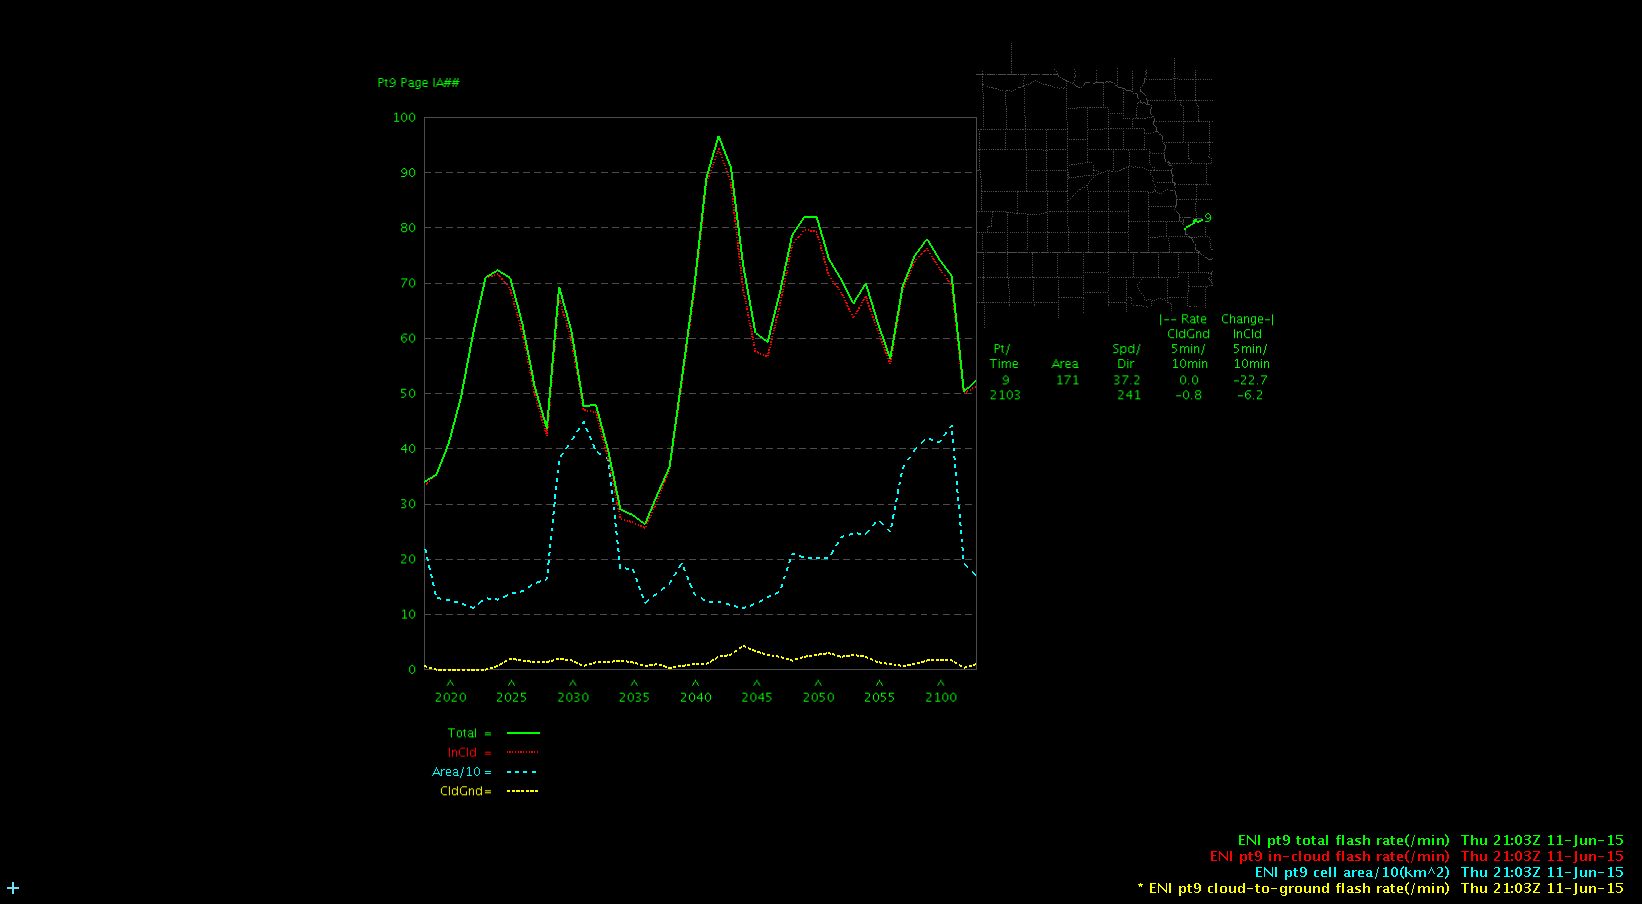
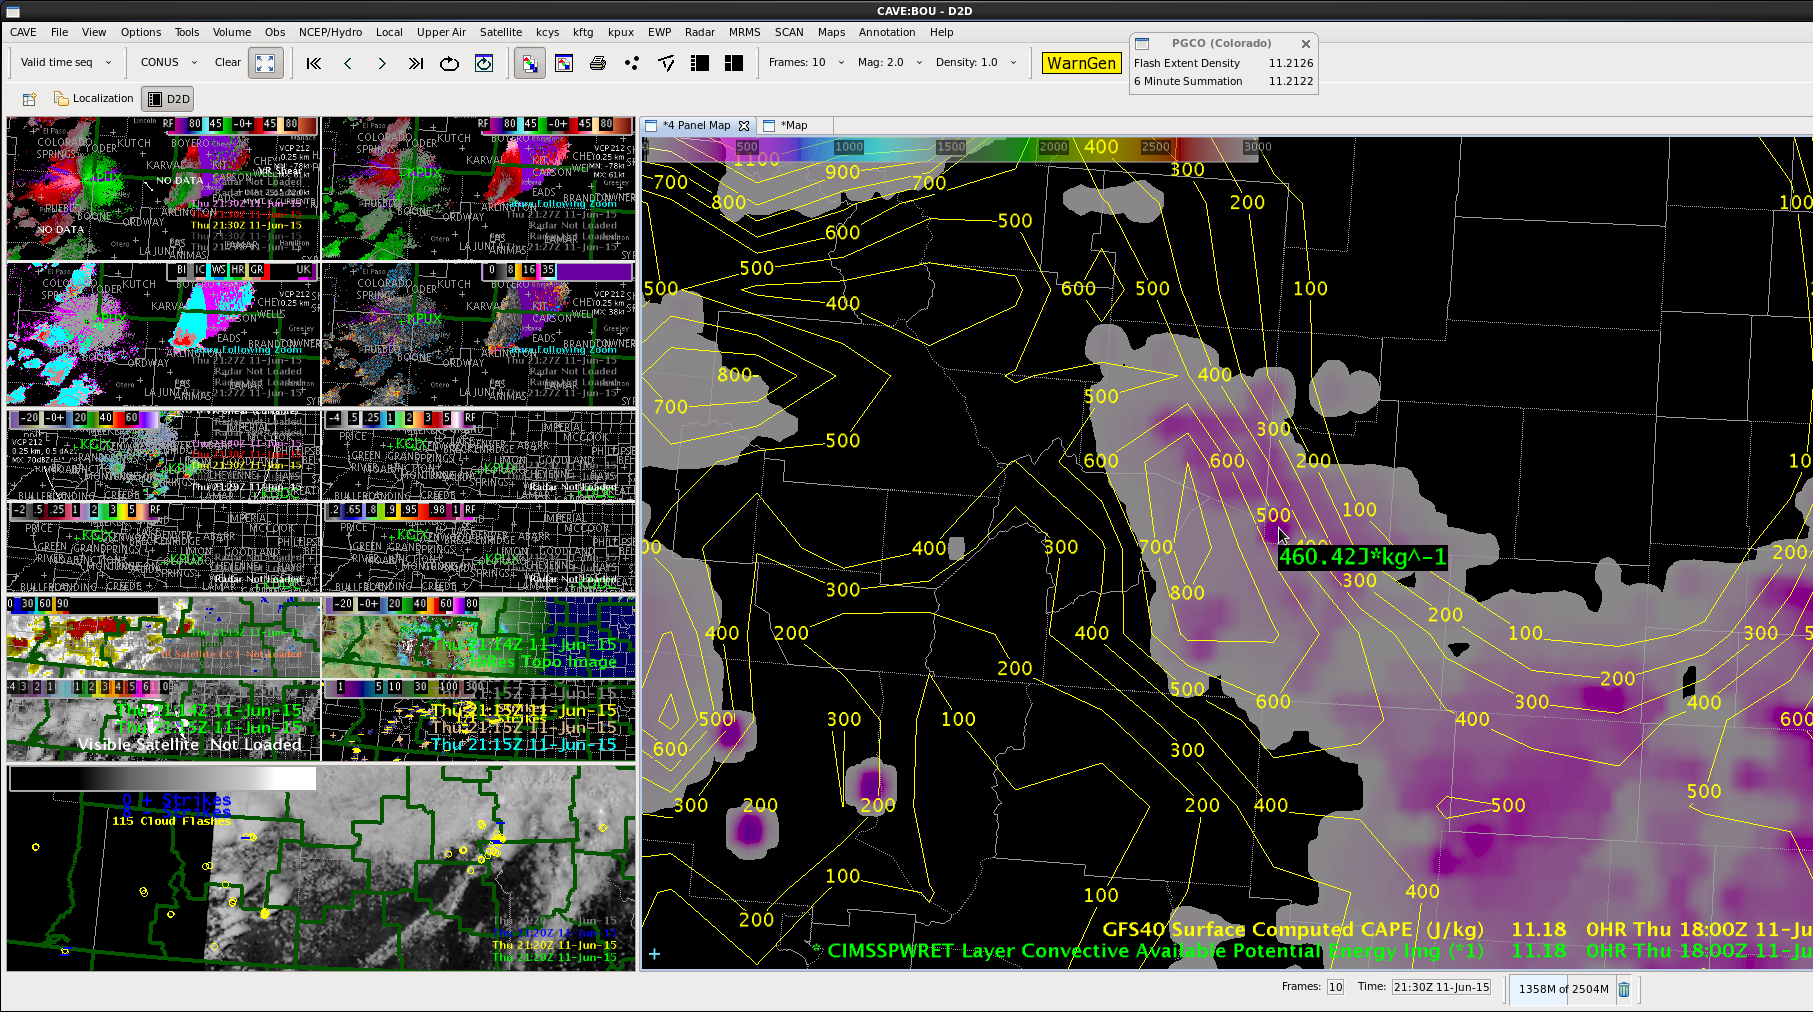
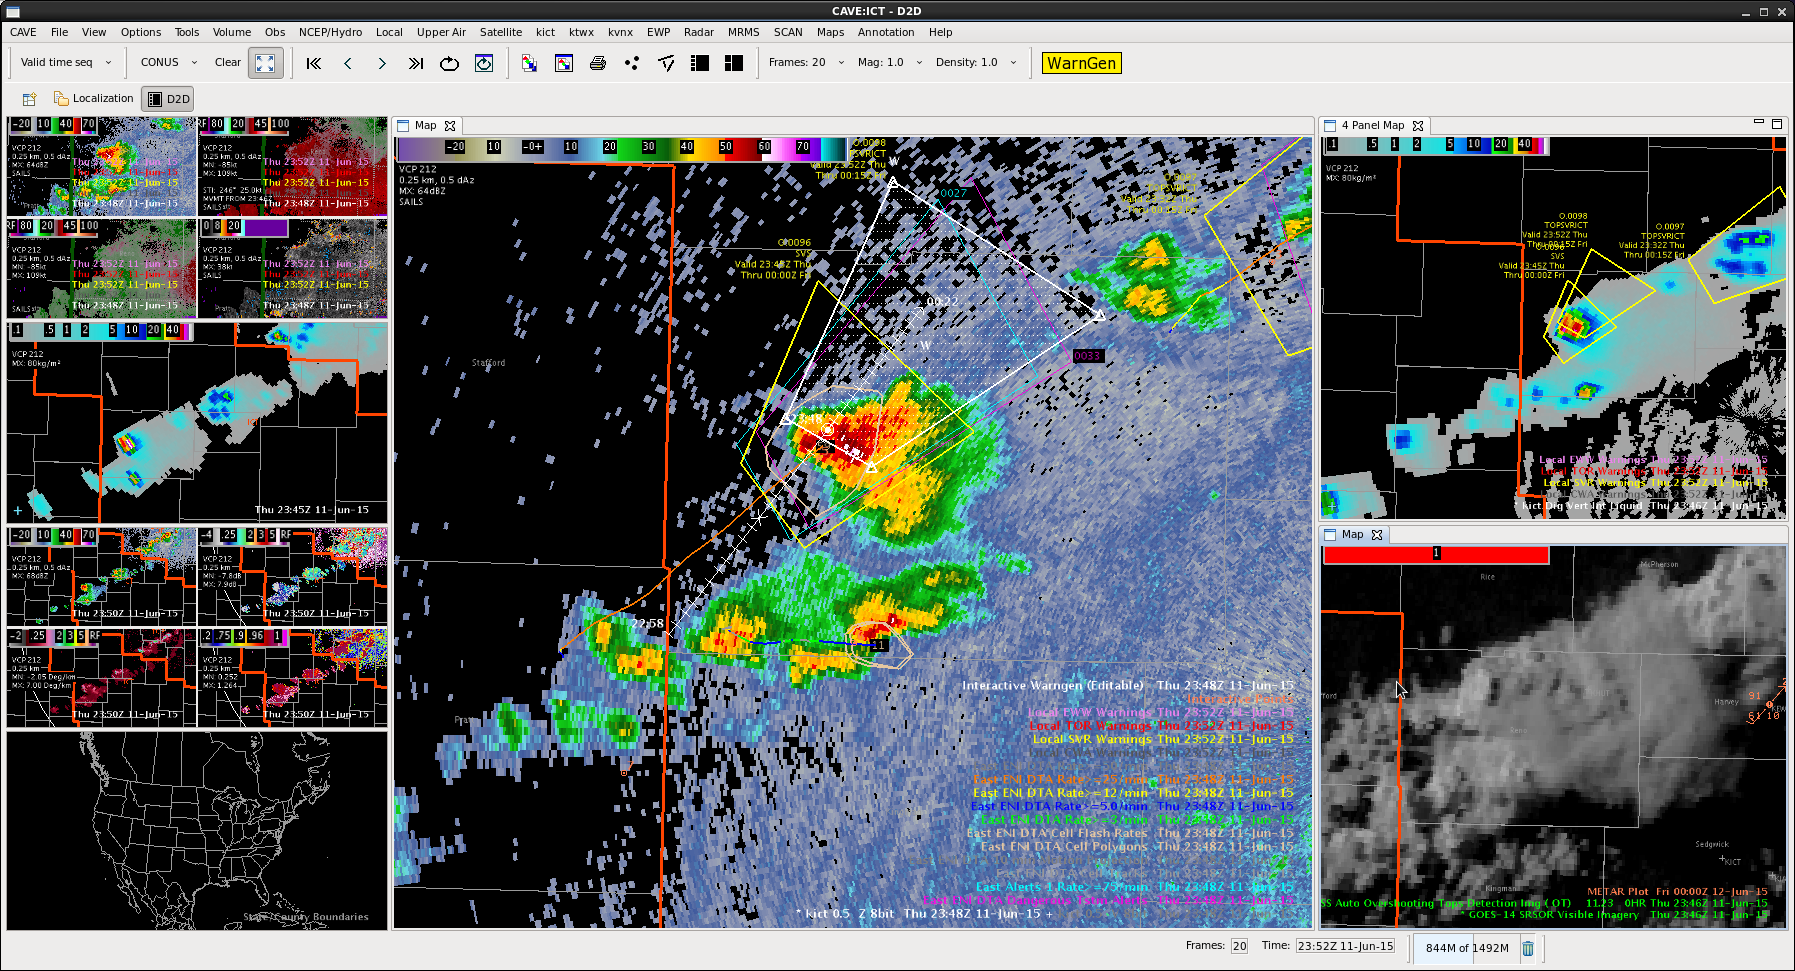
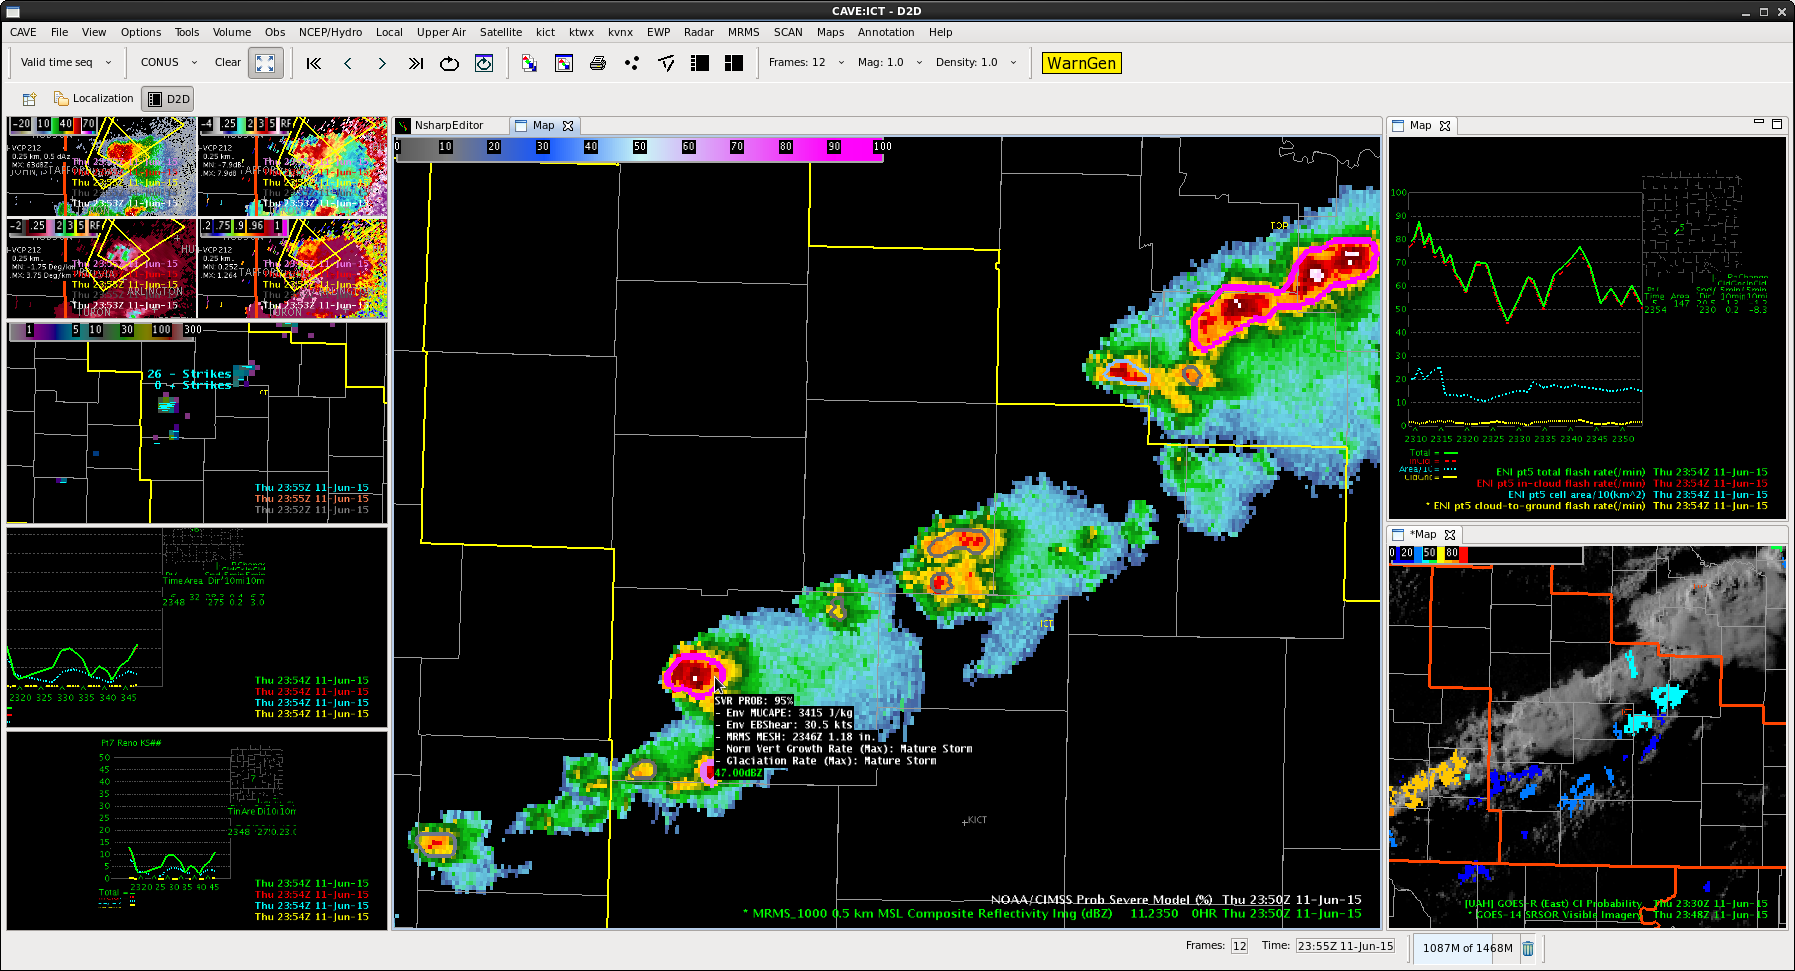
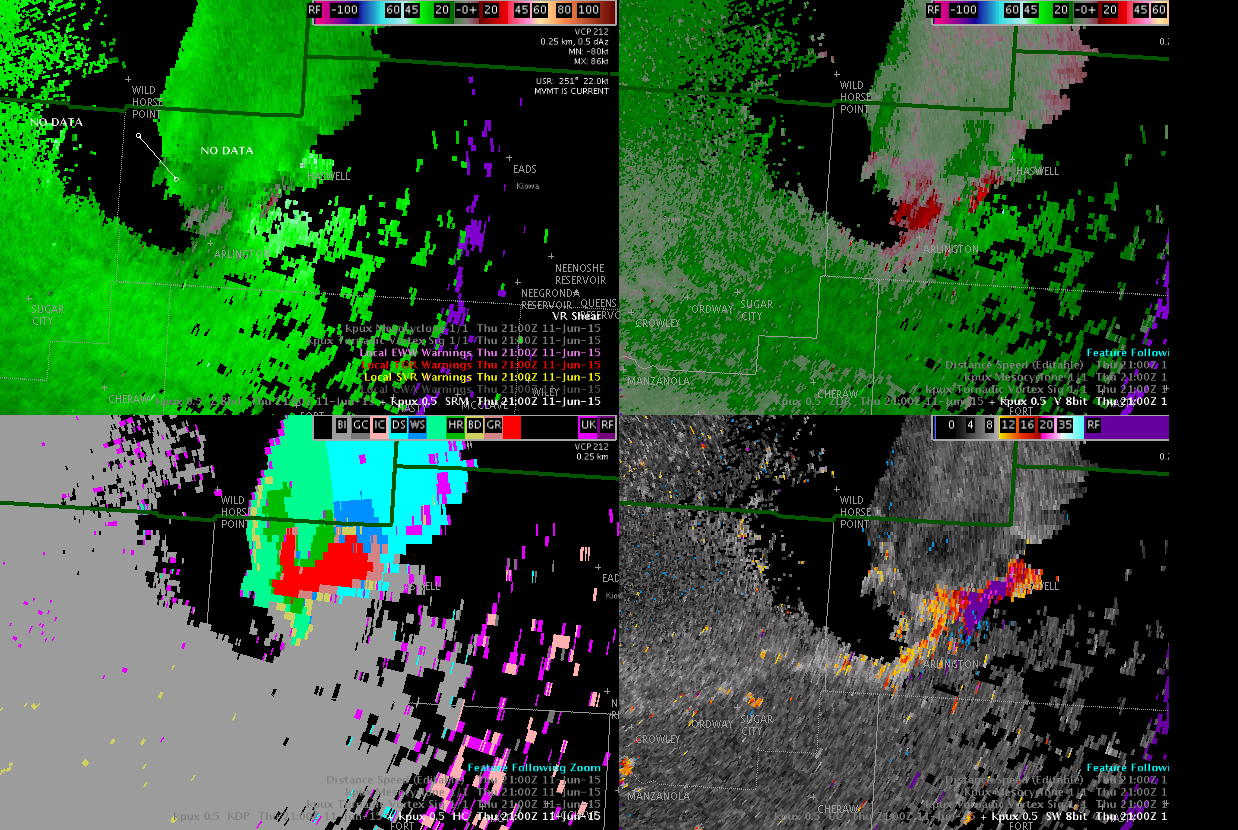
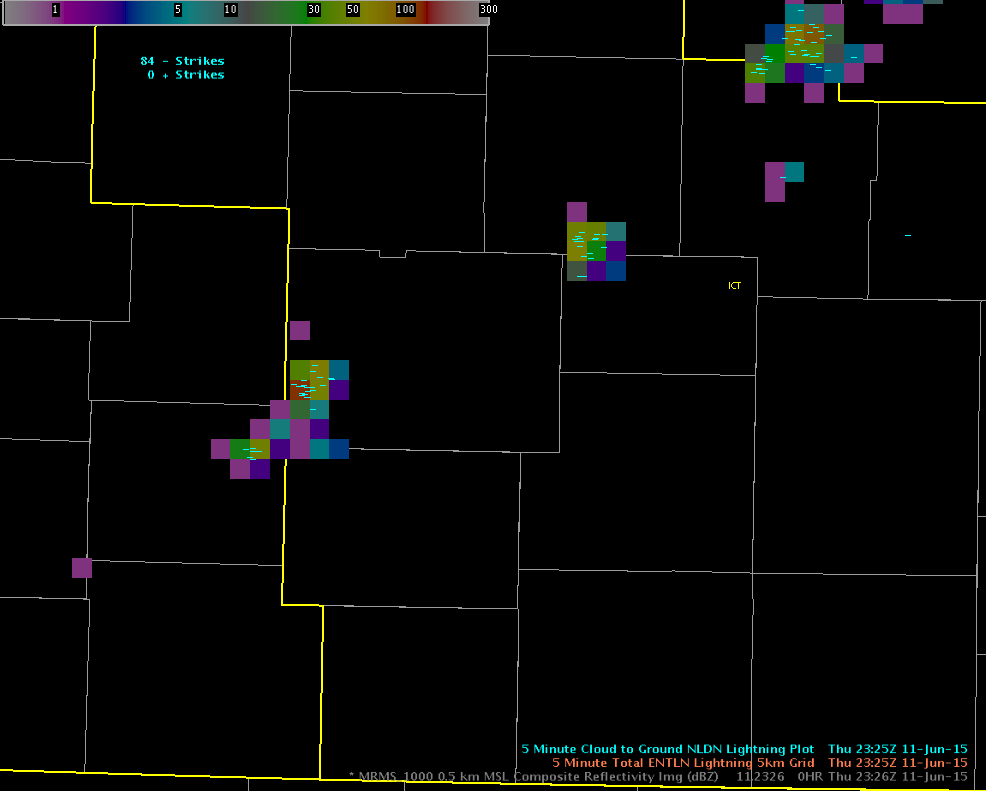
In the images below the SRSO 1 minute imagery and 1 minute total lightning data were integrated to provide a visualization/conceptualization of the evolution of the storms updraft location and distribution of cloud flashes (yellow circles) and cloud to ground strikes (dark blue +/-).  We were able to save the editor display, open up the xml file in the localization perspective and change the frame count from 65 to 120 to get a longer loop. You can then open up the editor display for later use.

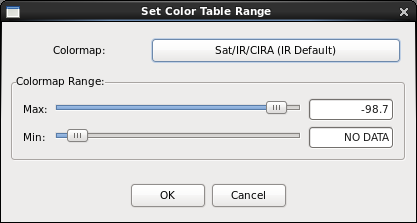
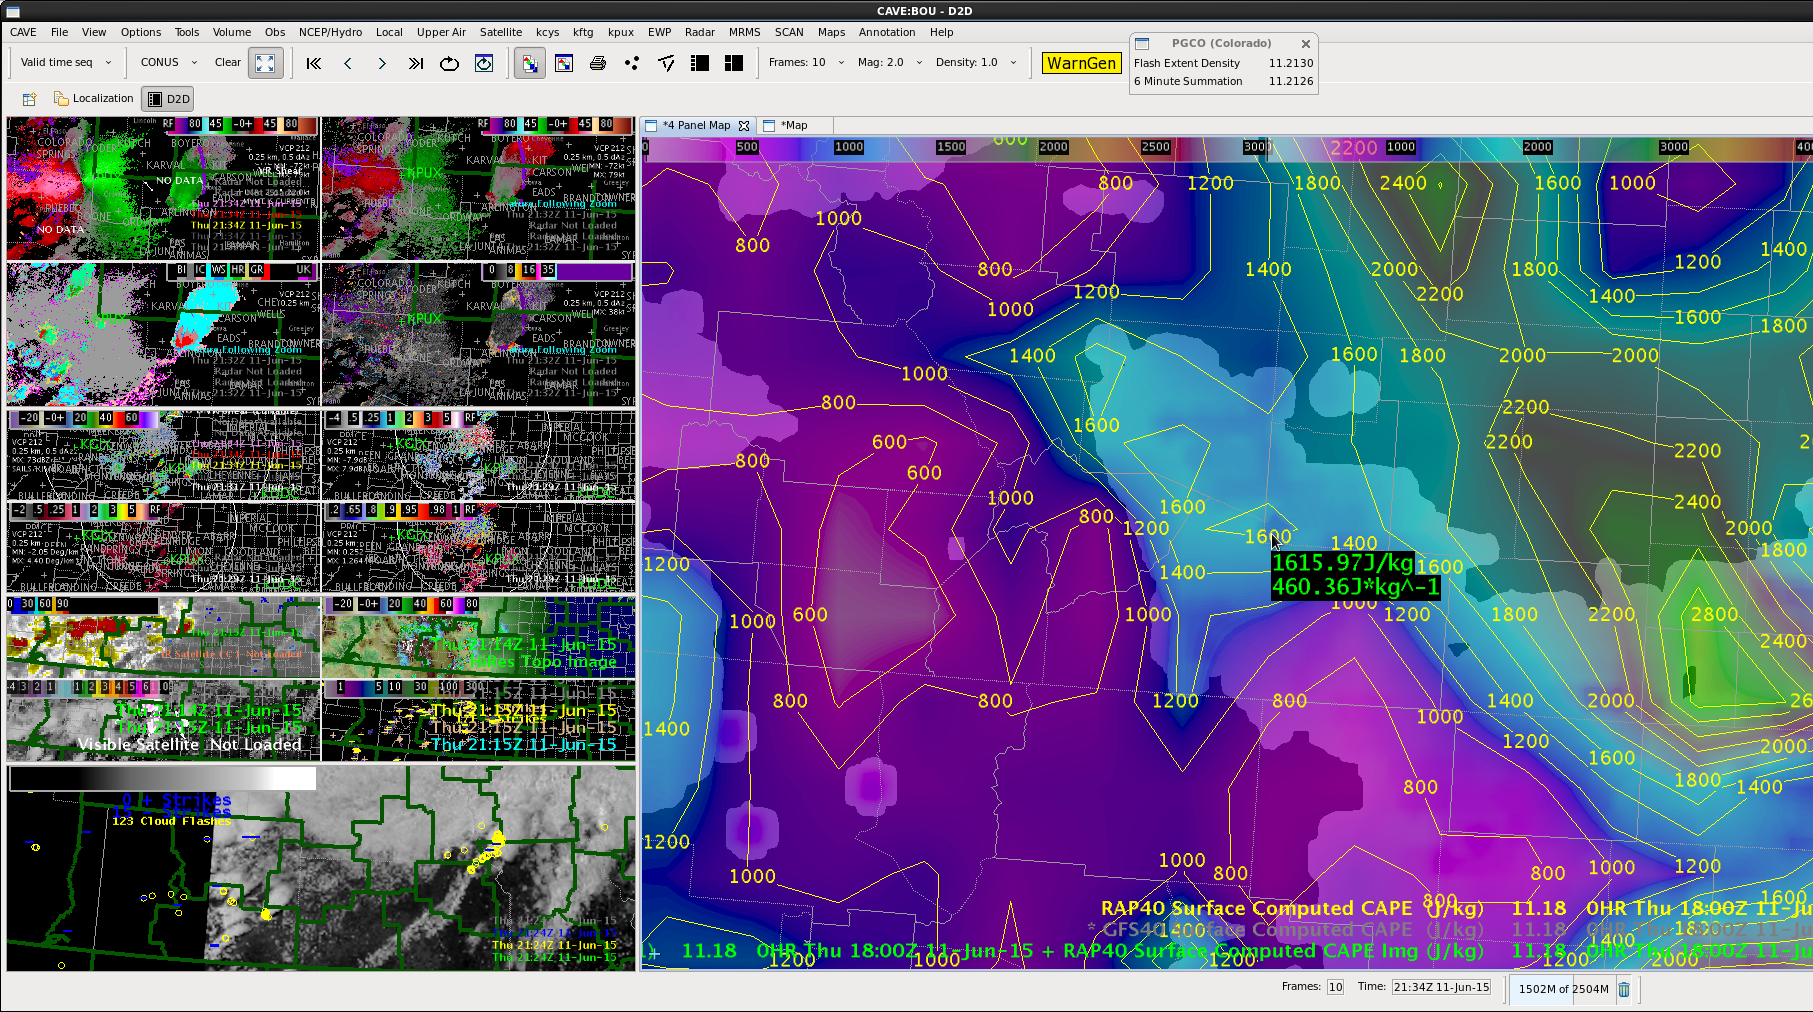
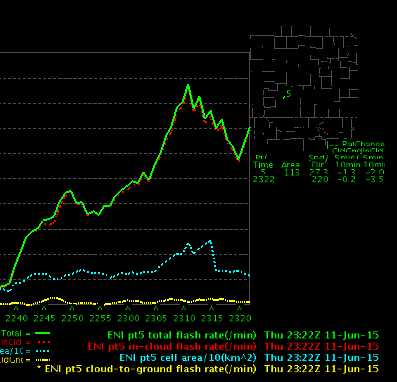
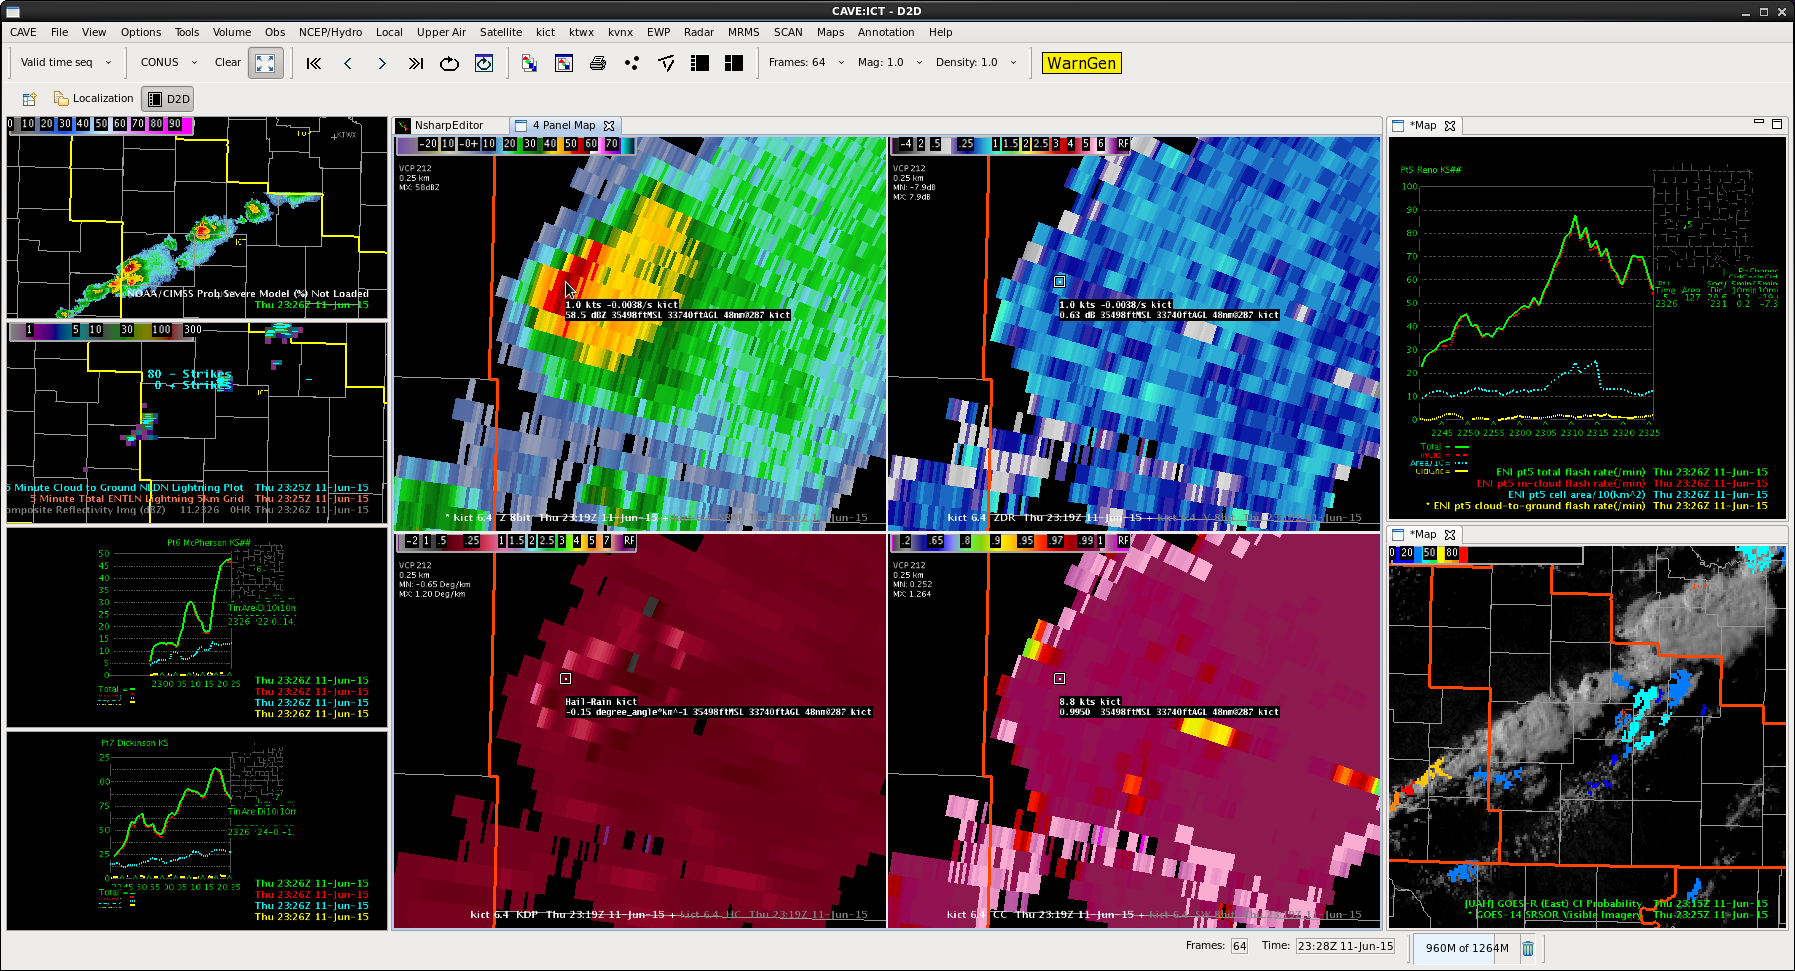
Also used the SRSO IR images, used the interpolate image on the imaging option to smooth out the IR. The Change Colormap option to adjust the color scale to better enhance the cold top of the storms to fit today’s situation.  I also overlaid the GOES-R Pseudo Geostationary Lightning Mapper (PGLM) Surface Flash Extent Density product to monitor lightning along with the 1 minute ENTLN data.

Click on the images to see the animation.  MrSnow/Shasta

SRSO
SRSO_IR

Screenshot-Set Color Table Range

SRSO_IRa


Tags: None

Strong PGLM surge leads to warning

A strong PGLM surge was noted just before issuing a warning. A strong to severe thunderstorm developed over the southern suburbs of Denver. The cell had a history of nickel sized hail over south Denver. An boost came in the form of an outflow boundary coming in behind the cell. A warning was issued. Unfortunately, it appears that the Lightning Jump algorithm was a no-show just before the warning was issued.

StrongPGLMWarningpng

-Shasta/Mr. Snow

Tags: None