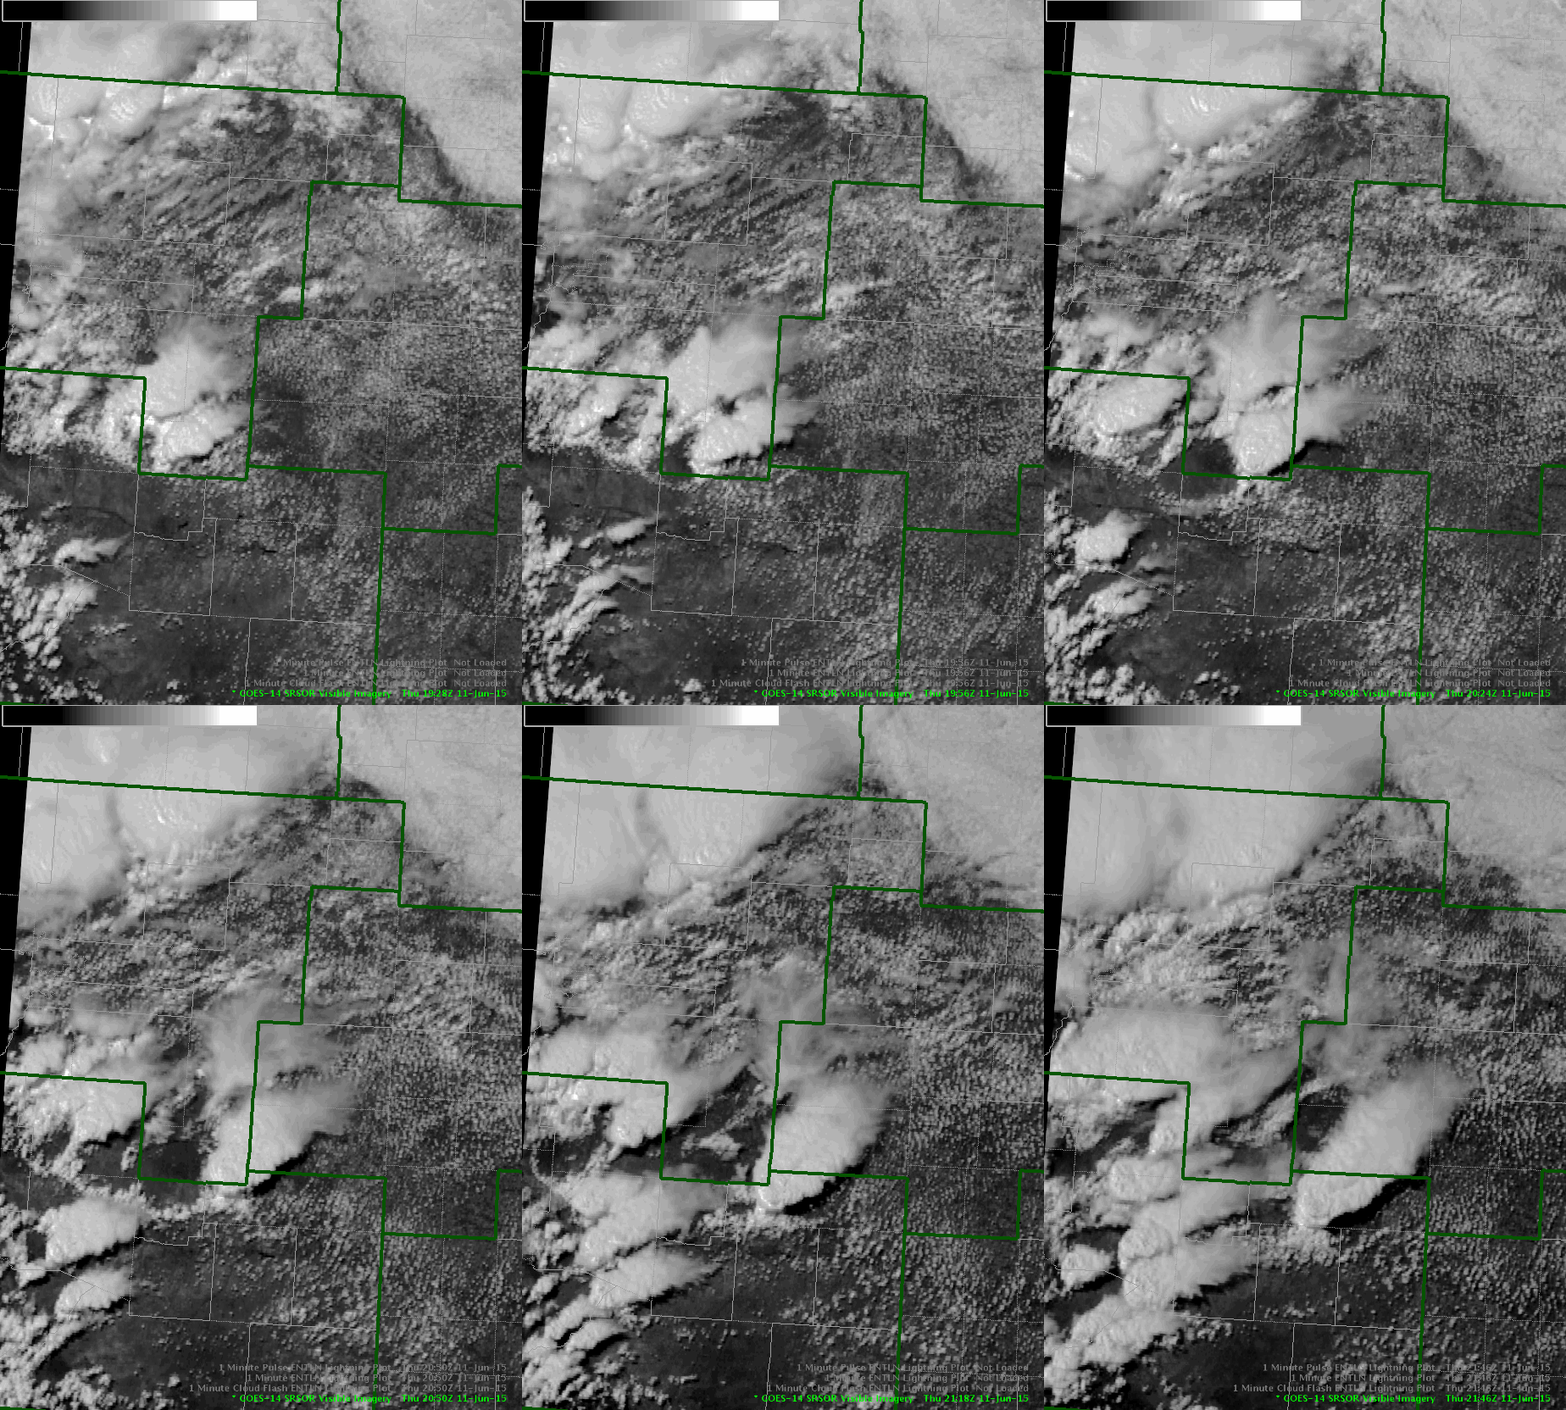
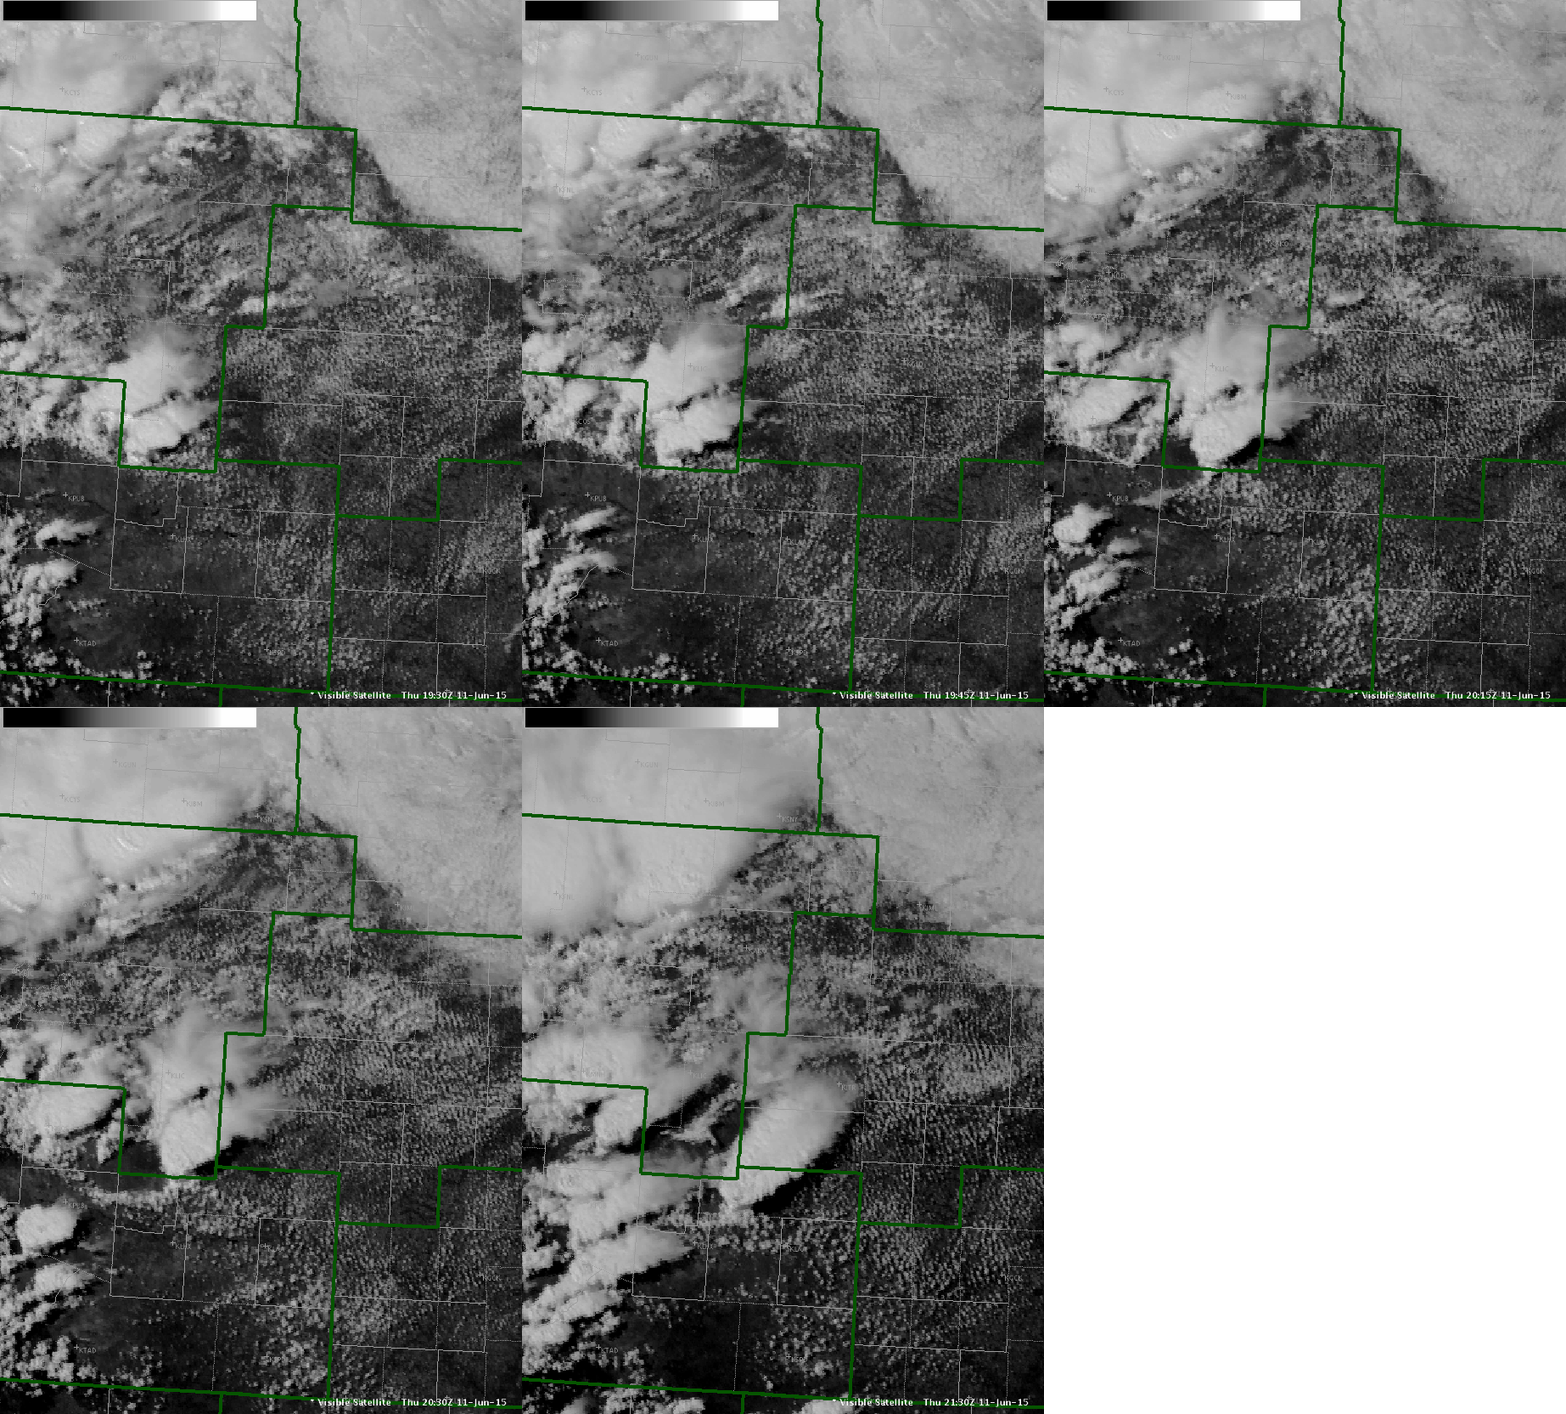
Just to compare and contrast what GOES-R and SRSO offers compare to routine visible imagery is shown below. The SRSO loop contains 120 images while the standard imagery contains only 6 . There is so much more evident in the SRSO in terms of convective development and outflow boundaries and interactions with other cells not so easily seen or imagined in the standard imagery. Click on the images to see the animation. MrSnow/Shasta


