In the images below the SRSO 1 minute imagery and 1 minute total lightning data were integrated to provide a visualization/conceptualization of the evolution of the storms updraft location and distribution of cloud flashes (yellow circles) and cloud to ground strikes (dark blue +/-). We were able to save the editor display, open up the xml file in the localization perspective and change the frame count from 65 to 120 to get a longer loop. You can then open up the editor display for later use.
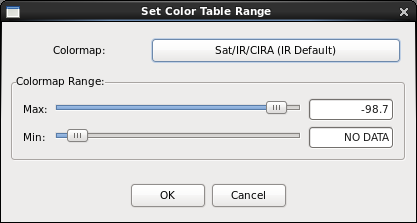
Also used the SRSO IR images, used the interpolate image on the imaging option to smooth out the IR. The Change Colormap option to adjust the color scale to better enhance the cold top of the storms to fit today’s situation. I also overlaid the GOES-R Pseudo Geostationary Lightning Mapper (PGLM) Surface Flash Extent Density product to monitor lightning along with the 1 minute ENTLN data.
Click on the images to see the animation. MrSnow/Shasta


