NUCAPS Gradients of CAPE

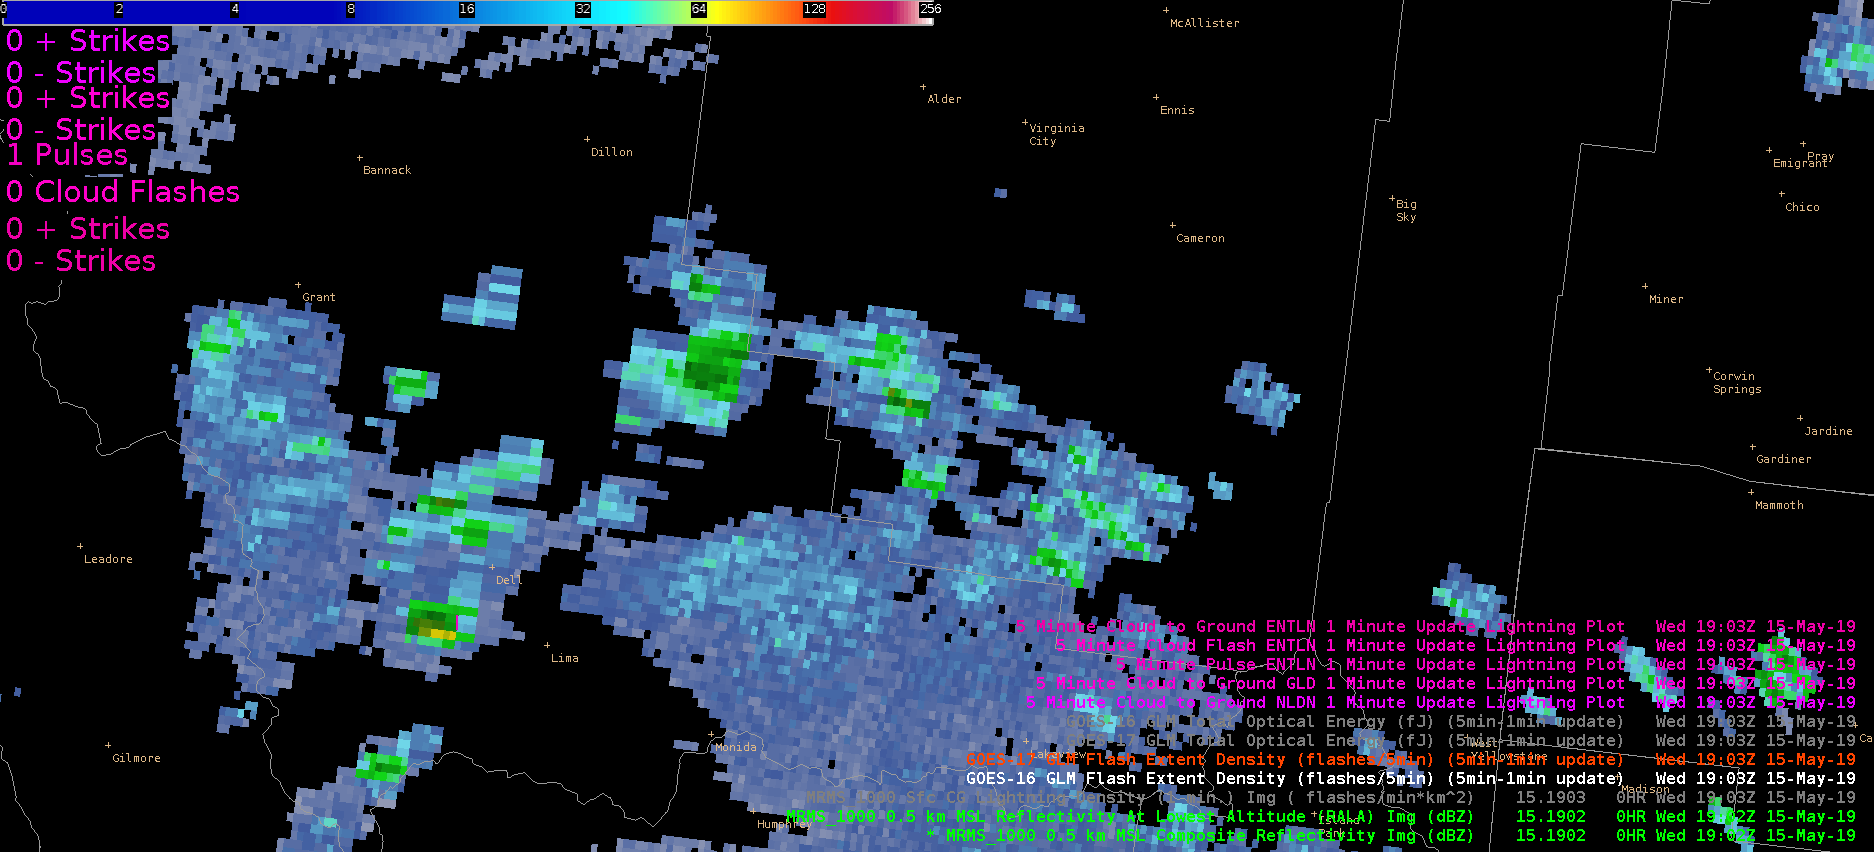
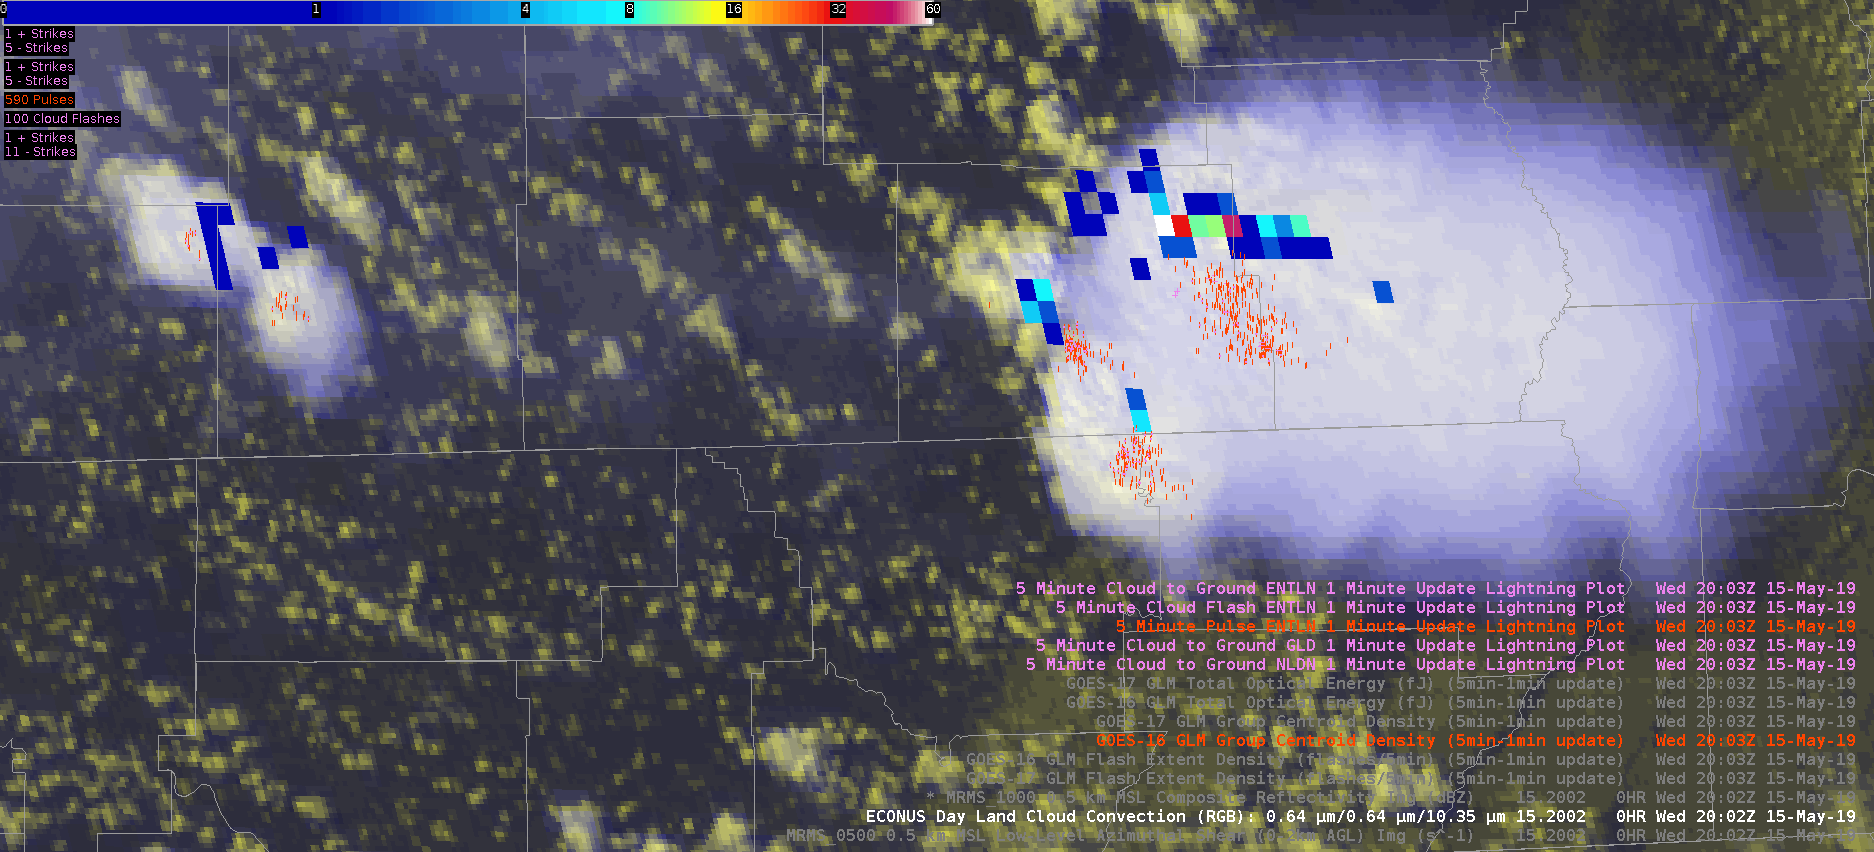
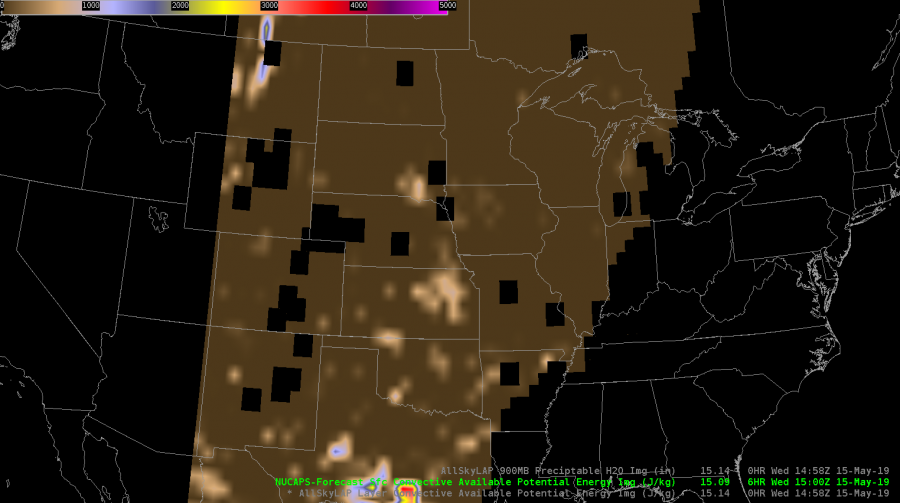
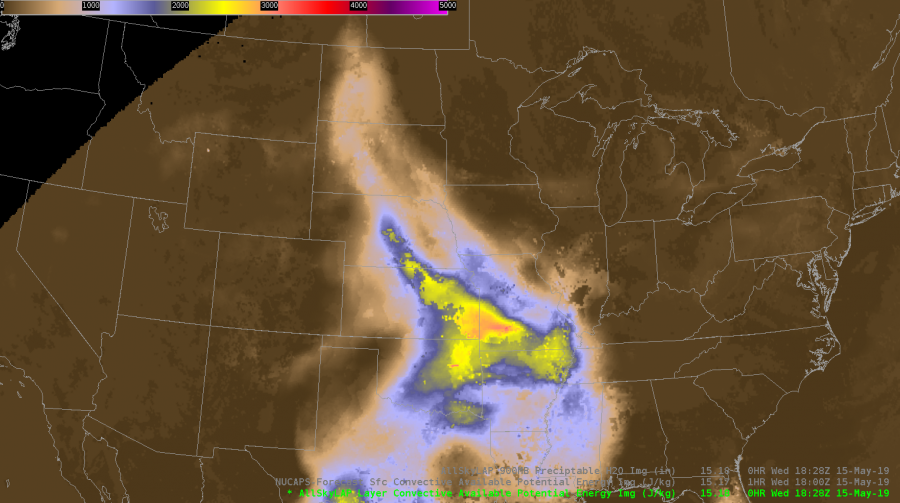
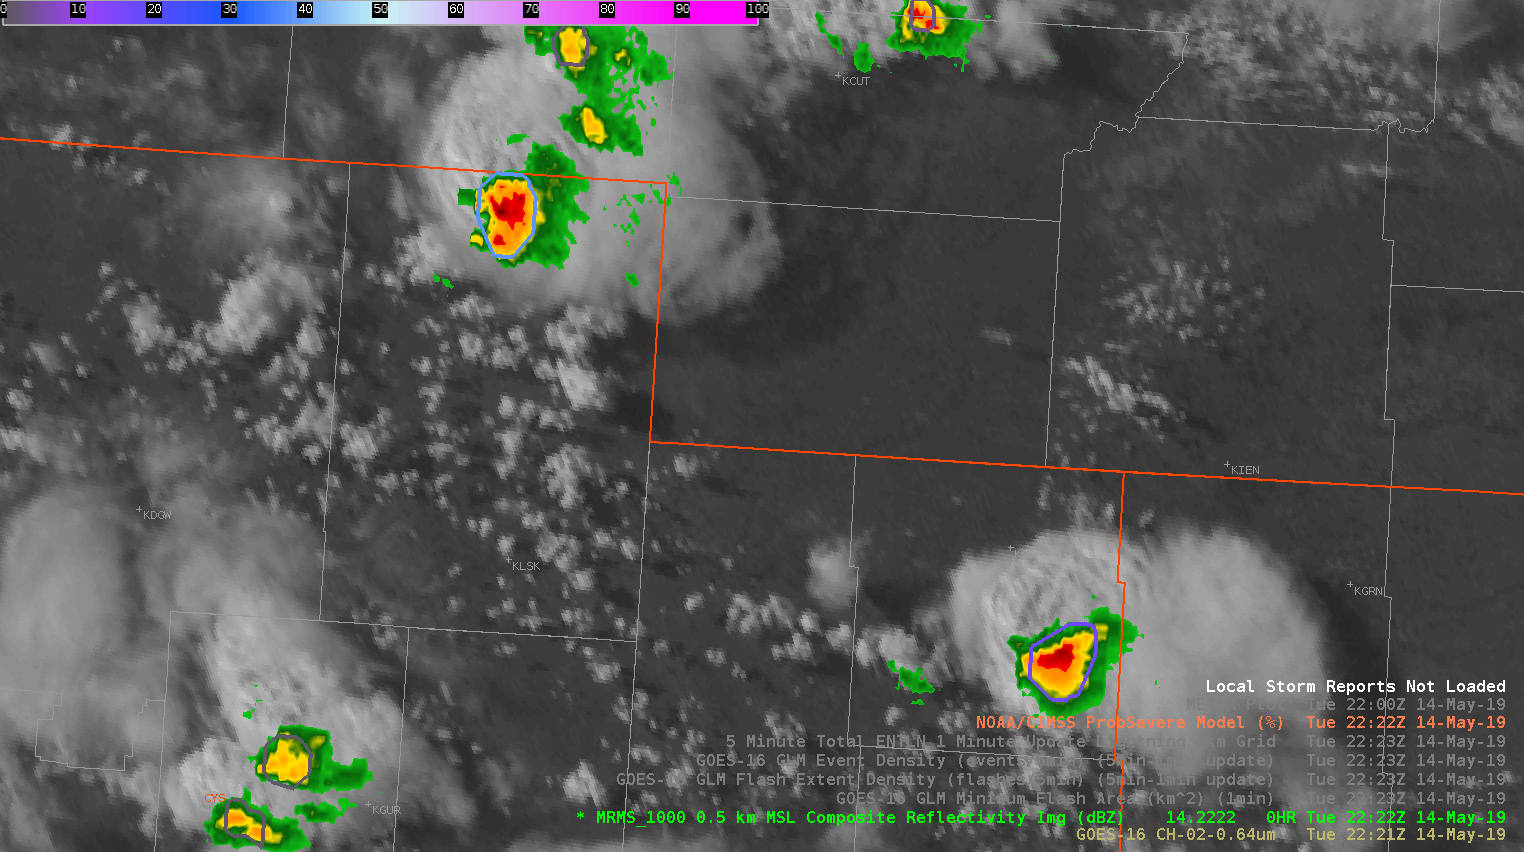
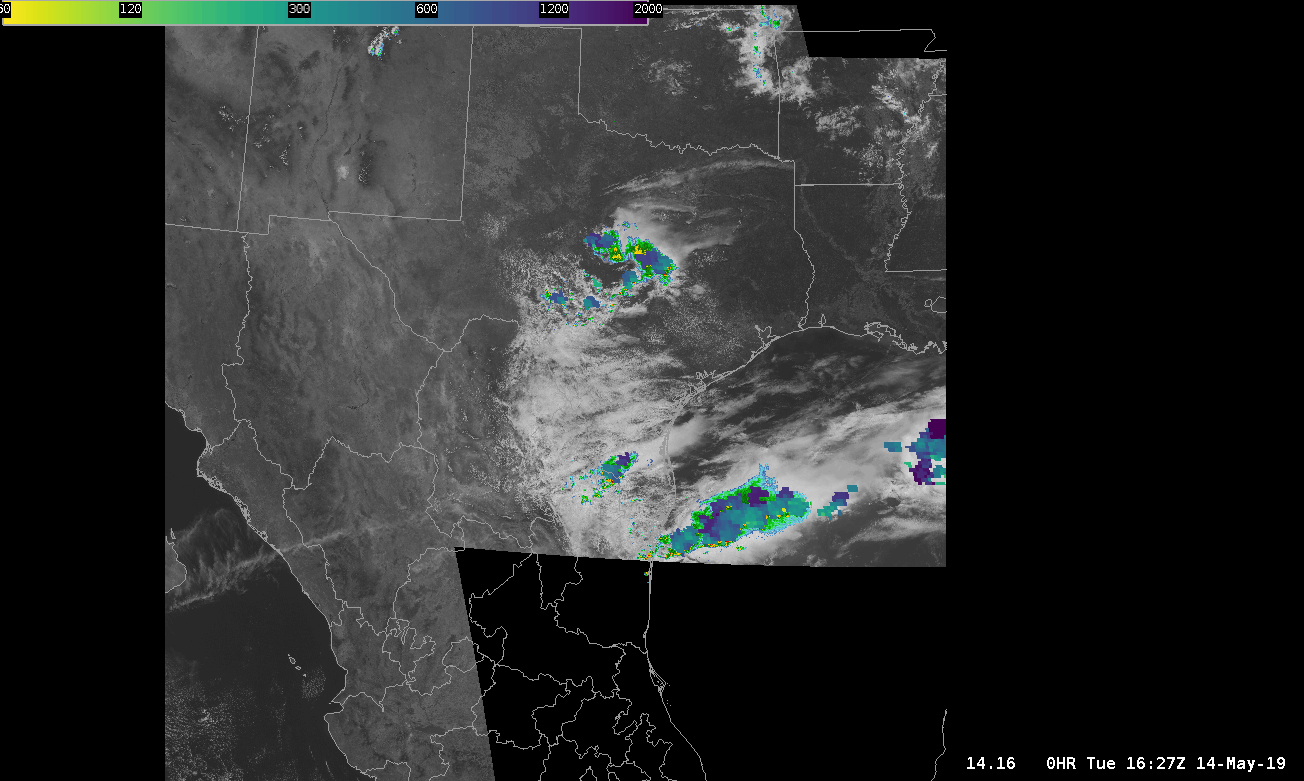
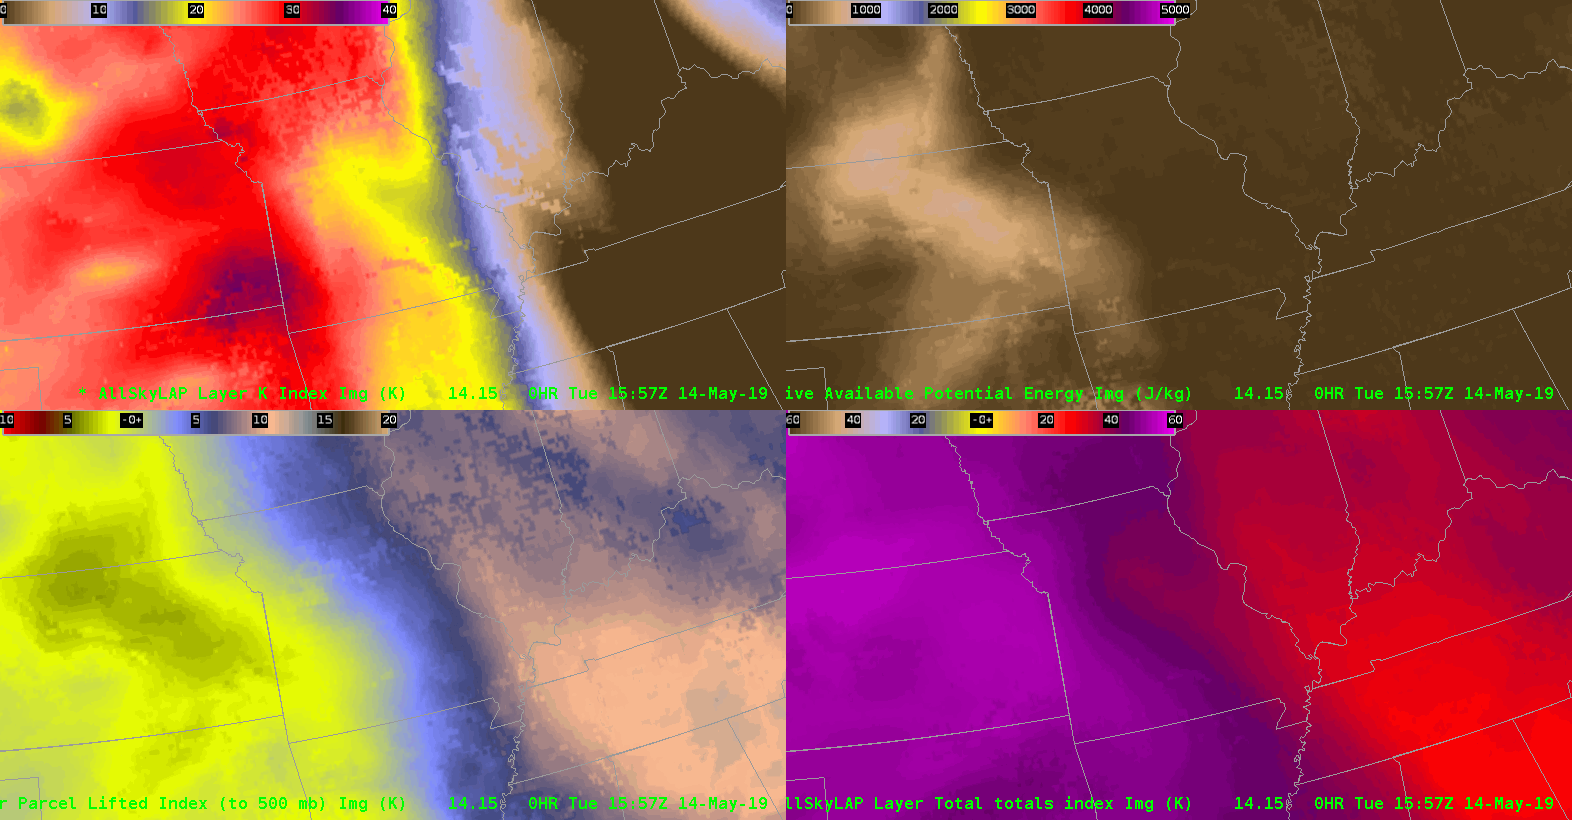
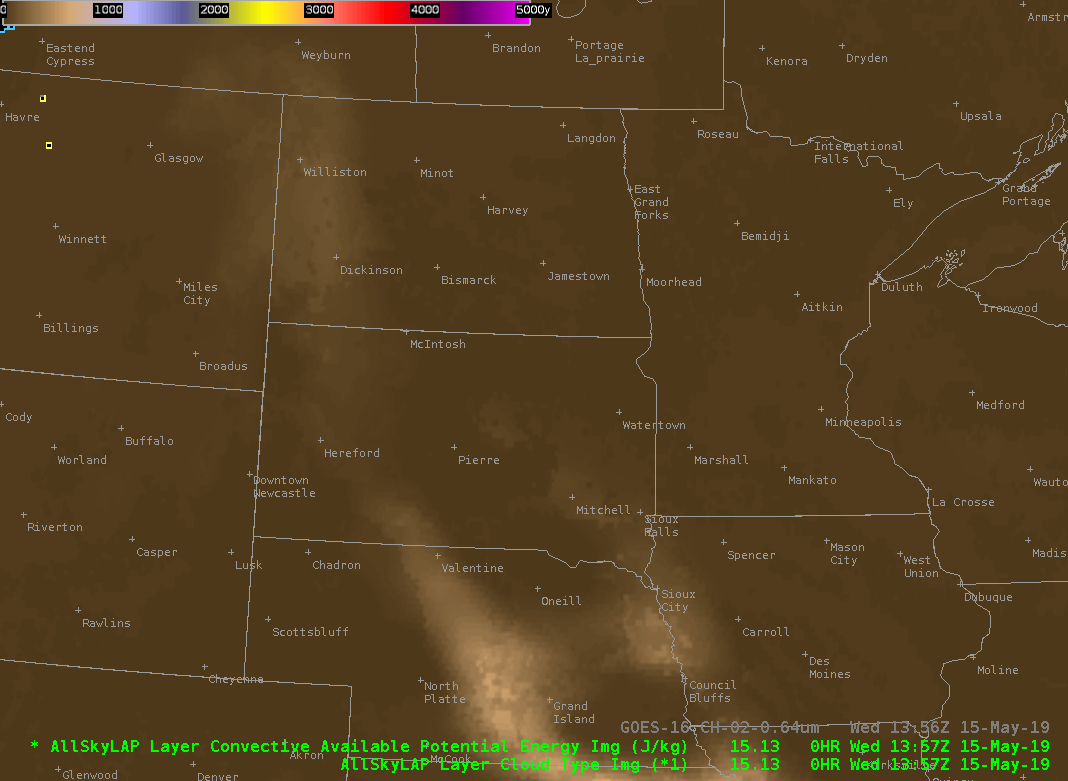
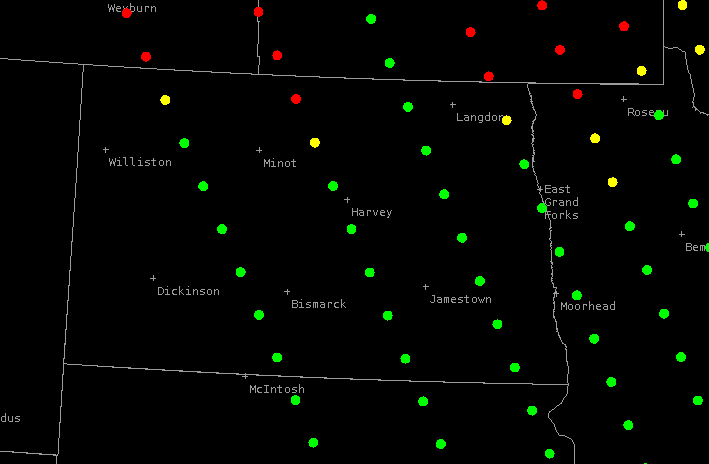
The 12Z Bismarck sounding was quite dry and and the surface observation at Bismarck was around 32F. Low level moisture has quickly rebounded this afternoon across central and western ND, however it remains dry across eastern ND. Dewpoints have come up into the upper 40s to near 50F and temperatures have climbed into the upper 70s. The AllSkyLAP CAPE loop clearly shows that instability is increasing across portions of ND with values topping out around 900 J/KG at 1930z, though most of the retrievals are GFS based because of cloud cover lingering in the area.

AllSkyLAP CAPE Loop

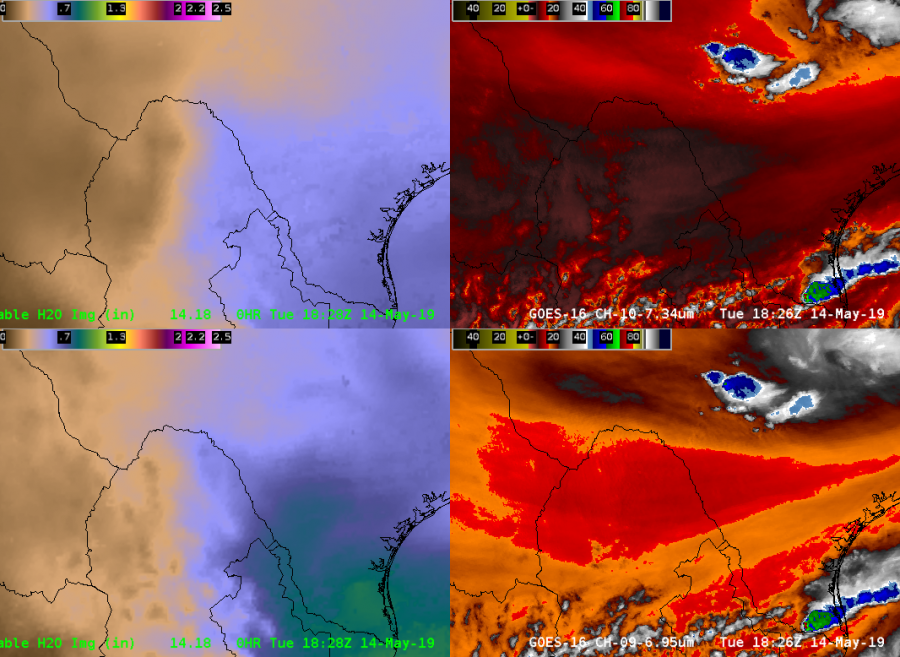
I decided to look at the NUCAPS soundings across the area to see if the CAPE values were similar. What I found was in the areas of low level moisture, the NUCAPS modified and unmodified sounding had similar MLCAPE values. However, as I checked NUCAPS soundings further east into the drier air, the un-modified soundings showed MLCAPE values that were far to high (should be near zero based on other observations), but the modified soundings were pretty spot on regarding the surface observations (especially Td, T may be slightly low), and thus MLCAPE values appeared to be more reasonable.

NUCAPS Swath. Soundings in quesiton are located just northwest of Bismarck, just northeast of Bismarck, and 2 dots east of Bismarck.

The next six images are the comparisons between the non-modified and modified NUCAPS soundings at three different locations. The first is near the peak in instability northwest of Bismarck, the second is east-northeast of Bismarck near the gradient, and the third is farther east into the drier air.

NOAA 20 Non-Modified NUCAPS Sounding just northwest of Bismarck
NOAA 20 RTMA Modified NUCAPS Sounding just northwest of Bismarck


NOAA 20 Non-Modified NUCAPS Sounding just ENE of Bismarck.
NOAA 20 RTMA Modified NUCAPS Sounding just ENE of Bismarck.


NOAA 20 Non-Modified NUCAPS Sounding 2 Dots East of Bismarck.
NOAA 20 RTMA Modified NUCAPS Sounding 2 Dots East of Bismarck.


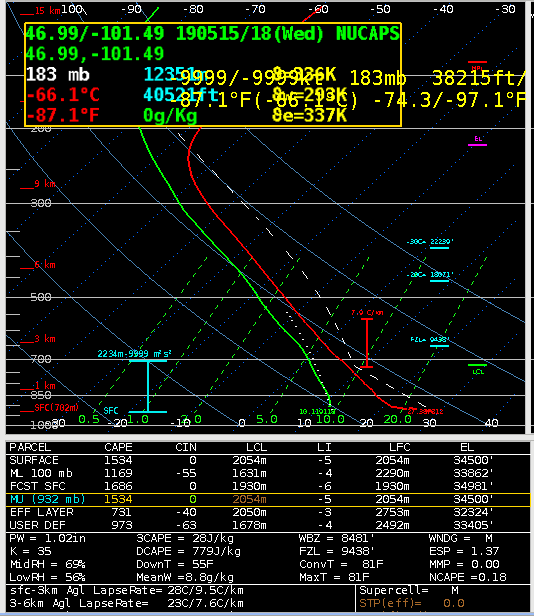
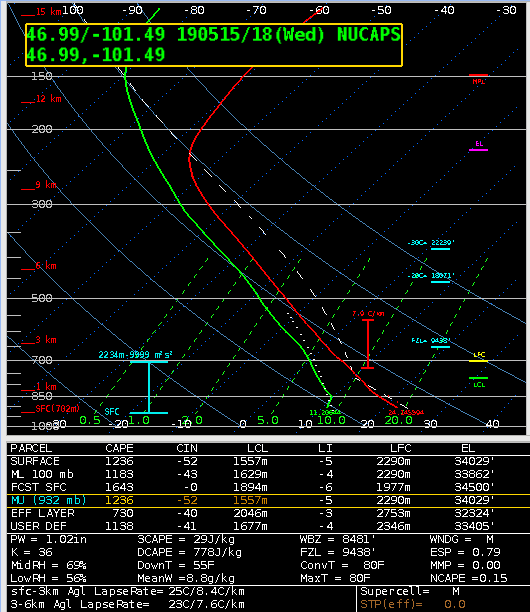
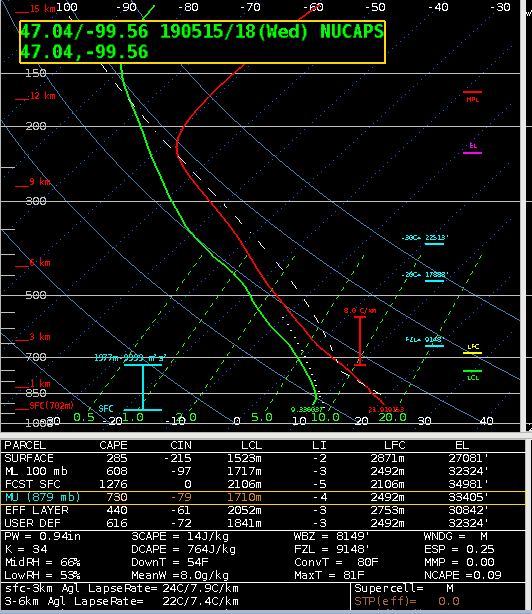
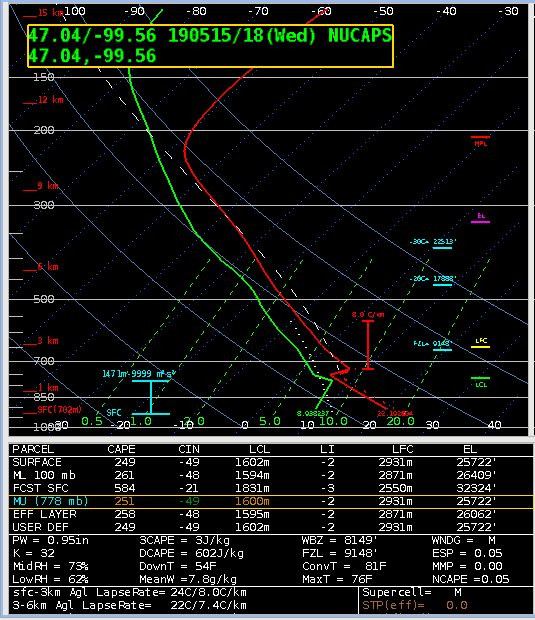
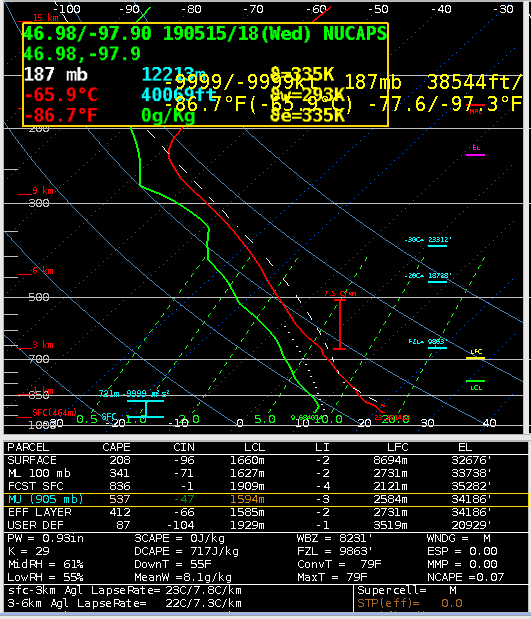
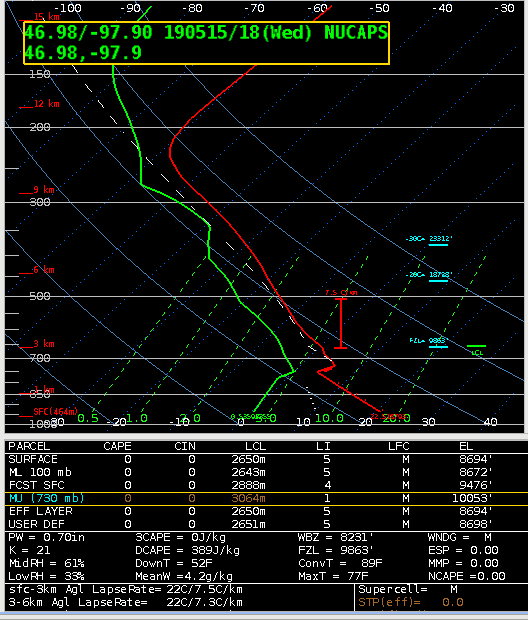
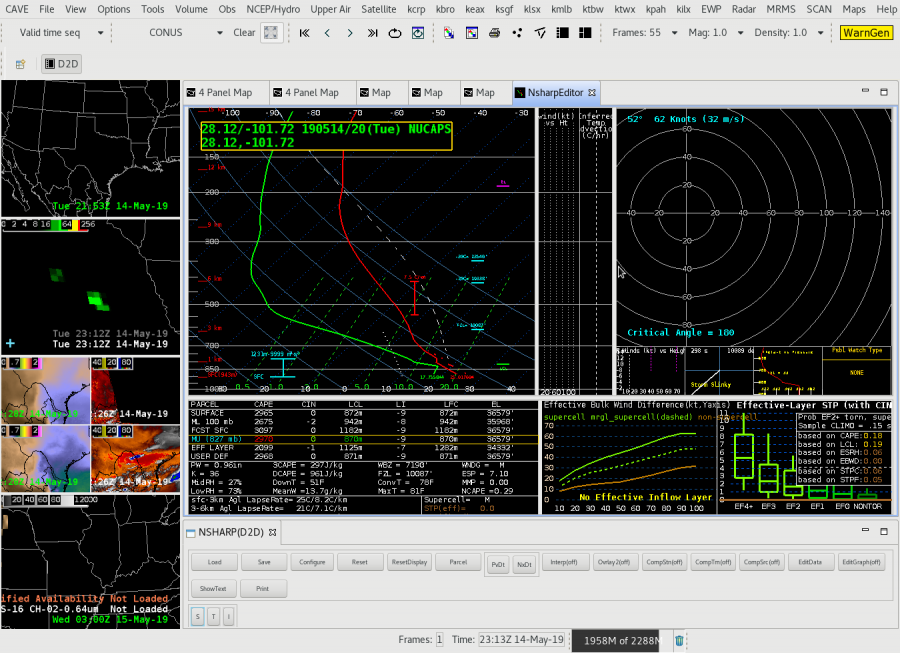
With that said, the modified soundings seemed to do a decent job capturing the gradient in CAPE. The values appear to be a bit high compared to the AllSkyLAP CAPE (1183 vs 750 J/KG around the same time), and high also compared to the SPC Meso Analysis Page (around 500 J/KG).
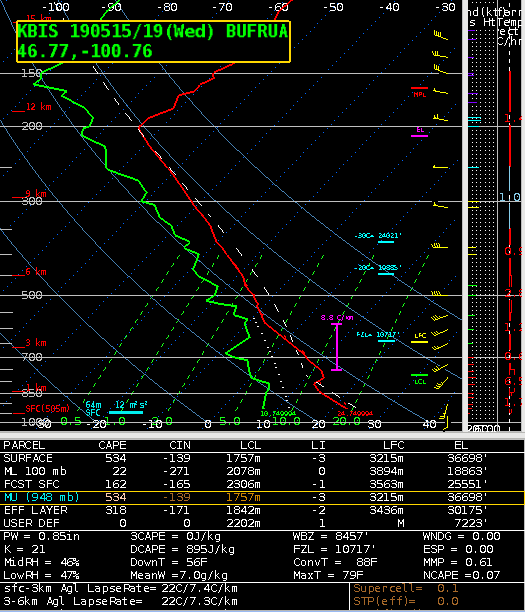
Quick update…..

The Bismarck office fortunately did a 19Z sounding, which showed very weak MLCAPE, only 22 J/KG! So both the AllSkyLAP CAPE and the NUCAPS were overdone.

KBIS 19Z Sounding

-Tempest Boomer

GLM usability in heavily parallaxed locations

It’s pretty clear to me that both the GOES-west and GOES-east are having a lot of trouble detecting lightning (GLM) in the northwest U.S. with accuracy of location or frequency due to parallax, spatial resolution, and GOES tilt sampling of storms. Below is an animation specifically over southwest Montana where the GLM displaces the FED significantly (side note: TOE was very similar for these, so FED is shown for best example), and also has trouble picking up in-cloud pulses. The ENTI is overlaid in pink to show the differences in GLM vs ENTI. If you watch closely, the first frame depicts an ENTI in-cloud lightning flash & pulse in the far southwest portion of the screen, where no GLM FED (or TOE; not shown here) was even detected. There is also some instances where the GLM places lightning pixels where the ENTI or NLDN does not show anything in the same time frame (also making it hard to verify both products).


Below is a separate example where the FED does not show what I would expect it to show for a central Wyoming storm (differentiating intensity as well as location and timing). The GOES-east is the first to detect, then the GOES-west detects thereafter. GOES-east and GOES-west did not detect at the same time in any frame. Both products are loaded as a 5min-1min update.


Now here’s a case farther south in New Mexico where a storm cell is of comparable intensity as the northern examples. The GLM detection seems more accurate than the MT case, but the last frames here show that the GLM also has trouble with keeping FED on the cell core of interest.

Interestingly enough, the TOE (shown below) does a better job here  in NM with spatial coverage than it did up north in MT, but still has displacement issues comparing to ENTI and MRMS storm cores. I find that the TOE (especially with GOES-west) does a better job at recognizing the spatial extent of a flash here than the FED product did. (See above vs. below).

Now the question is, is the parallex better in the south-central U.S.?  And what if we look at higher resolution products like the group centroid density GLM product? While comparing the satellite GLM, with Day-Land-Cloud-Convection RGB, and with the ENTI/GLD/NLDN strikes (overlaid in pink) in SE Missouri…..it’s clear that a forecaster should not solely rely on GLM for core lightning locations (below). -shearluck

Area Discussion Prior to Severe Wx Kickoff

Area discussion for the Dakotas: Lower heights area located over western S Dakota and stacks from 700-500mb and will make its way easterly throughout the day. 850mb winds from the south at 30Kts.

METSAT shows low/mid clouds moving into ND from the west with clearing over the center of the states where wx is expected. Upstream surface observations support this clearing as they show dry air advecting into the area from the south.

Radar shows weak convective activity to the north moving into Canada. Models and the SREF are in agreement that the majority of thunderstorm development happen around 1-3z.

Merged TPW Composite total PW values over the center of the N/S Dakota states where convection is expected according to SPC outlook is less than 1” with values between .80-.95” and AllSkyLAP 900mb PW is even lower at .30”.

NUCAPS fcst Sfc CAPE overlay CAPE values range between 400-500/kg but there are quite a few gaps in coverage.

Meanwhile AllskyLAP CAPE shows 900-1500J/kg, and NAM models show extremely high CAPE values of 3000-4500J/kg.

Local TAFs show no thunderstorms or even rain while the SPC continues to carry SLGT over the Dakotas. It’ll be interesting to see how this scenario plays out as the day progresses.

–DESMOND–

ProbSevere

Overall impressed with the performance of Prob Severe today. Quick way to distinguish between weak/strong/severe storms. In this example from the high plains of Wyoming, there was an organized storm that Prob Hail spiked to 90% about an hour before the 1.5″ hail report, and remained at elevated to 75% at the time of the hail report. Don’t mind the low (3%) threshold for the ProbTor outline, as it is an easy way to keep that important piece of information quickly viewable by the warning forecaster.

— warmbias —

Mexican Severe Storm

A strong low level moisture gradient showed up on the Sfc- 0.9sigma AllSkyLAP image early in the afternoon south of the Big Bend region in Mexico. This could serve as an initiating boundary later in the afternoon.

Low Level AllSkyLAP and Low Level IR/WV top, mid level AllSkyLAP and IR/WV bottom

A look at the NUCAPS Forecast CAPE from the ~21Z pass showed over 3000 J/KG of CAPE at the 03Z Forecast hour. Earlier forecast hours (00-02Z) were missing data, however, if you interpolated between available data points, it seemed as though there was a maxima of CAPE in the area. It was noted that a storm developed around 21Z.

NUCAPS Forecast 03Z Forecast

To gain more detail, I clicked on a NUCAPS modified sounding east of the low level moisture gradient in the vicinity of the storm. It’s clear this is a very unstable sounding, capable of producing (at least) large hail. This clued me  in on how fast the storm could become severe. Certainly would not have had a special 19-20Z sounding in this area without NUCAPS and would have solely relied on model forecast soundings.

NUCAPS sounding from Mexico ahead of low level moisture gradient at 20Z

Even though it is far away from the KCRP radar, prob severe quickly showed the developing storm ramp up and have very high severe hail (and wind) probabilities (roughly within 15 minutes of initiation). If the NUCAPS forecast is right, this storm would likely continue into the evening given the abundant instability.

Prob Severe from KCRP looking in Mexico

-Tempest Sooner

Reiterating the use of GLM over open water

A great example of GLM usability is over the Gulf of Mexico (or any open bodies of water) where radar coverage and ENTI lightning sources diminish. Here’s an example of how a system moves eastward over the Gulf: radar disappears, but GLM (and some NLDN/ENTI) lightning data still lets you know where the strongest storm updrafts are located. Not only that, but the spatial extent of lightning is better known now that you have GLM alone. Below is displaying radar and satellite with FED GLM data, and NLDN/ENTI lightning detection. ProbSevere also becomes less relevant. The separate updrafts are easily distinguishable toward the end of the animation using FED.

Next animation is the same, but with FED on top of radar making it easier to see its evolution and usability:


Now with the same scenario, comparing the Minimum Flash Area (MFA) GLM product with the Average Flash Area (AFA) GLM product, it is MUCH easier to differentiate new convection with the MFA product. Notice all of the yellow spots in NM and Mexico that make it easily detectable with the human eye as you watch your SA monitor. This may be a product of color scale for the AFA, but this tells me that the MFA would be more useful in convective initiation. I have not gotten much value out of the AFA  as I would with just simply using the FED (Flash Extend Density GLM product) or TOE (Total Optical Energy). -shearluck

TOP IMAGE: MFA       ;     BOTTOM IMAGE: AFA

GLM Weak Convection

On a day with weak convection, it was interesting to watch the Minimum Flash Area and how it related to storm structure. As expected closer to the updraft, smaller flashes were noted, but there is clearly a larger flash that extends out into the anvil area. This is quite the distance from the core of the storms, and thus would have impacts on DSS based services and potential lightning strikes to outdoor events.

Reflectivity, Minimum Flash Area, Average Flash Area, TOE clockwise from top left.

Day 2 Blog According to Orca

Conditions across MO today are relatively quiet for this time of day.  LAP stability indices are getting elevated (CAPE 2100, TT mid-50s, LIs -6 ish, K 32-35) but the bulls-eye for that  is remaining in eastern KS.   H7-H5 LR remain 6-7 thru midnight, after which will be  appchng 8 thru mid-morn across west central MO.  This is a result of genesis of a shallow SFC Low in West Central MO in early morning hours that drifts across MO thru EOP.   So still forecasting early evening, ISOLD TS across the  MO during that time as TT, LI and CAPE indices are elevated then as well.  VWP indicating weak LL shear at this time.  All thing considered, severe threat is low thru EOP. 

Separating threats in D2D with ProbSevere2

It’s nice to break out ProbHail, ProbWind, and ProbTor as separate displays (right hand column below) – something that is not even possible with the ProbSevere v2 placefiles.

ProbHail was the greatest threat (far upper left panels), topping out around 33%, and culminating in a quarter size hail report (below, upper right). It’s been pointed out that ProbSevere has been much harder to calibrate out west where there are fewer reports and thermodynamics are different. So, it’s really all about trends instead of quantities.

#MarfaFront

ProbTor reliable? Lightning says no, MRMS says maybe.

There is difficulty with having confidence of the ProbTor portion of the ProbSevere product due to an instance where it is estimating higher tor rates (8%) when a storm has no identified lightning (GLM, NLDN, and ENTI) along the coast of Florida. To be fair, the storm previously did indicate some lightning with it. I investigated the TOE, FED, and Min Flash Area in the vicinity of this storm, as well as usual point lightning data in 5 and 1 min updating intervals, and it has me confused as to what the ProbSevere is “seeing” for its lightning data (it is indicating ENTI lightning within its circle). Below is the image example of ProbSevere loaded alongside lightning data including GLM’s Min Flash Area:


I also pulled up the lowest level rotation tracks from MRMS data, and it did indicate a slightly higher maximum within the ProbTor circle, so I believe the ProbTor is locking on to that feature.   – shearluck