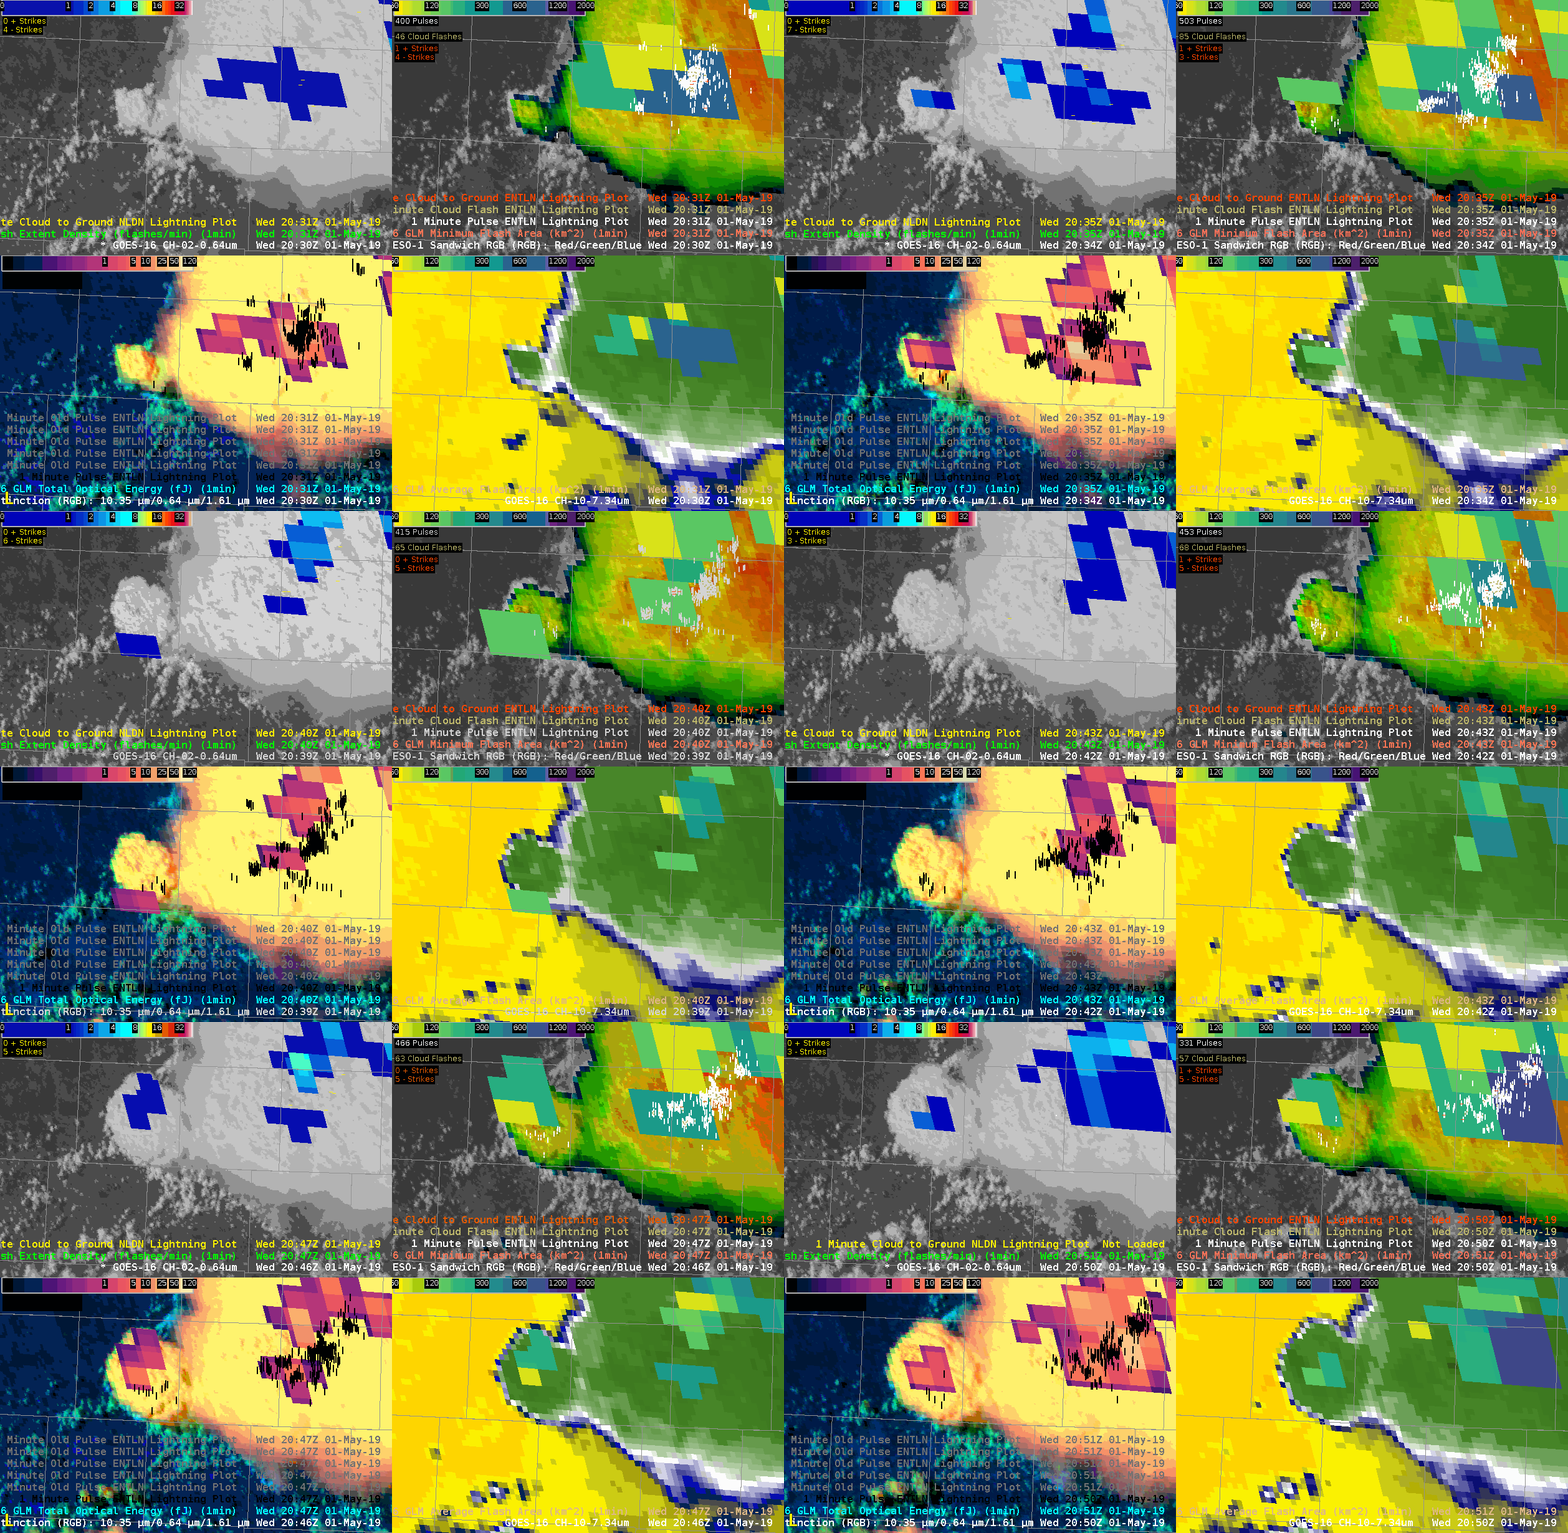
GOES GLM products offset

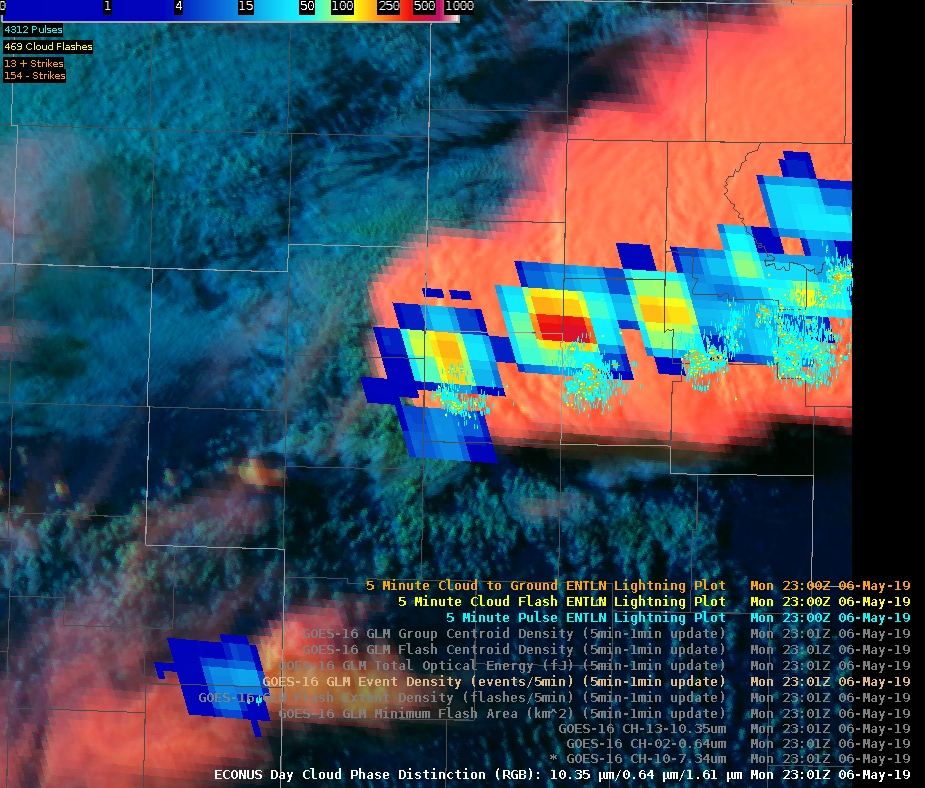
Always important to keep in mind that the locations on all GOES Products are offset based on the tilt of both GOES satellites relative to the CONUS. Good Example of the offset of GLM with ENTLN lightning data displacement shown here.

Would something like this be problematic when calculated into the ProbSevere model?

#ProtectAndDissipate

All-Sky LAP PW vs. Merged TPW

There has been considerable examination of the All-Sky LAP products (PW and CAPE) this week, and for good reason – they’re quite good. I wanted to take a quick look at how the All-Sky LAP total PW compared with the merged TPW product. The All-Sky product is on the left and TPW on the right. I overlaid the 20z 1 hour RAP PW forecast for comparison. Ignoring the higher resolution of the All-Sky, the very broad distribution of enhanced and depressed values are similar in location between the two products. However, the TPW values are considerably lower than both the All-Sky and the RAP forecast. Further, pulling the 21z SPC mesoanalysis PW shows that the All-Sky tends to be the better of the two satellite products.

The TPW seems good for very broad generalizations, but if given a choice between the two in operations, I’ll take the All-Sky, All-Day Every-Day.


–Stanley Cupp

GLM, Satellite, and Convection Initiation

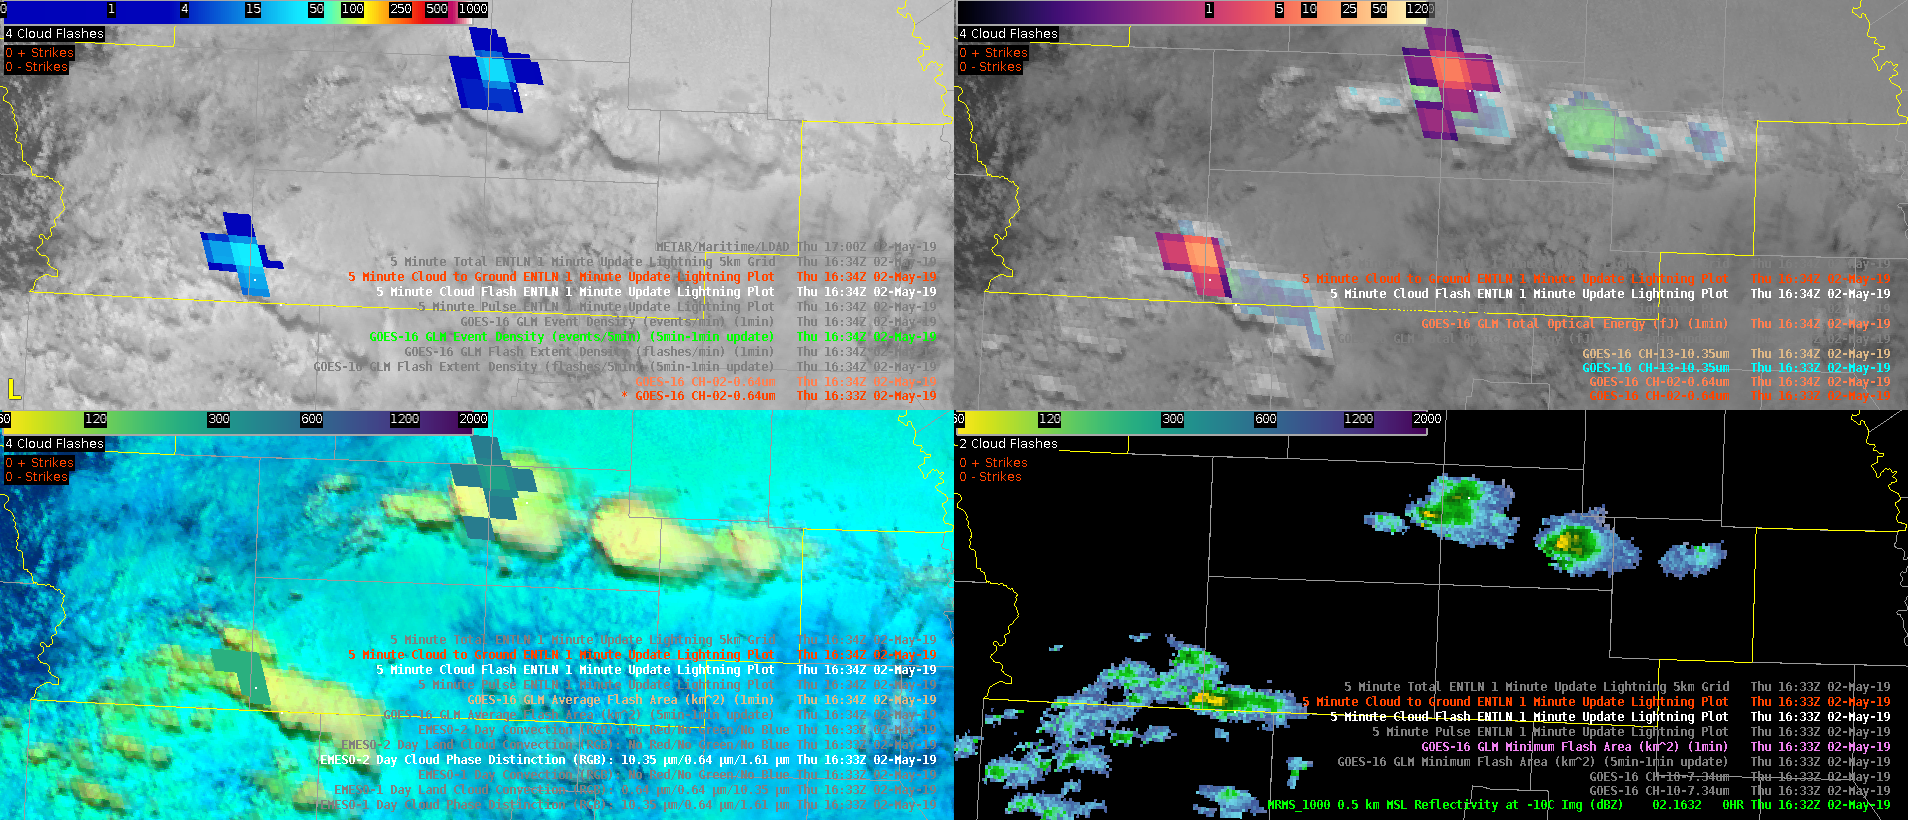
For the first time this week, finally got a chance to examine CI using GLM data. I built a 4 panel that worked well for me (ENTLN CG and cloud flashes on each panel):

top L: 1 minute visible with flash extent density (FED) and event density (ED)

top R: 1 minute Vis/IR sandwich with 1 minute total optical energy (TOE)

bottom L: 1 minute Day Cloud Phase Distinction/Day Convection RGBs with average flash area (AFA)

bottom R: MRMS -10C reflectivity with minimum flash area (MFA)
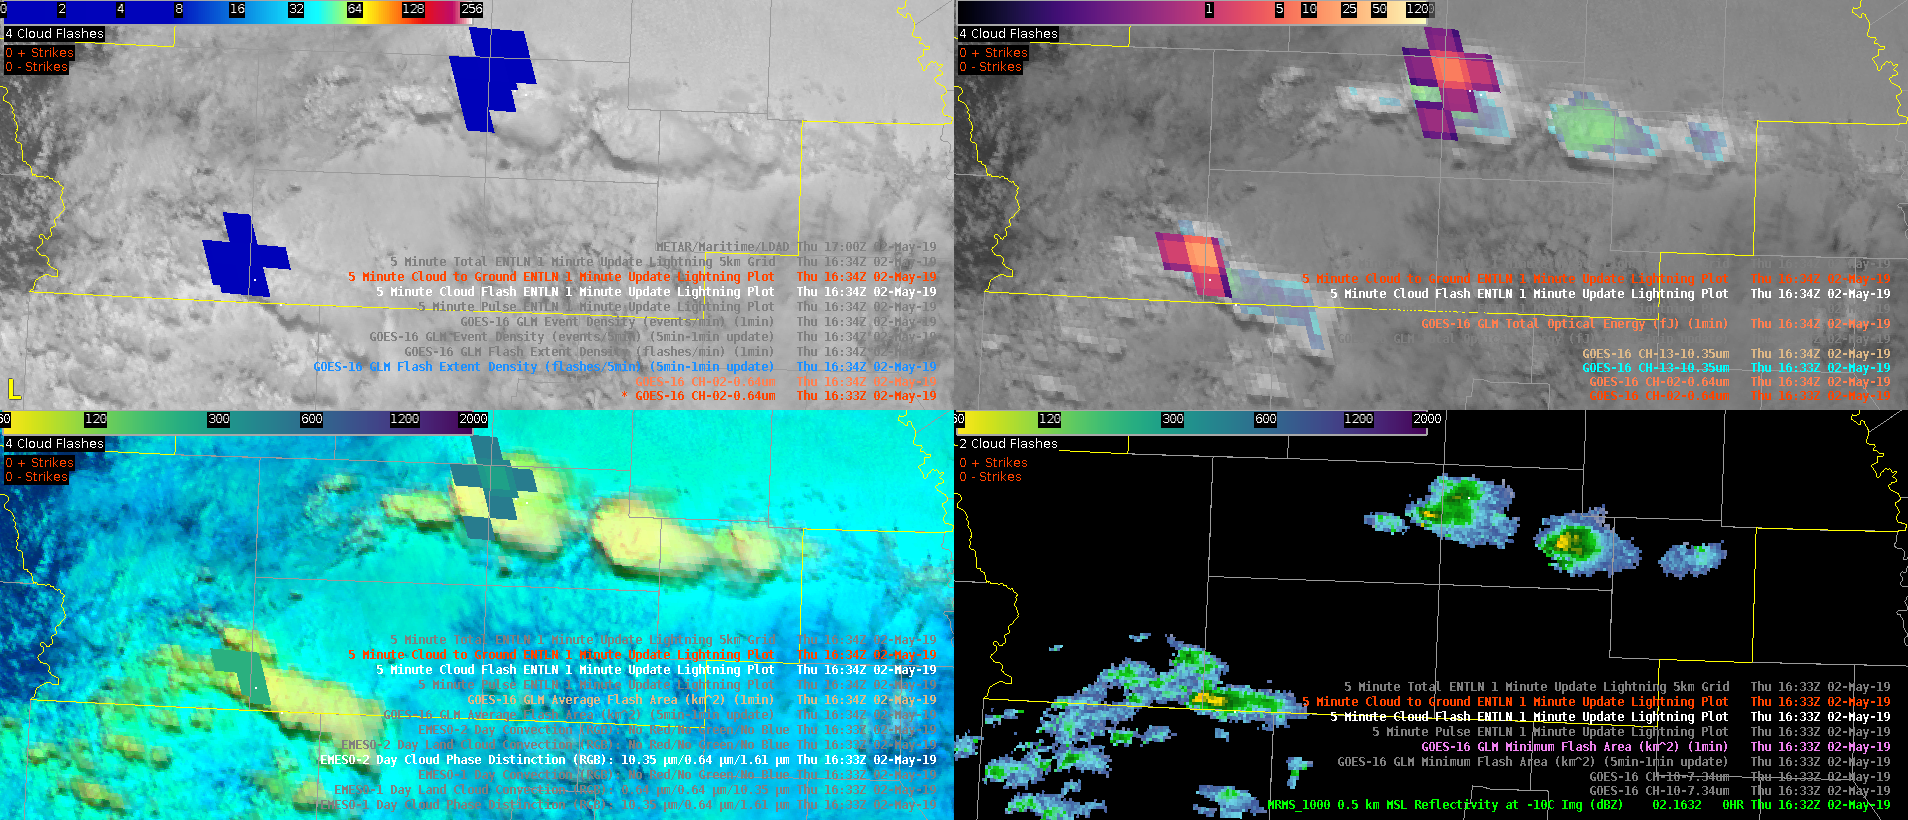
Agitated cu developed just prior to this image at 1634z. These two images highlight the differences between FED (upper L of the top image) and ED (upper L of the bottom image). You’ll notice that the flash extent density is much more muted than the event density. You can really hone in on the strongest initial convective cores with the ED and TOE compared to the FED.
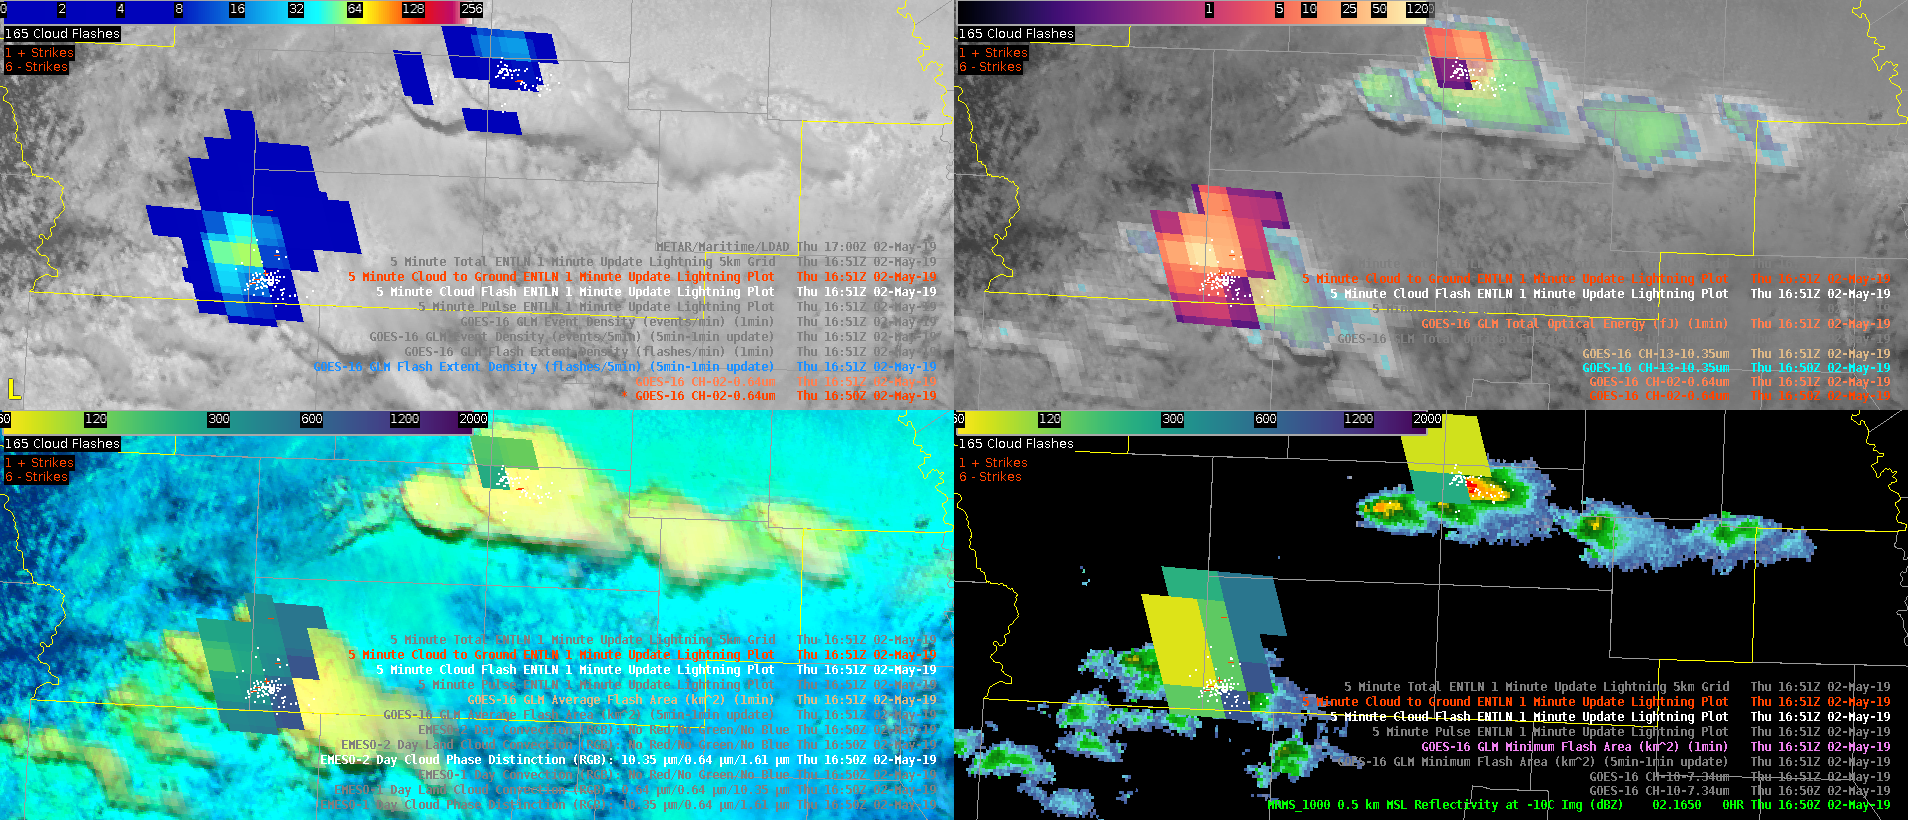
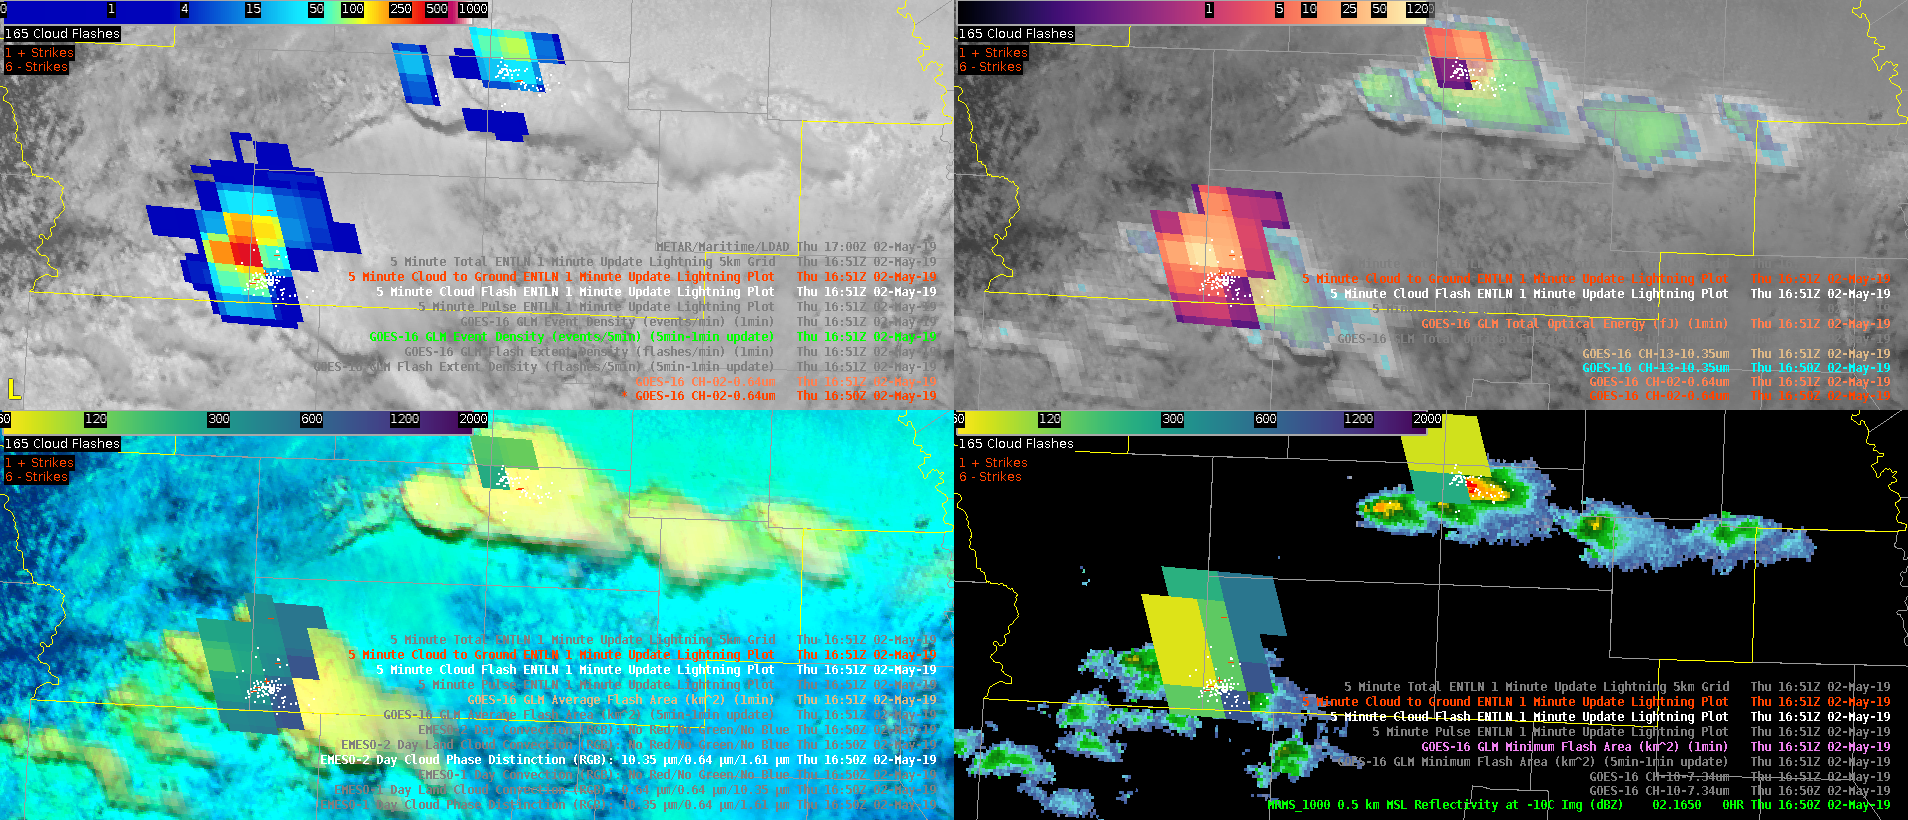
Next two images are at 1651z with FED highlighted in the top image and ED in the bottom. Again, your eye is immediately drawn to the event density vs. the flash extent density. Also, your total optical energy corroborates with high values on the southern cell (at least with respect to electrical activity…radar showed both cores with similar 50 dBZ heights).
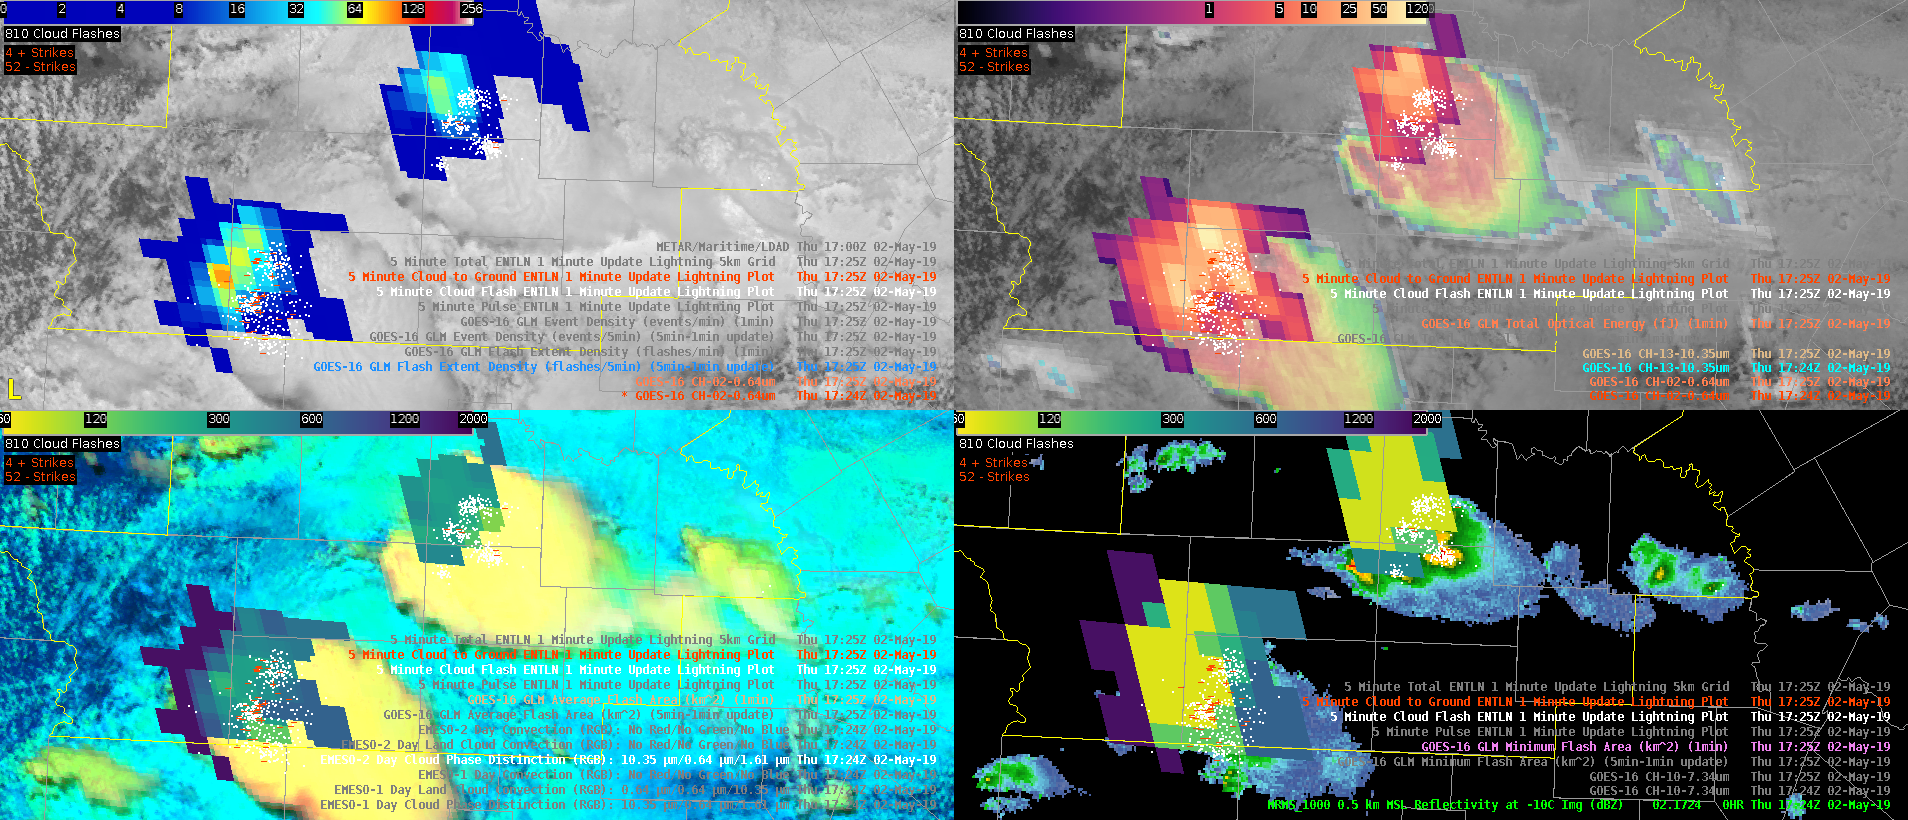
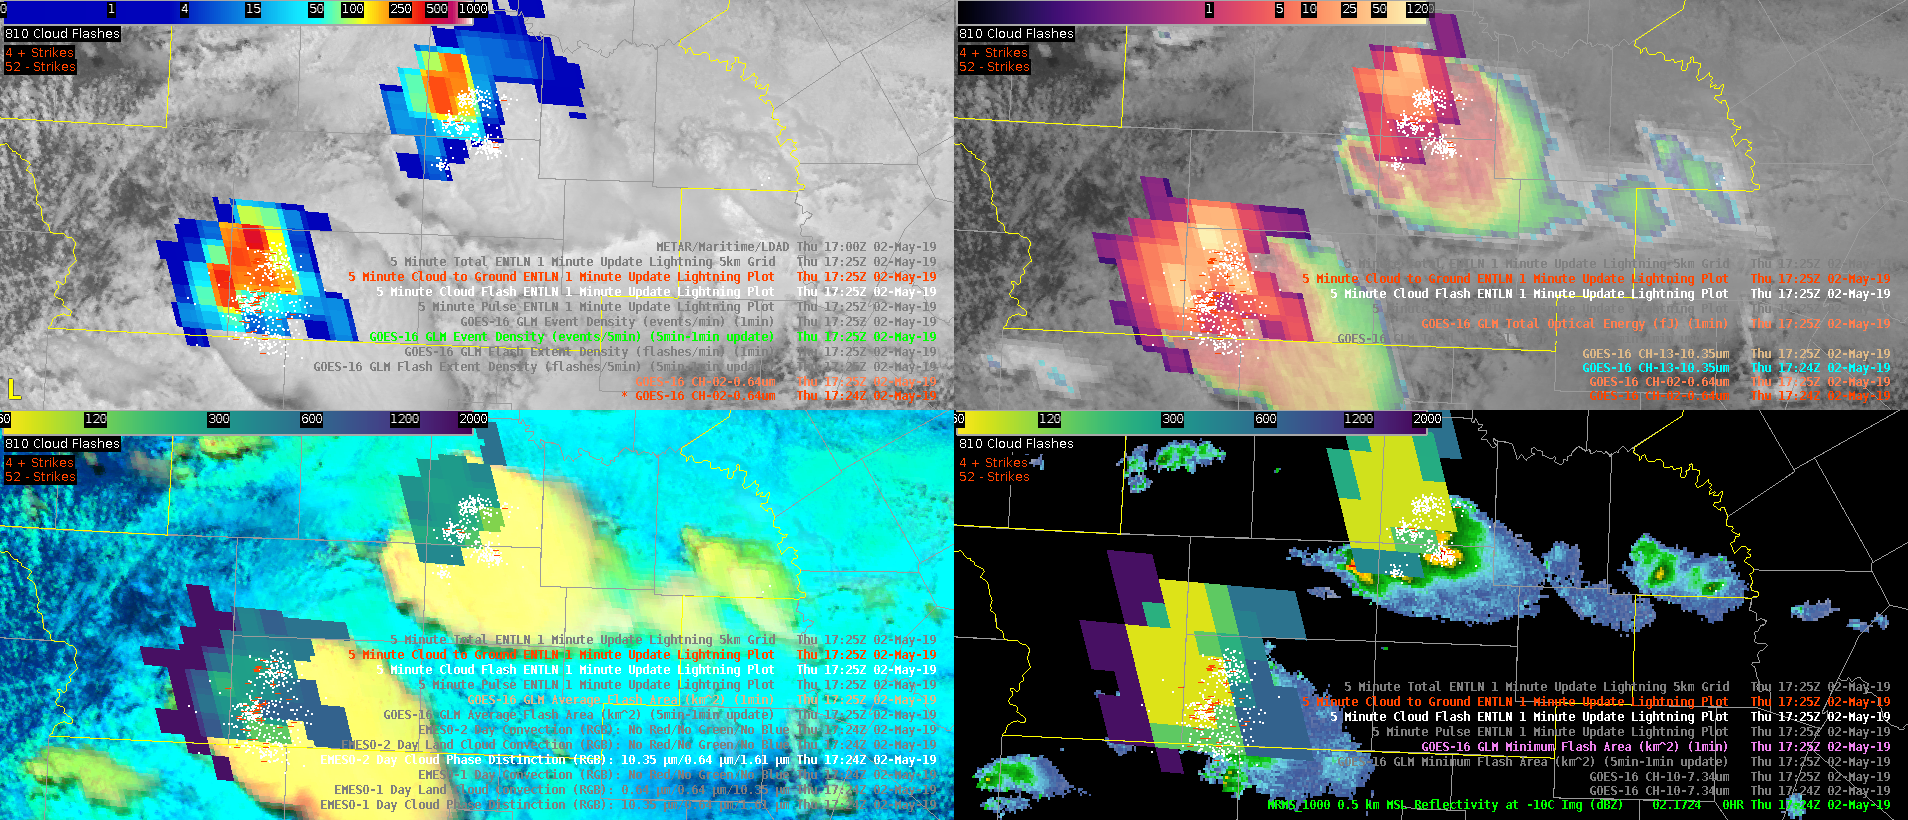
By 1725z, both event density and total optical energy are beginning to overwhelm and lose granularity. At this point, flash extent density highlights the more active cores. ED and TOE are both still useful, but the distinct advantages they showed earlier in convective evolution have degraded as convection has matured.
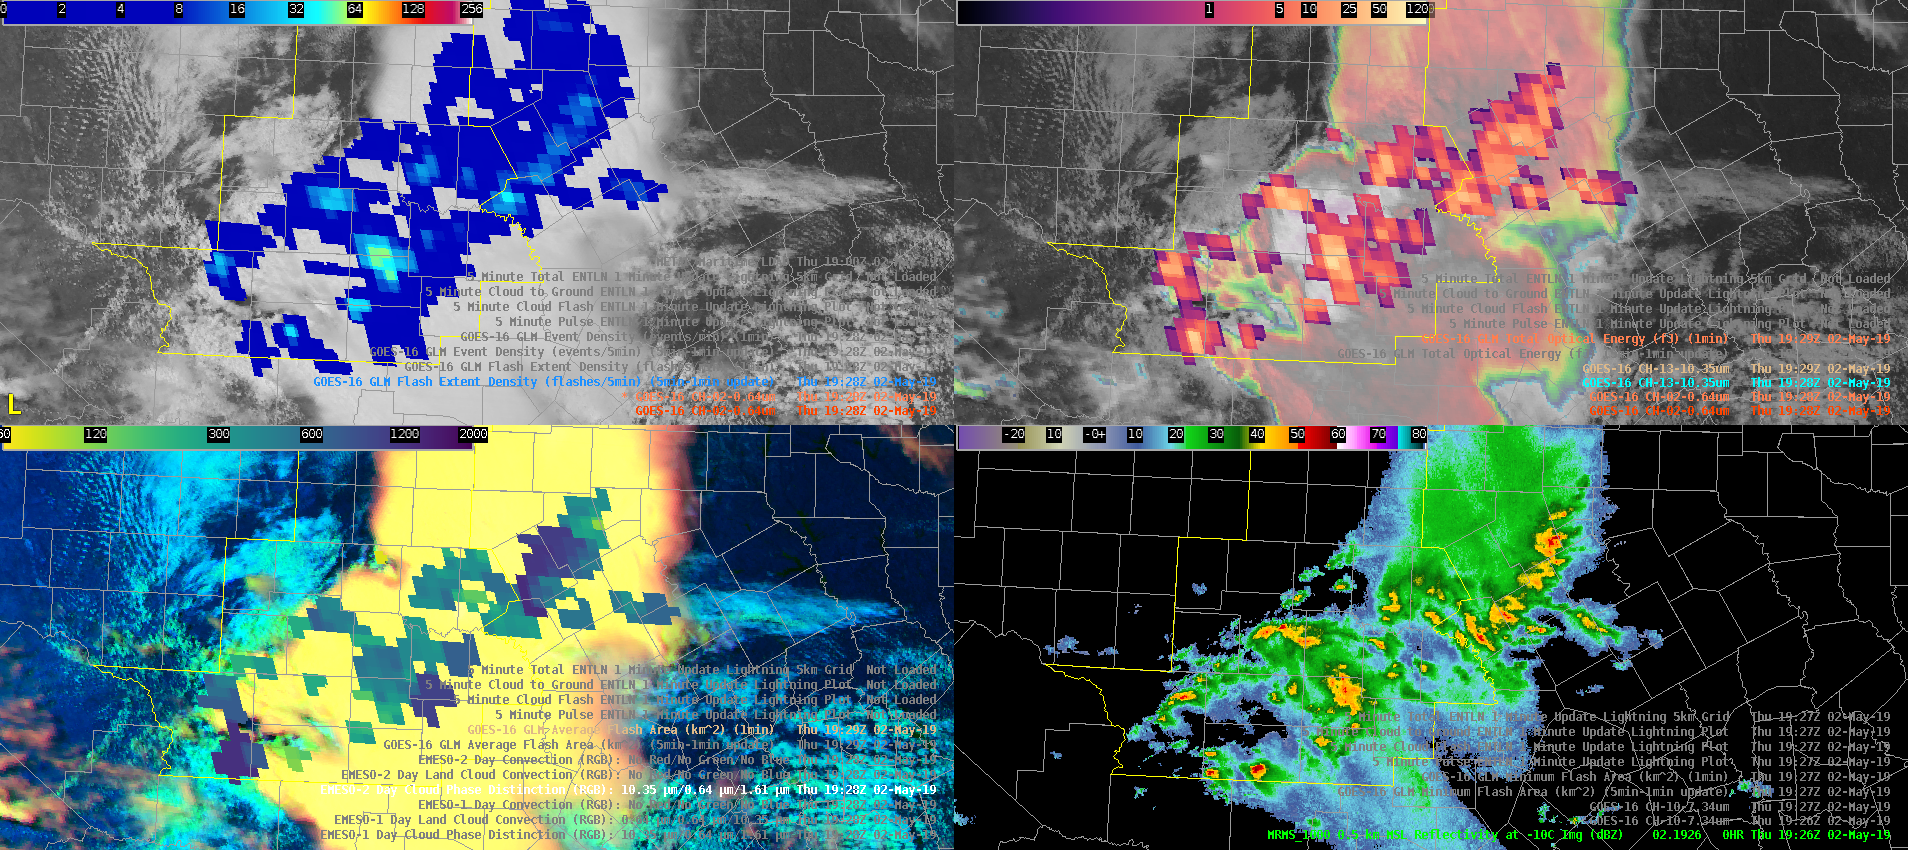
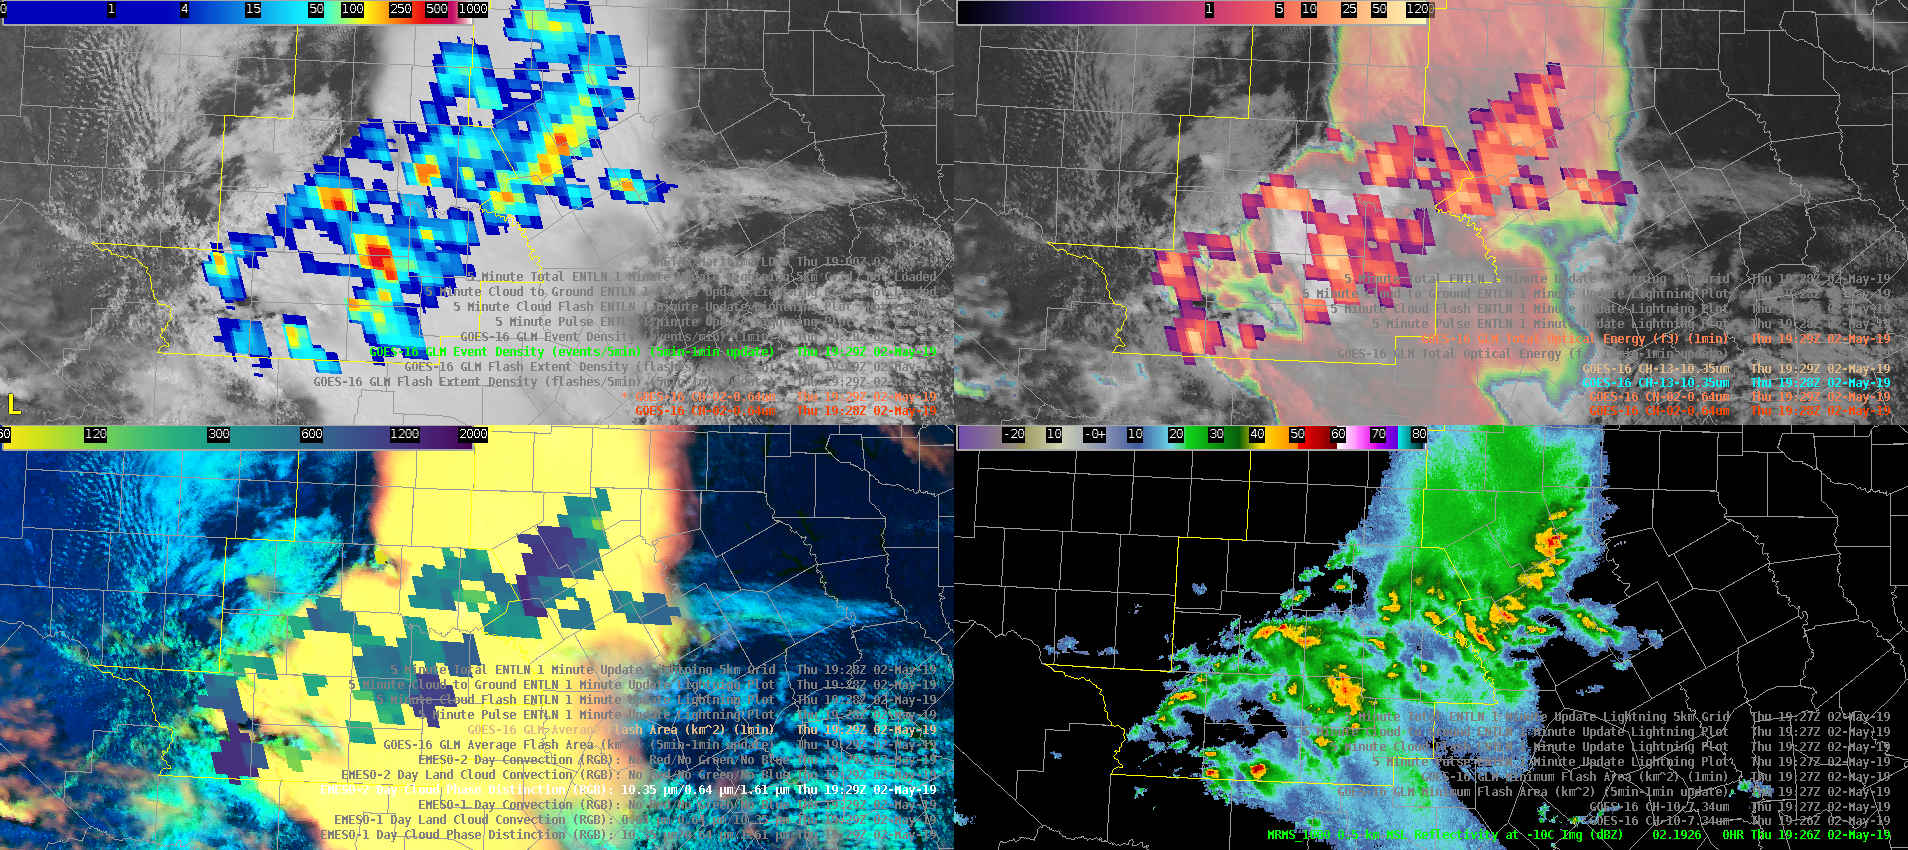
by 1929z, it’s fairly obvious that the advantage TOE had in highlighting distinct cores early is no longer. While you can see smaller areas of enhanced optical energy, it is far noisier. We’ve noticed this throughout the week that TOE’s usefulness seems to wane as convection matures and storms are extremely electrically active. Flash extent density seems to be a better choice at this point compared to event density, as was the case at 1725z.

A few of the biggest takeaways…Total optical energy (1 minute) serves a very useful purpose for CI as it can highlight areas of new updraft growth, but loses impact as storms become mature and lightning becomes well established across the area. Event density would seem to be a better choice for CI compared to flash extent density as well.

The four panel that I built I’ve found very useful for CI or subsequent new updraft development by combining the best of visible imagery, RGBs (are utilized to diagnose glaciation within clouds), and the MRMS -10C reflectivity. Time for more coffee.


–Stanley Cupp
ProbSevere – Transition from hail to wind threat

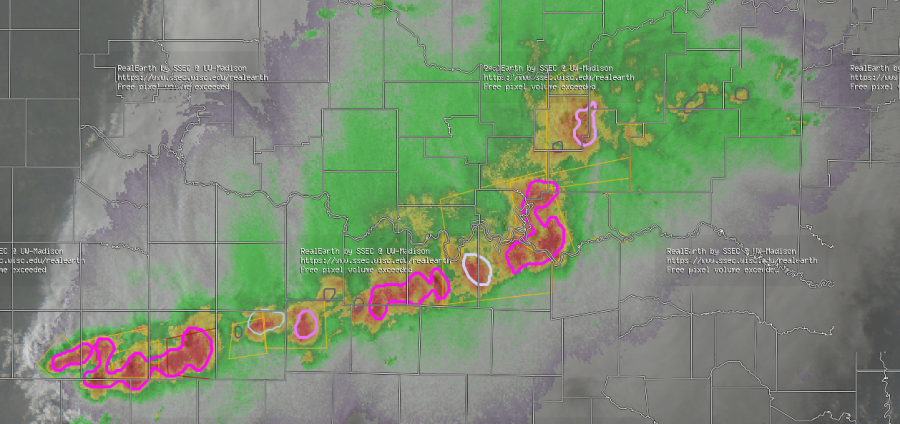
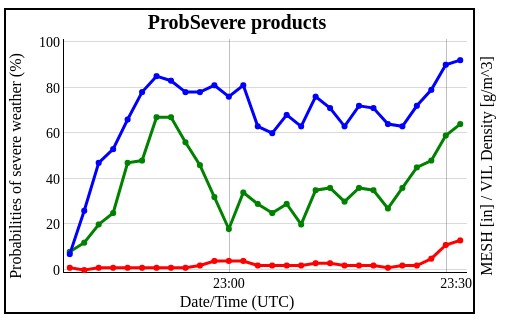
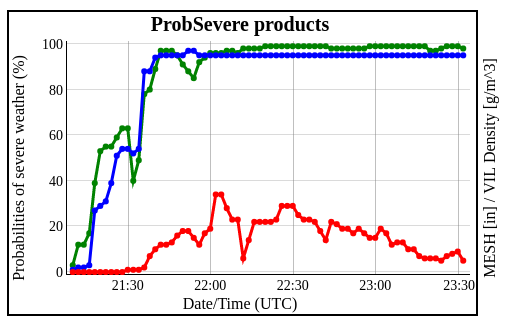
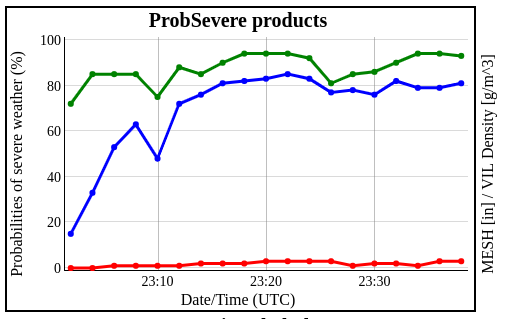
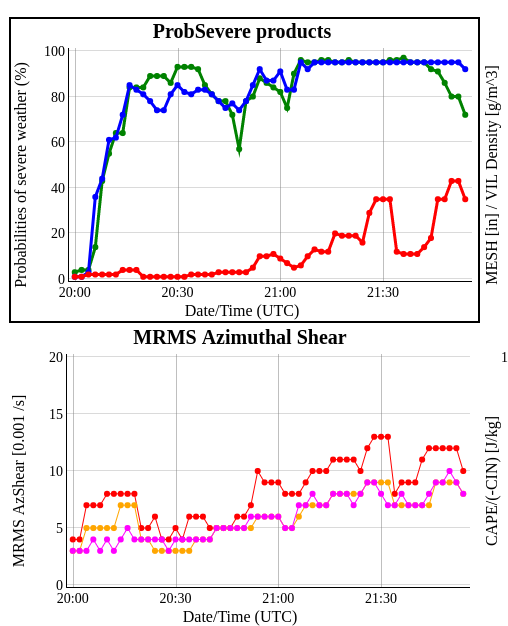
ProbSevere seemed to have a pretty good handle on the dominant severe threat  as initially discrete storms early in the day,  began to congeal and grow upscale into the early evening north of the Red River. This can be shown in same sample graphics below.     The first two trend graphics are from storm objects over the northern, maturing portion of the MCS, generally north of the Red River where mainly wind damage reports were observed (and some small hail).  The second two trend graphics are from somewhat newer storms that were developing southwestward into northern Texas where primarily hail (and wind) were observed.  – Quik Twip

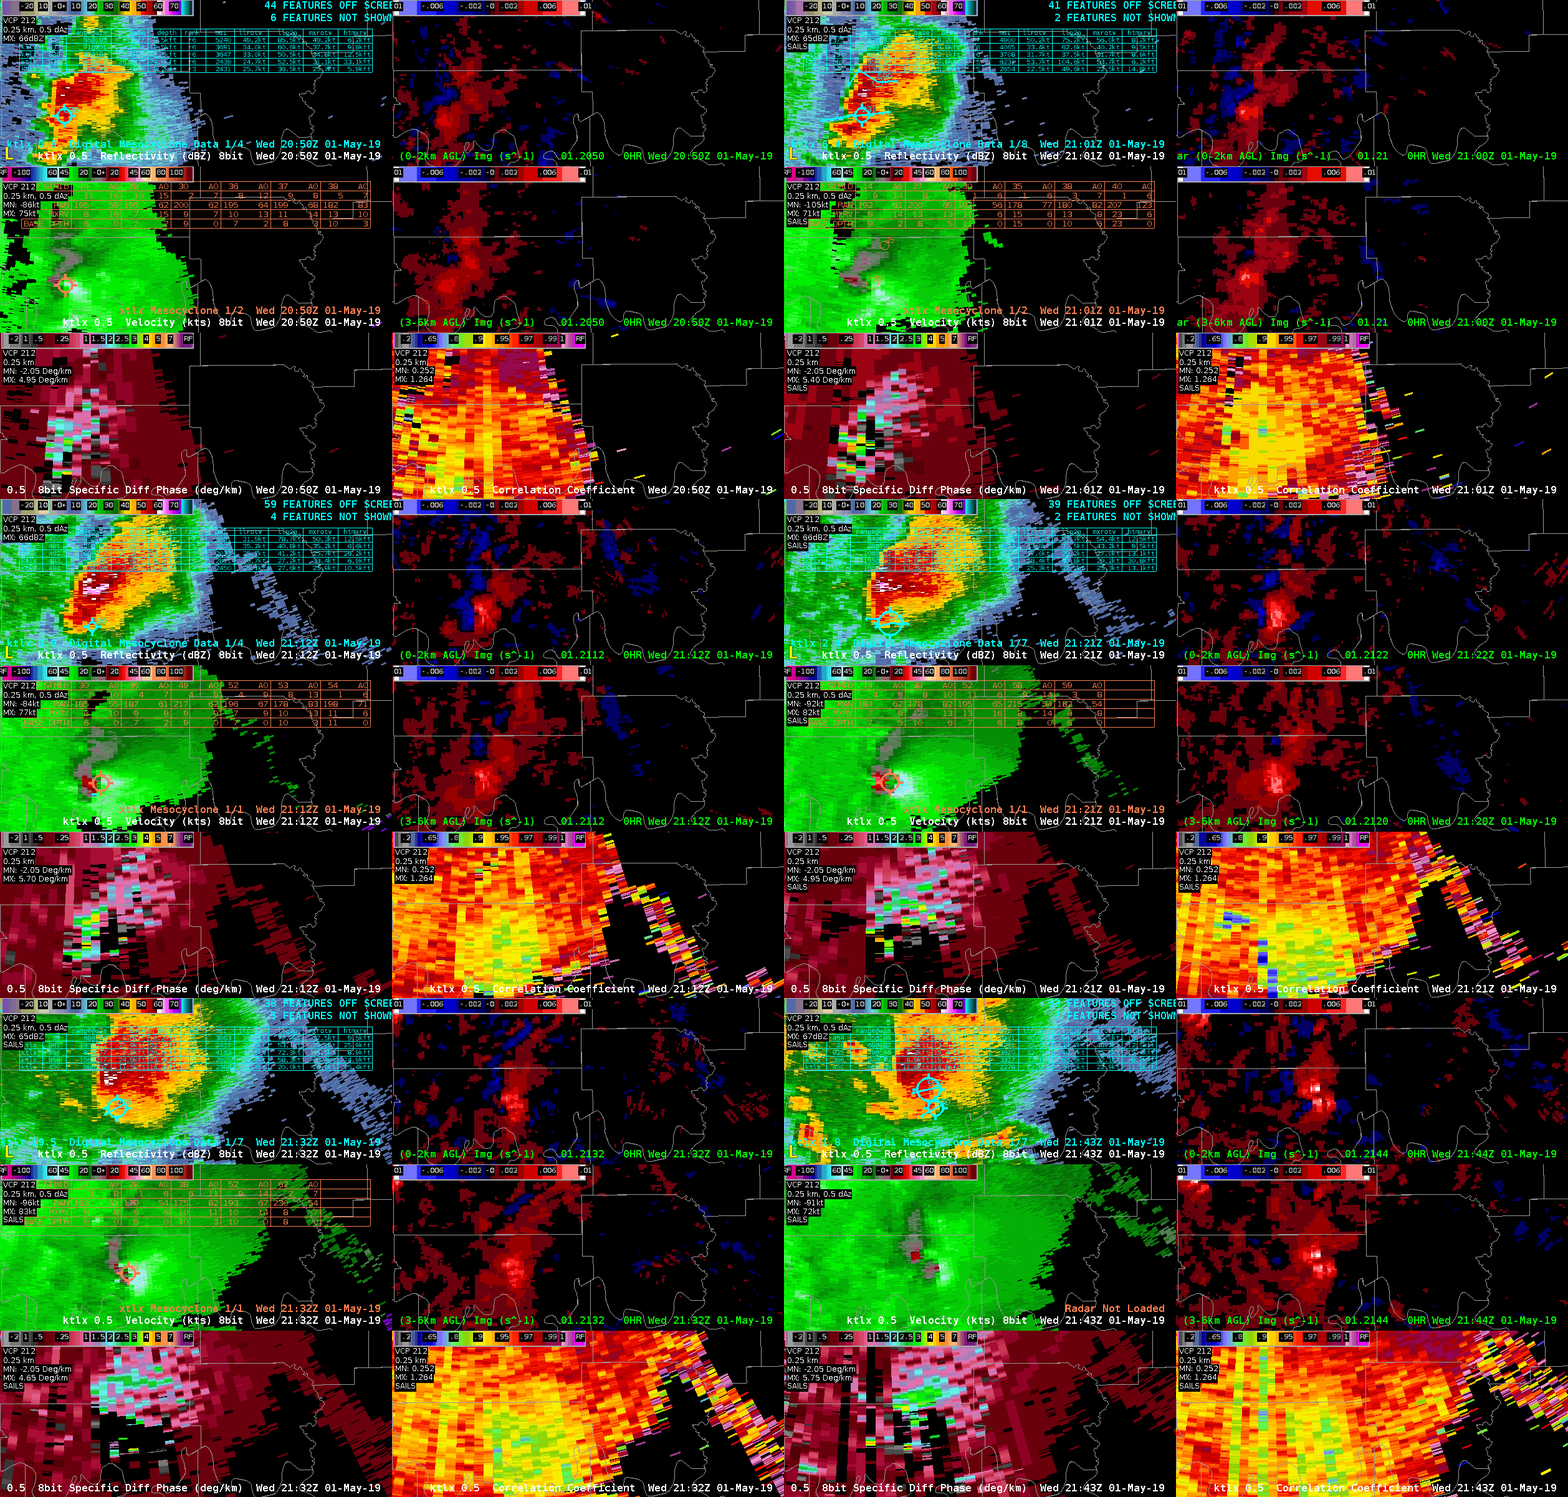
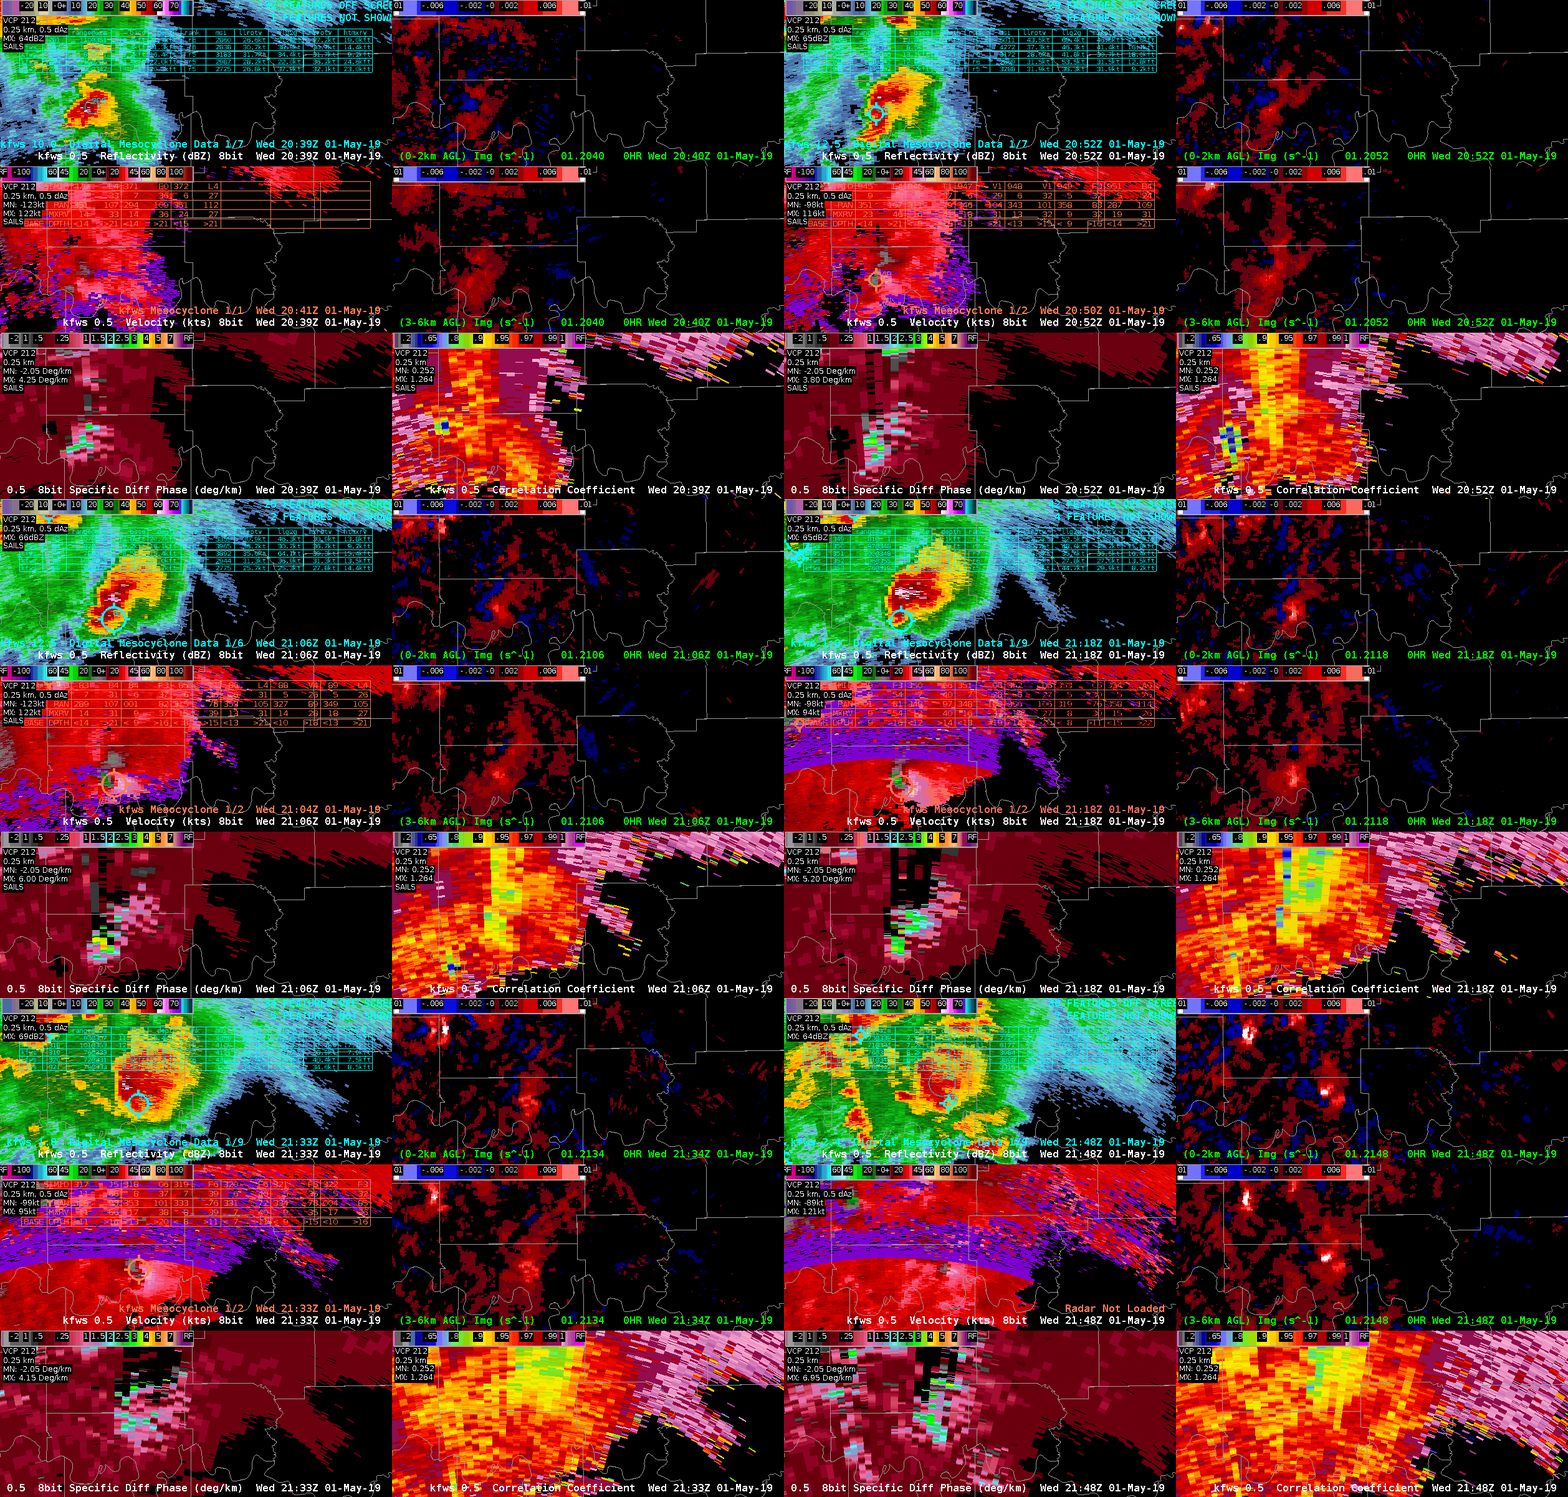
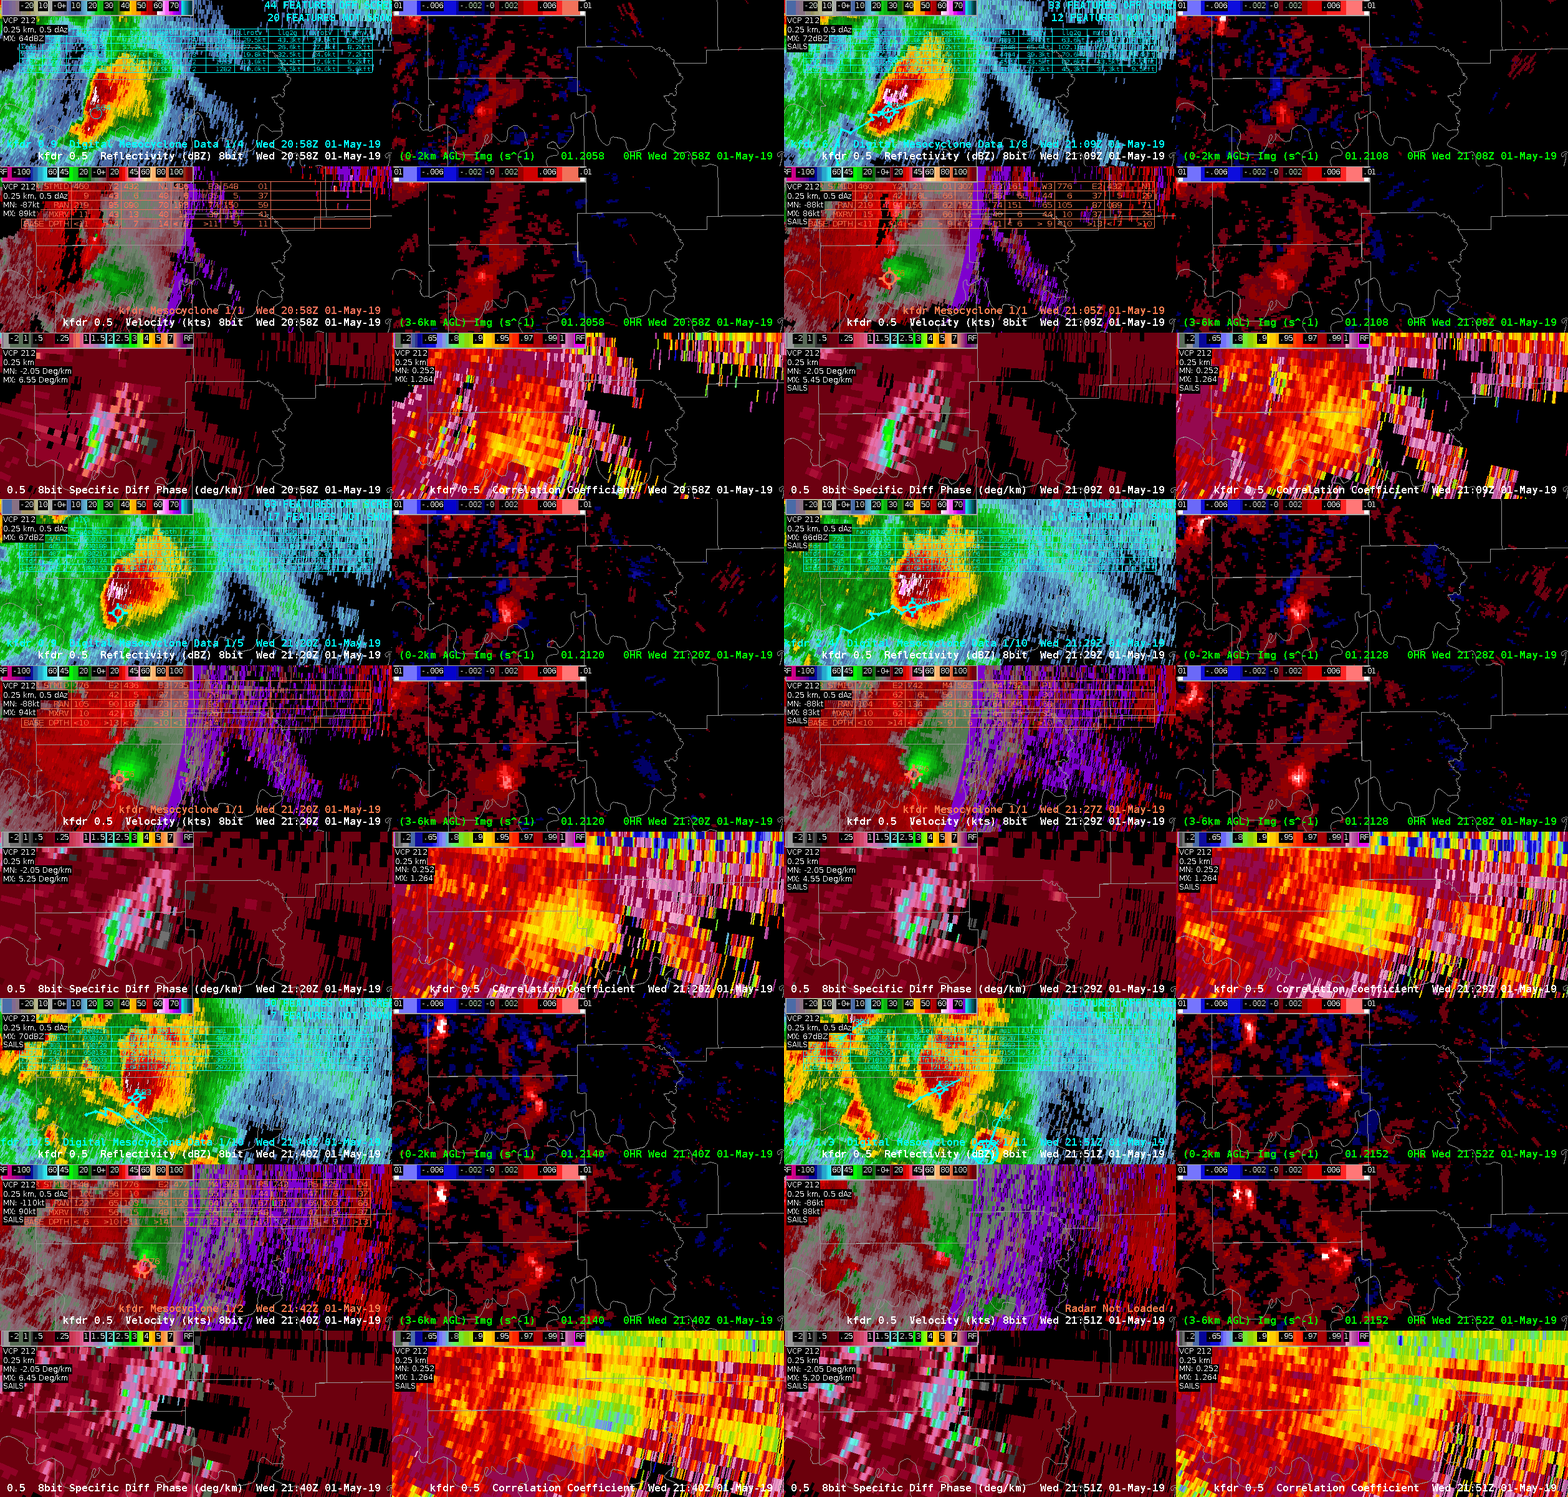
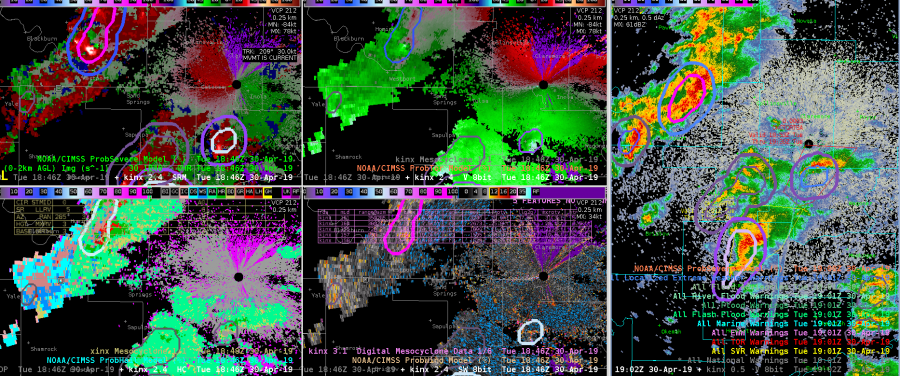
Multi-radar comparison of Tornadic Storm near Red River

KTLX, KFWS and KFDR perspectives of tornadic supercell near the Red River.  Spotters indicated occasional brief touchdowns with this storm.  Animation is from 2050 to 2143 UTC around the time of the reported brief touchdowns.  Last image is the time trend of ProbTor  (red trace) and MRMS AzShshear (red trace).  KFDR seemed to sample the mesocyclone the best and subsequent gate-gate-shear (90 nm from RDA).  ProbTor indicated a gradual increase then took a sudden drop shortly after 2130 UTC, then continued to increase.  This may have been the result of a similar drop in the MRMS AzSHear.  Not clear why AzShear dropped off briefly (perhaps a sampling issue with one of the radars). However, radar SRM data did not show any indication of weakening circulation in any of the, in fact the velocity couplet was even stronger around 2130 UTC especially KFDR radar.  A caution to forecasters to be careful when examining trends in the ProbTor and be sure to examine the various inputs into ProbTor in conjunction with the radar (velocity trends). – Quik Twip

Initial lightning detection in new storm UD

Comparison of 1 min update GLM .vs. ground-based detection for new updraft tower.

Upper-Left is FED, Upper-Right is 1 min pulse ENTLN and Minimum Flash area, Lower-Left is 1min pulse ENTLN and TOE;  and Lower-Right Average Flash area.  First detected “pulse” is evident about 5 minutes prior to first GLM detections.  Note that the initial pulses in a new updraft may not be associated with a “flash”.    Also note the parallax error in the satellite-based detection.  – Quik Twip

Advantage of AZ Shear

Favorite part of the Azimuthal shear product so far is it can highlight some areas of the storm that need to be investigating…if you are watching a different storm and want to do a quick look at your CWA this can grab you attention to a storm that needs to be looked at next.

South Beach