An official website of the United States government
Here’s how you know
Official websites use .gov A
.gov website belongs to an official government
organization in the United States.
Secure .gov websites use HTTPS A
lock (
) or https:// means you’ve safely connected to
the .gov website. Share sensitive information only on official,
secure websites.
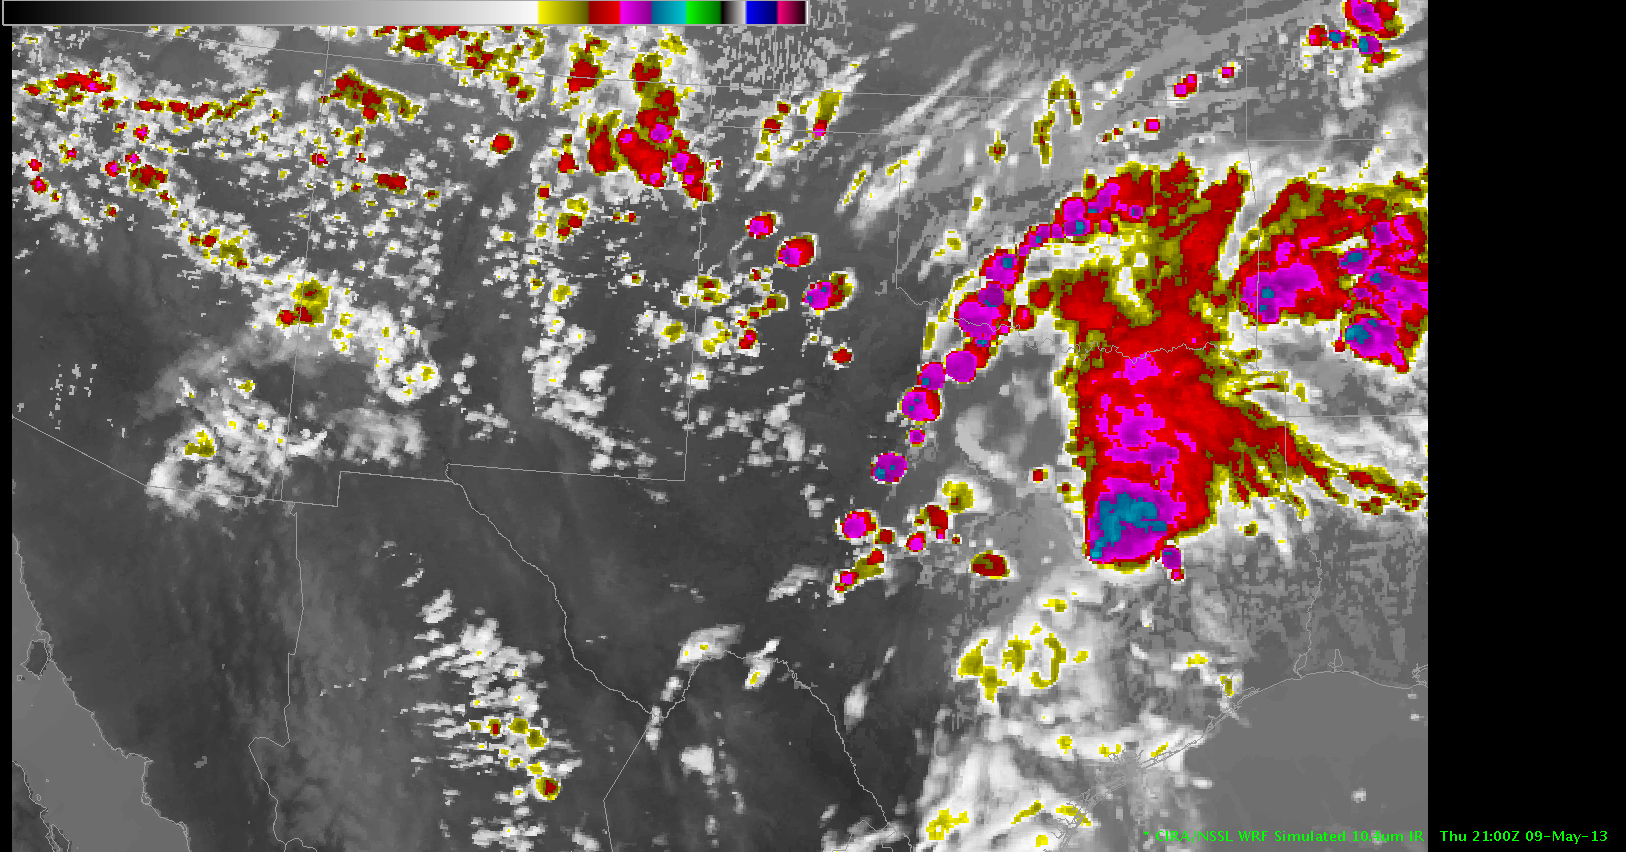
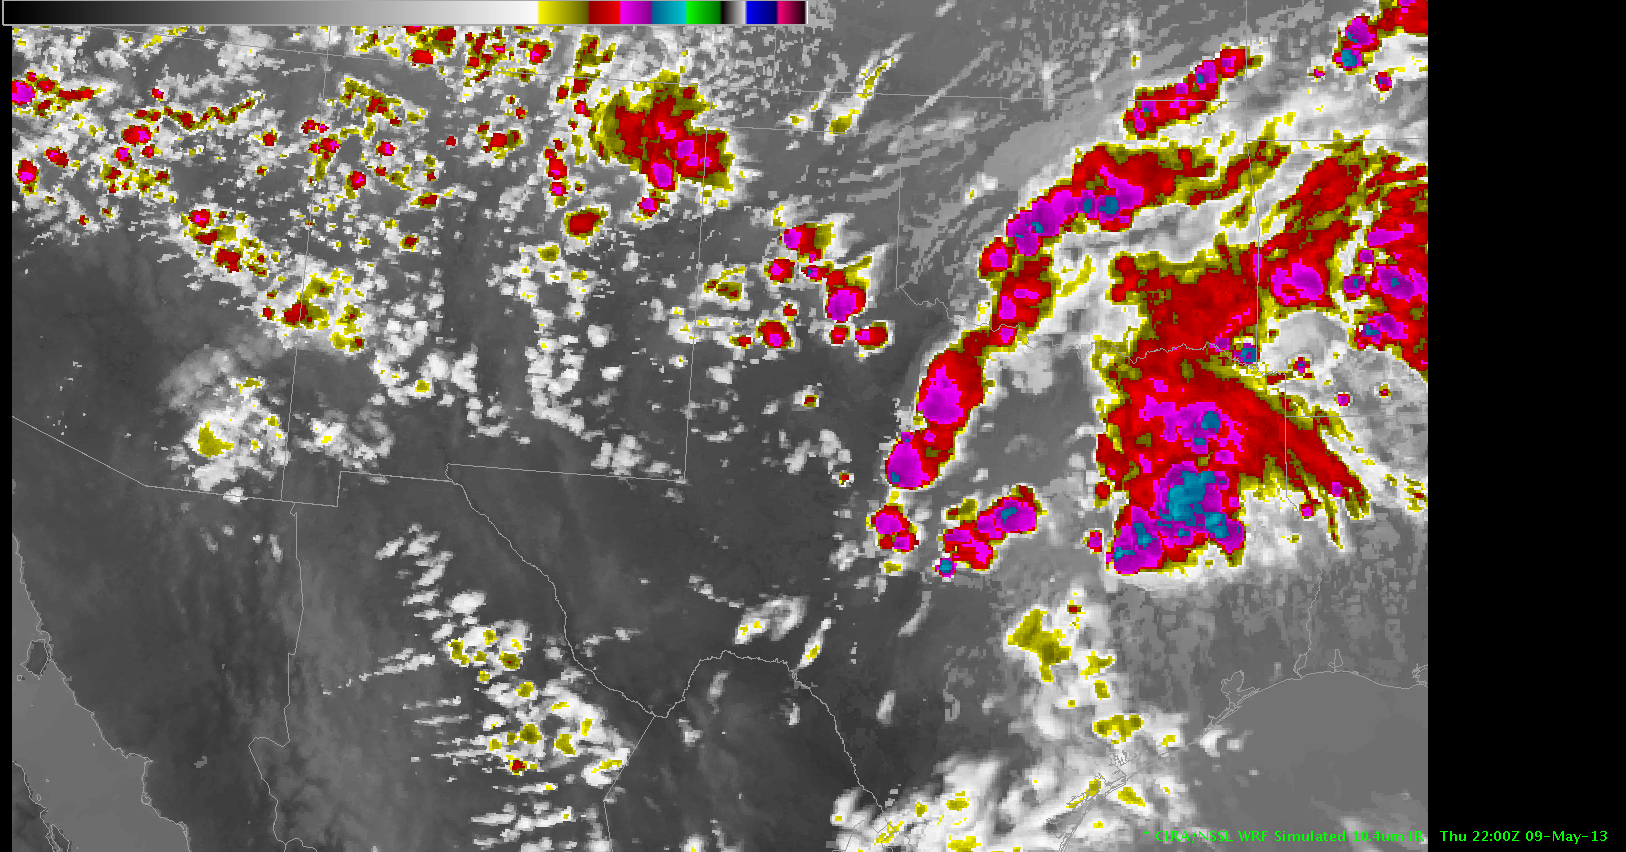
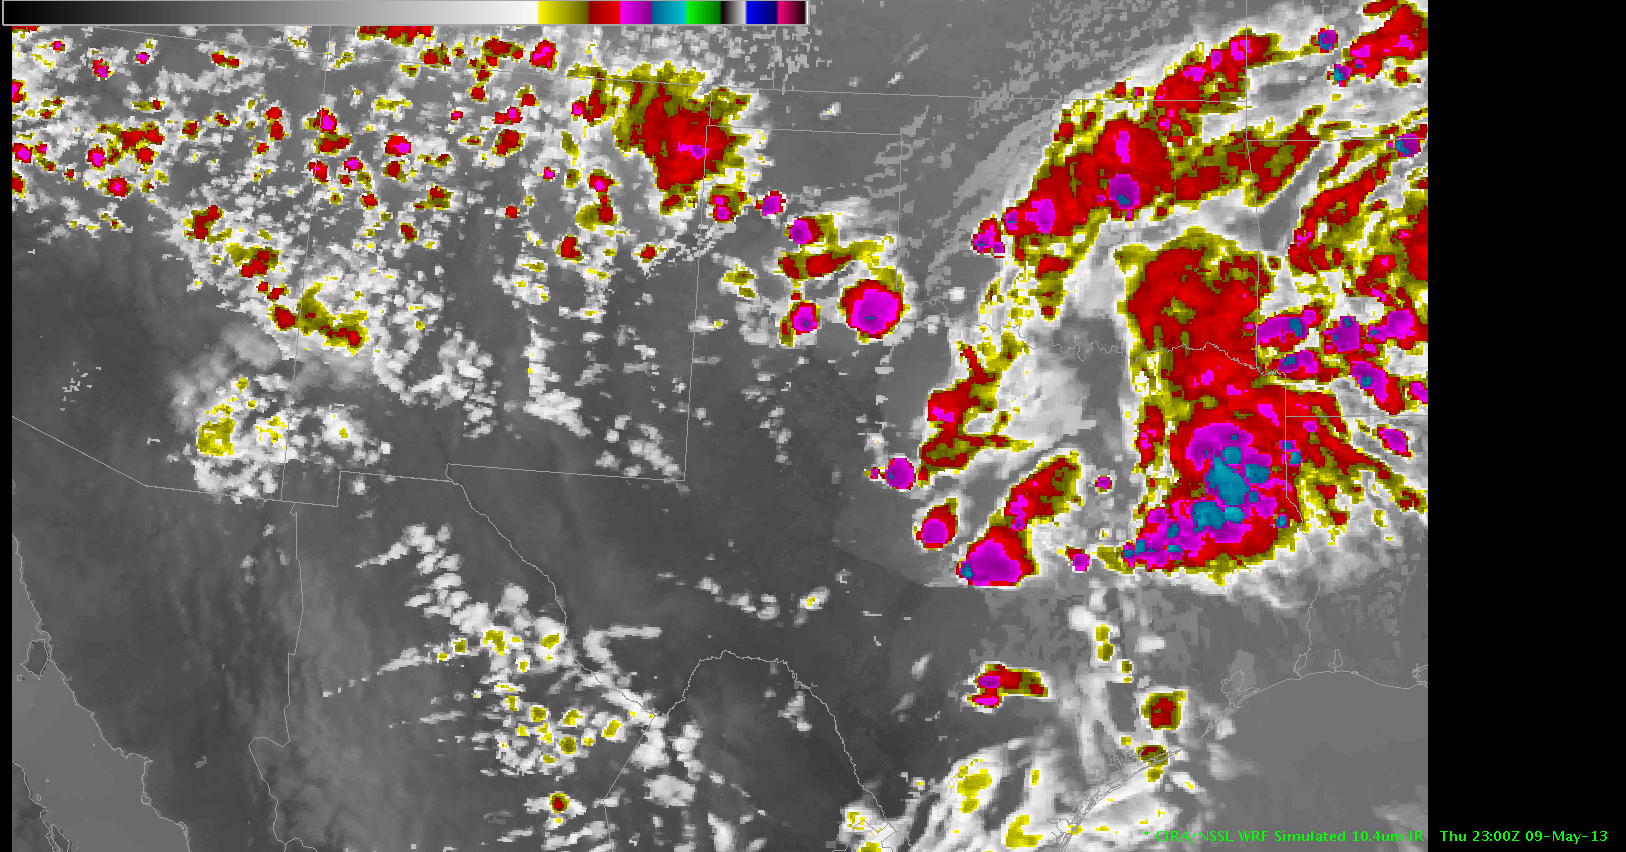
NSSL WRF simulated satellite imagery accurately depicted convection erupting across West Texas as an outflow boundary from a previous MCS across north-central Texas interacted with the dryline. The three following images show a westward propagating outflow boundary interacting with isolated cells along the dryline across portions of West Texas.
NSSL WRF simulated satellite imagery from 21Z.Simulated satellite imagery at 22Z.Simulated satellite imagery at 23Z.
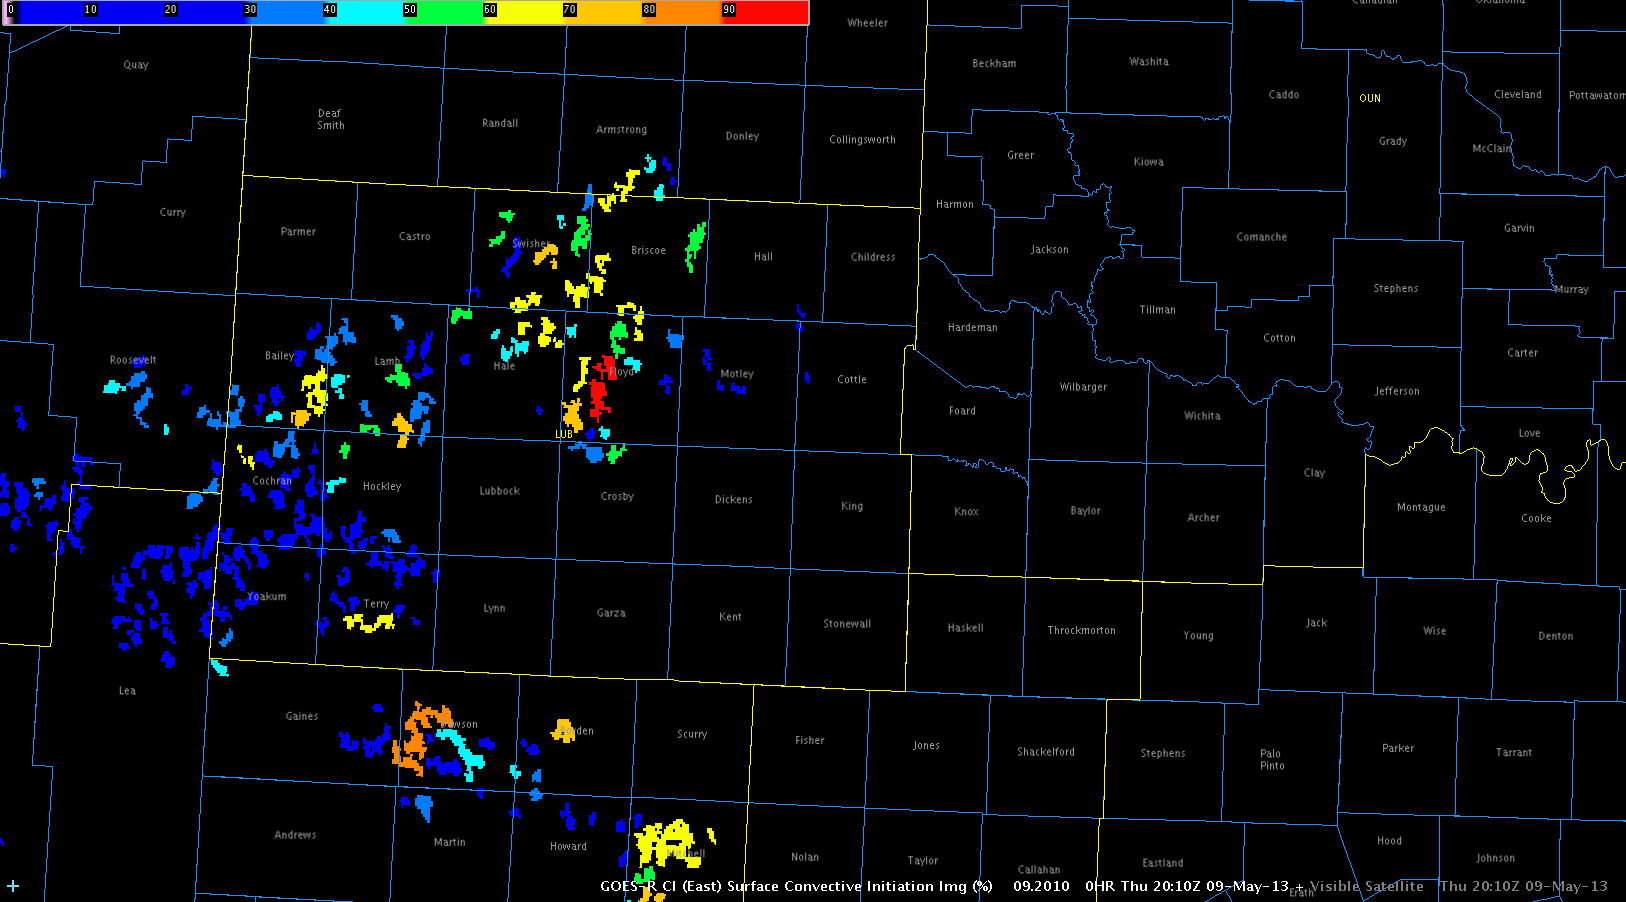
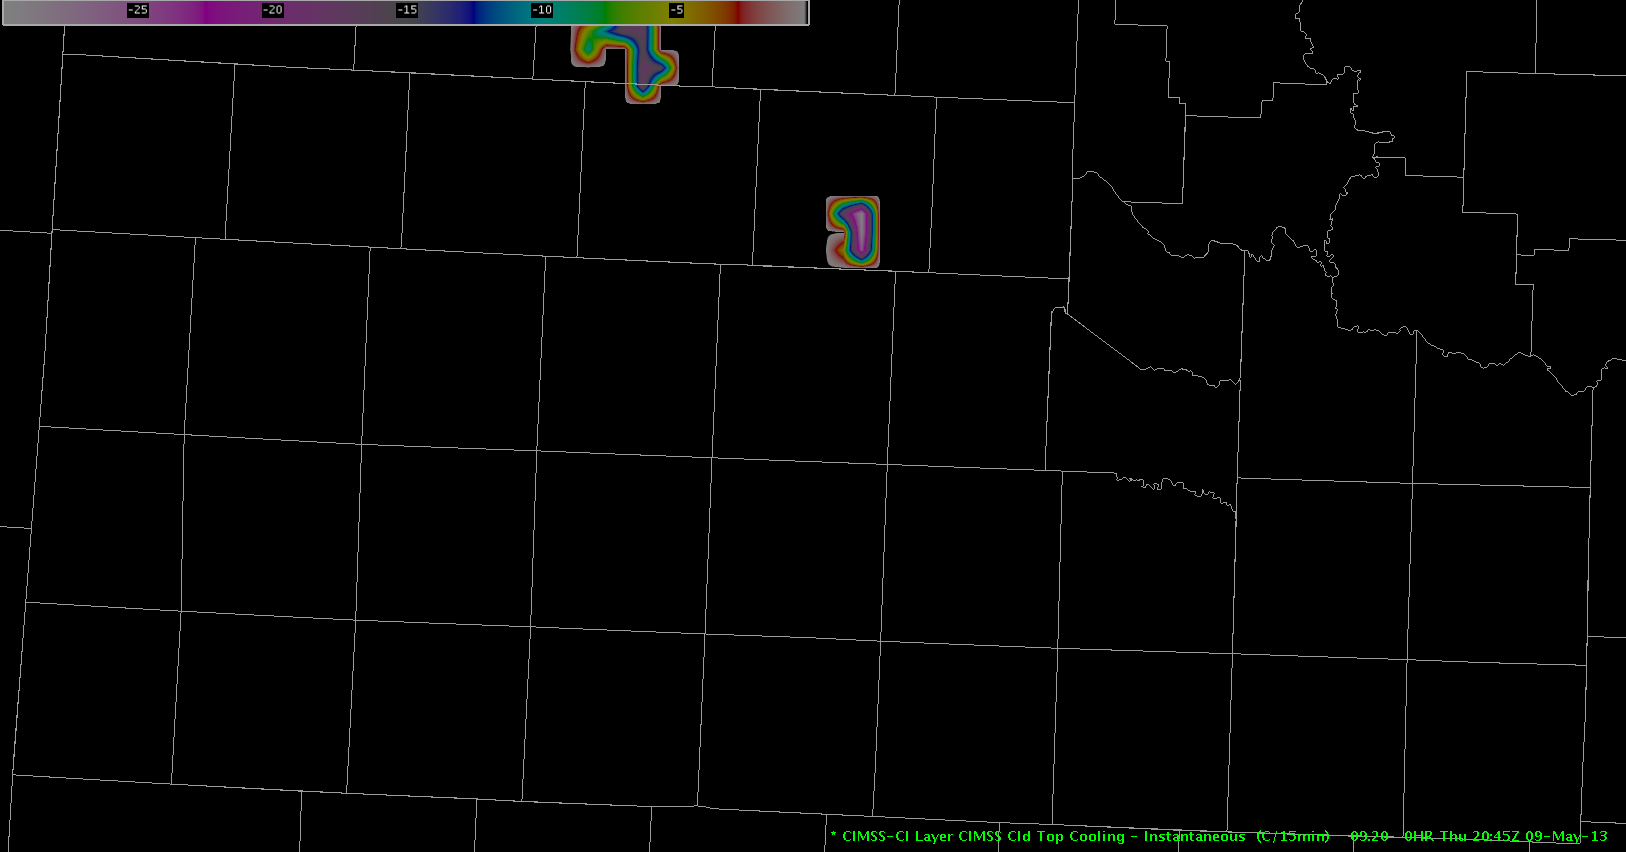
The UAH CI and UW-CTC products were also very persistent in developing convection across the extreme southern Texas panhandle and adjacent portions of West Texas.
UAH CI product prior to convective development this afternoon.UW-CTC product showing persistent cloud top cooling of 15 to 25 C/15 min.
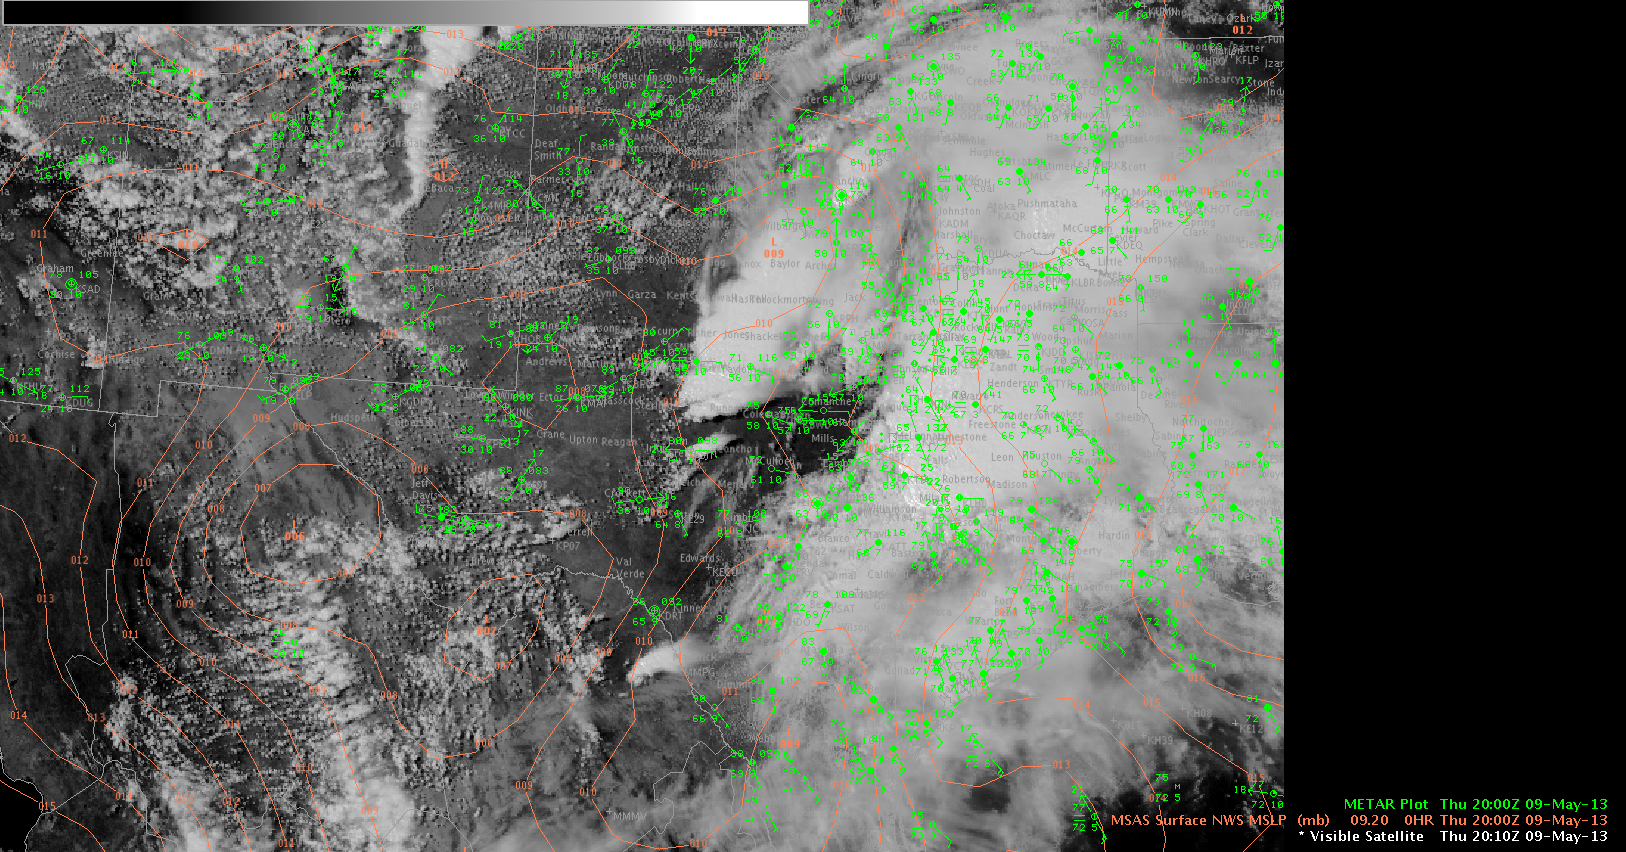
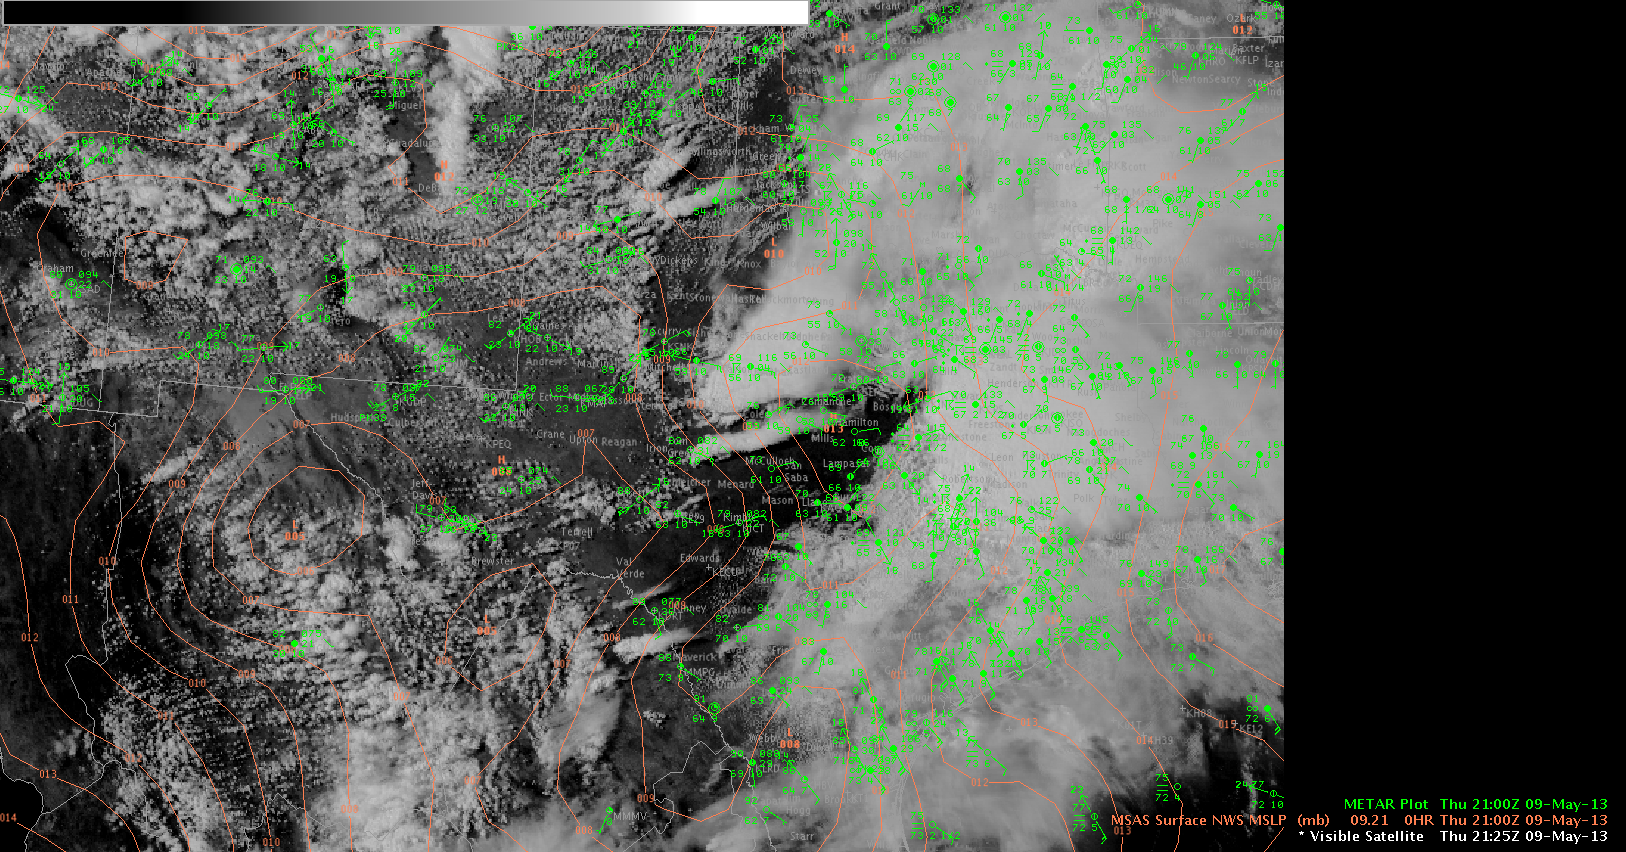
Satellite imagery verified convective development across West Texas. While impossible to forecast the exact location of initiation, the general area was well represented with lead times of up to around half an hour. Convection can be seen beginning near 2010Z and lasting well into the afternoon hours.
Visible satellite imagery overlaid with analyzed mean sea level pressure and surface observations at 2010Z.Same as above at 2125Z.
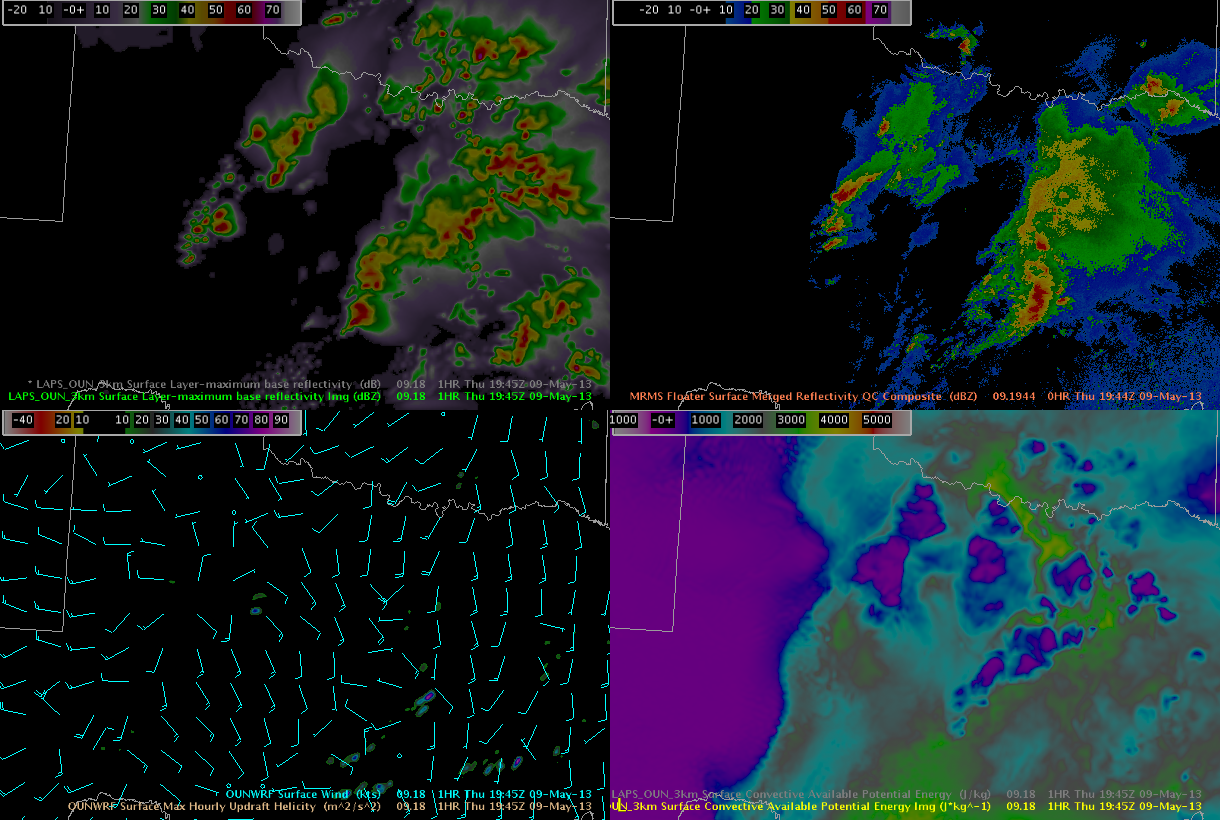
The 18z 3 km LAPS forecast of surface layer maximum base reflectivity has done a decent job predicting the location and track of new updrafts across central Texas, within SJT’s CWA. The below image contains the 1945z forecast of surface max reflectivity from the 3 km LAPS in relation to the 1944z MRMS merged reflectivity QC composite. Note the new individual cells developing across west central Texas on the MRMS Composite and the nearly similar forecast by the 3 km LAPS in both time and space. However, the LAPS forecasts do have their limitations, as the forecasts produced from the initial LAPS product are a function of the WRF. Note the LAPS forecast was not able to handle the timing of the linear complex moving across the FWD forecast area (eastern side of image). The LAPS forecast was a slower and favored individual cells within a line, rather than the complex line that developed and surged eastward.
LAPS refl, MRMS QC Composite, OUNWRF Max hrly updraft helicity/sfcwinds, OUNWRF sfc CAPE
With this event, the LAPS has been a valuable mesoanalyst tool this afternoon, especially within combination with the other short range guidance/mesoscale models.
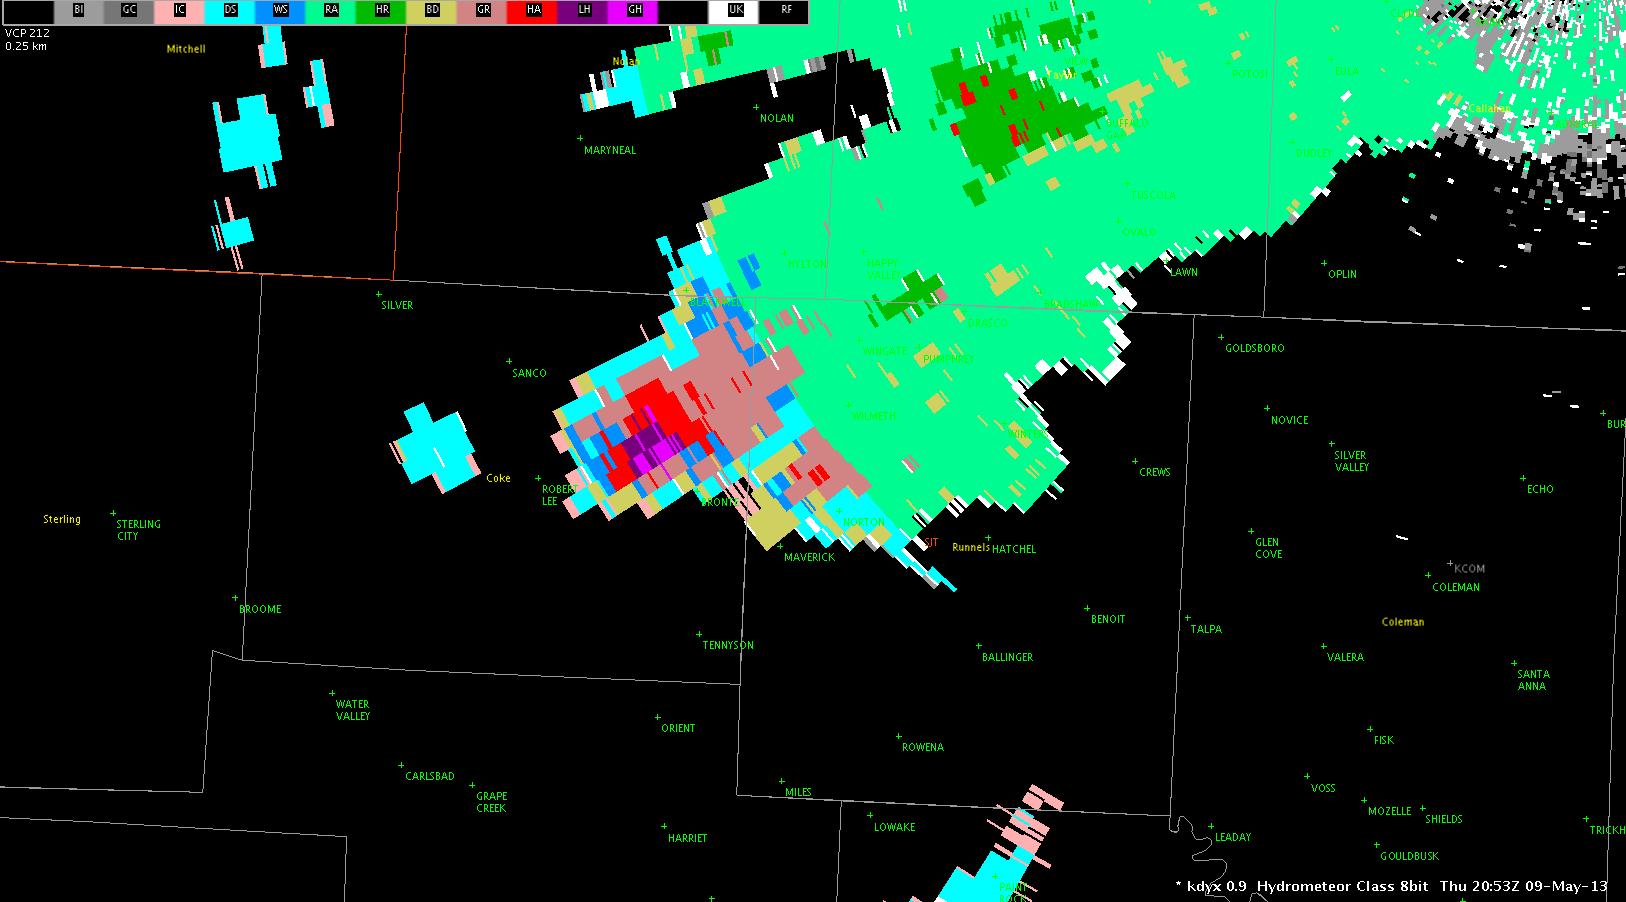
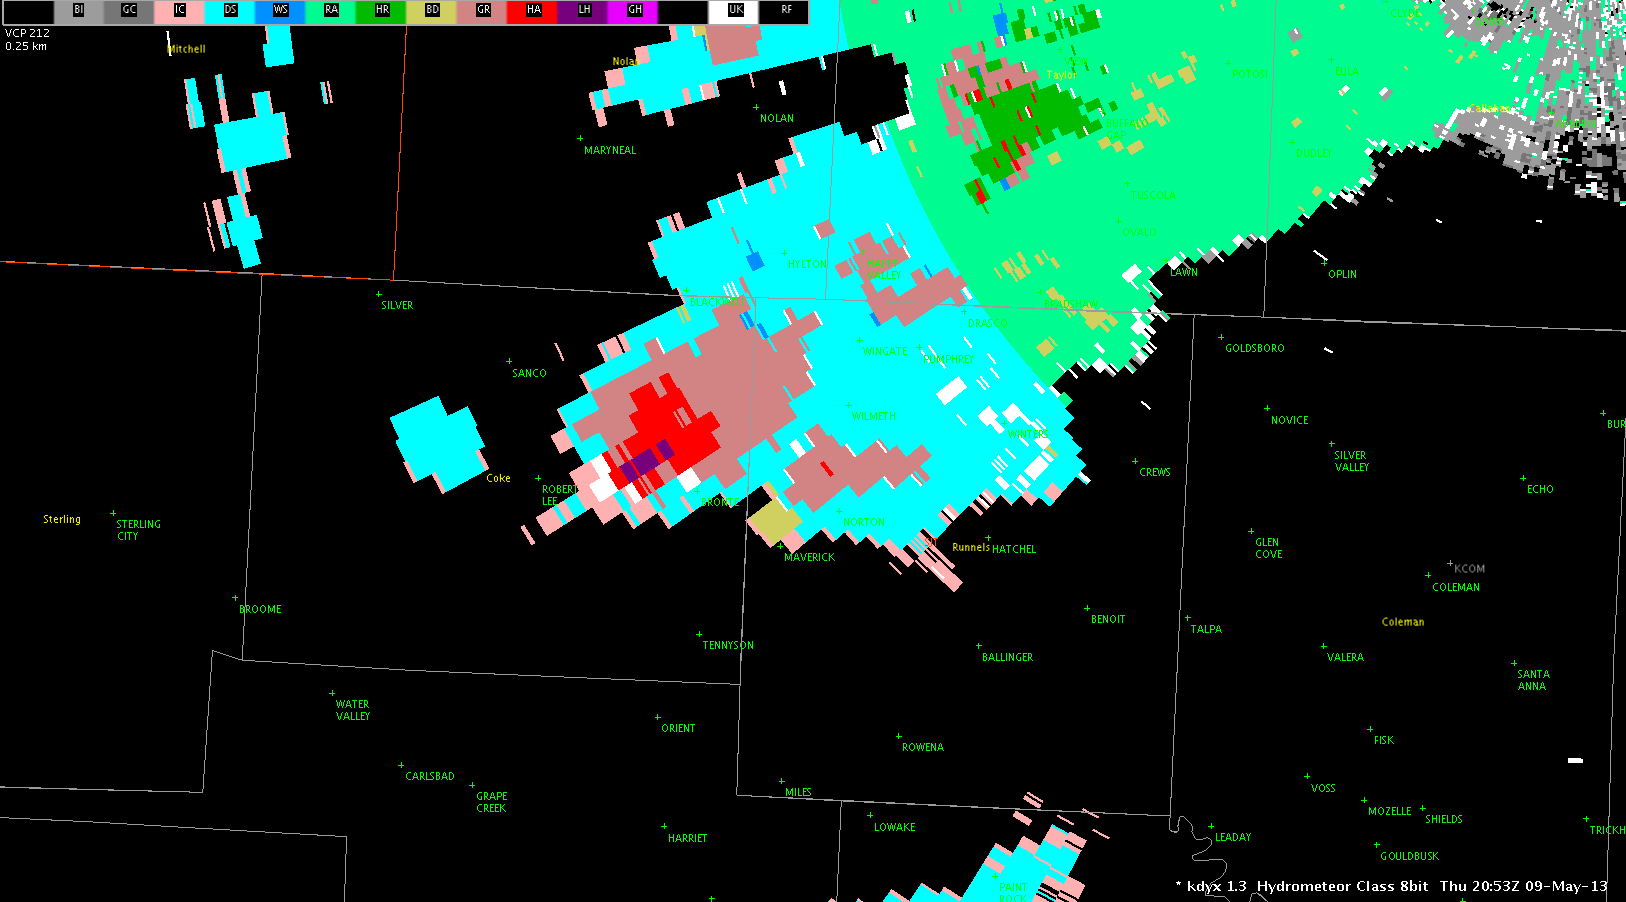
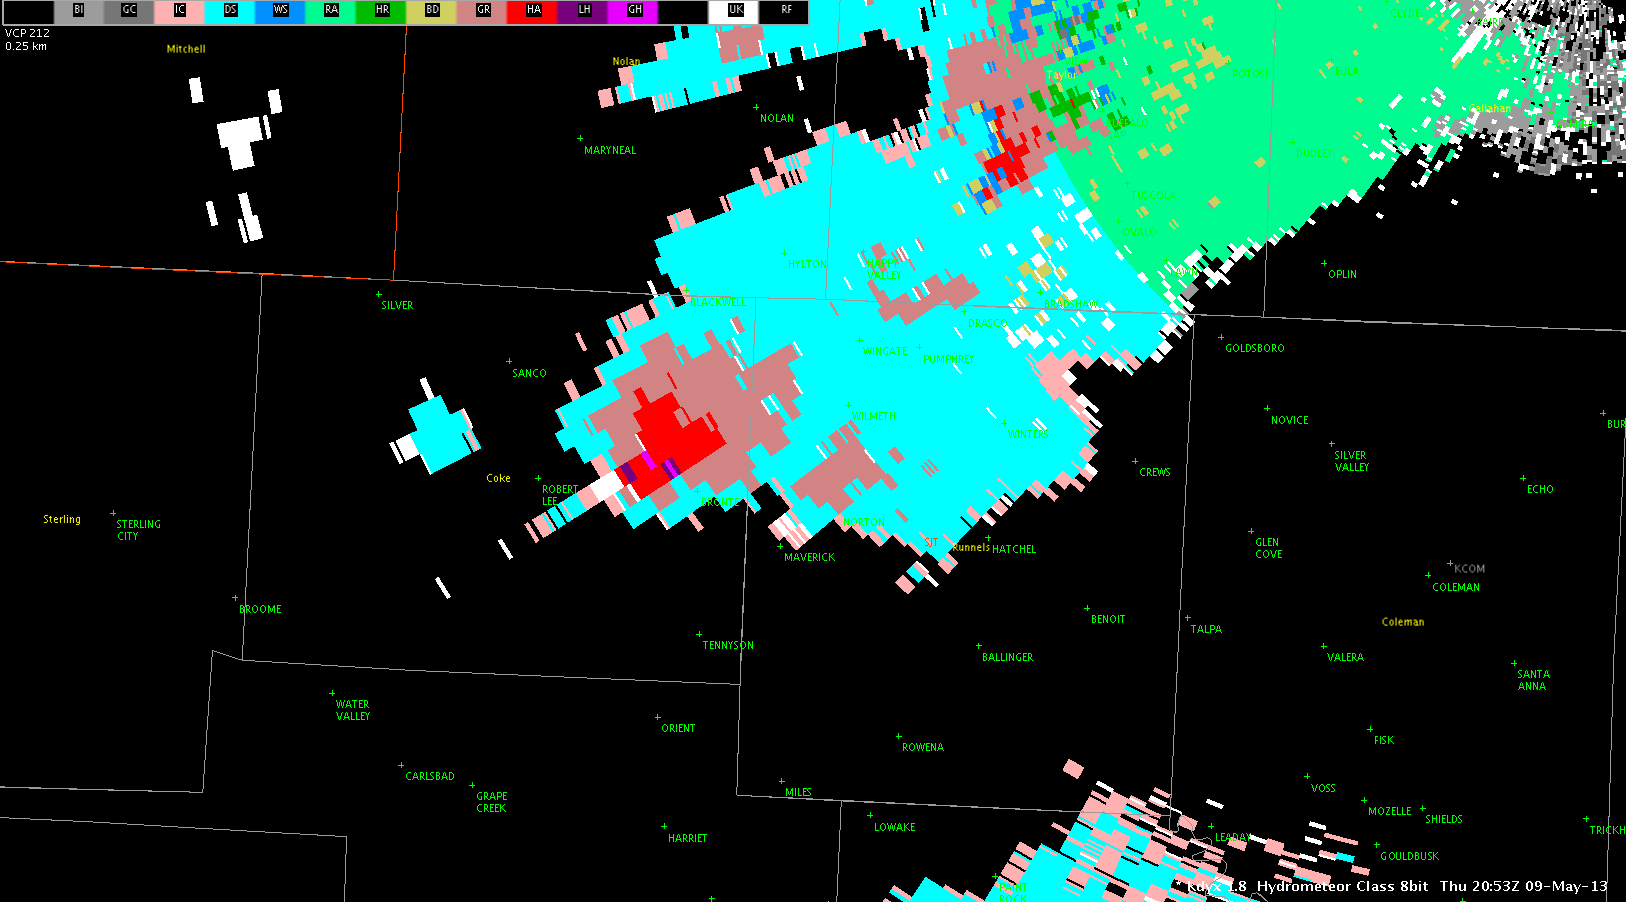
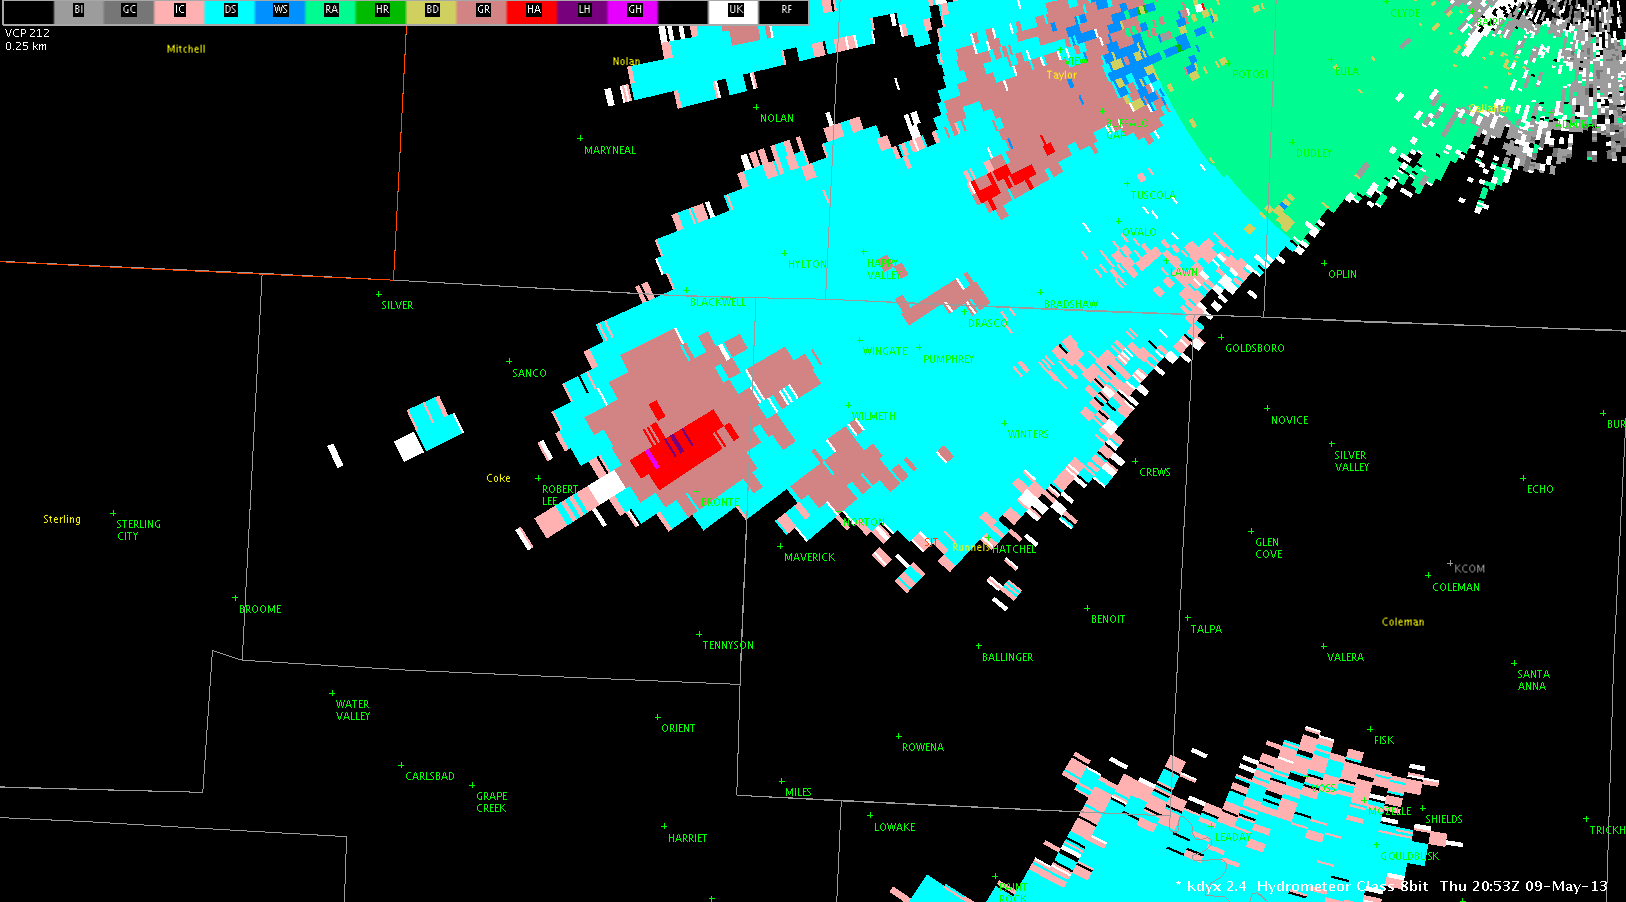
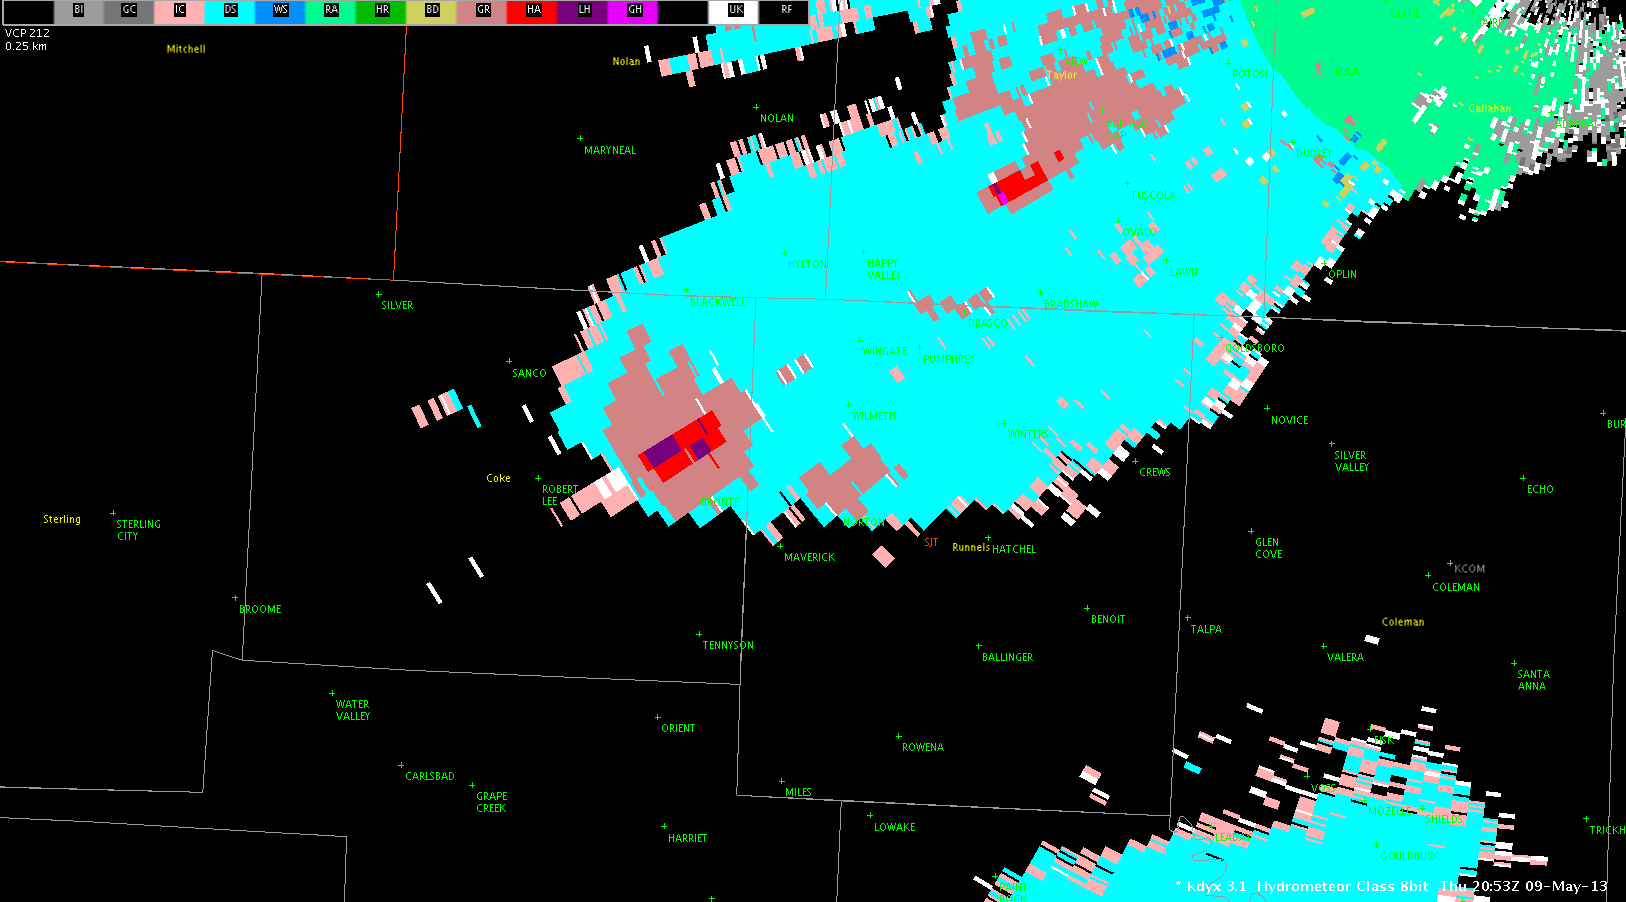
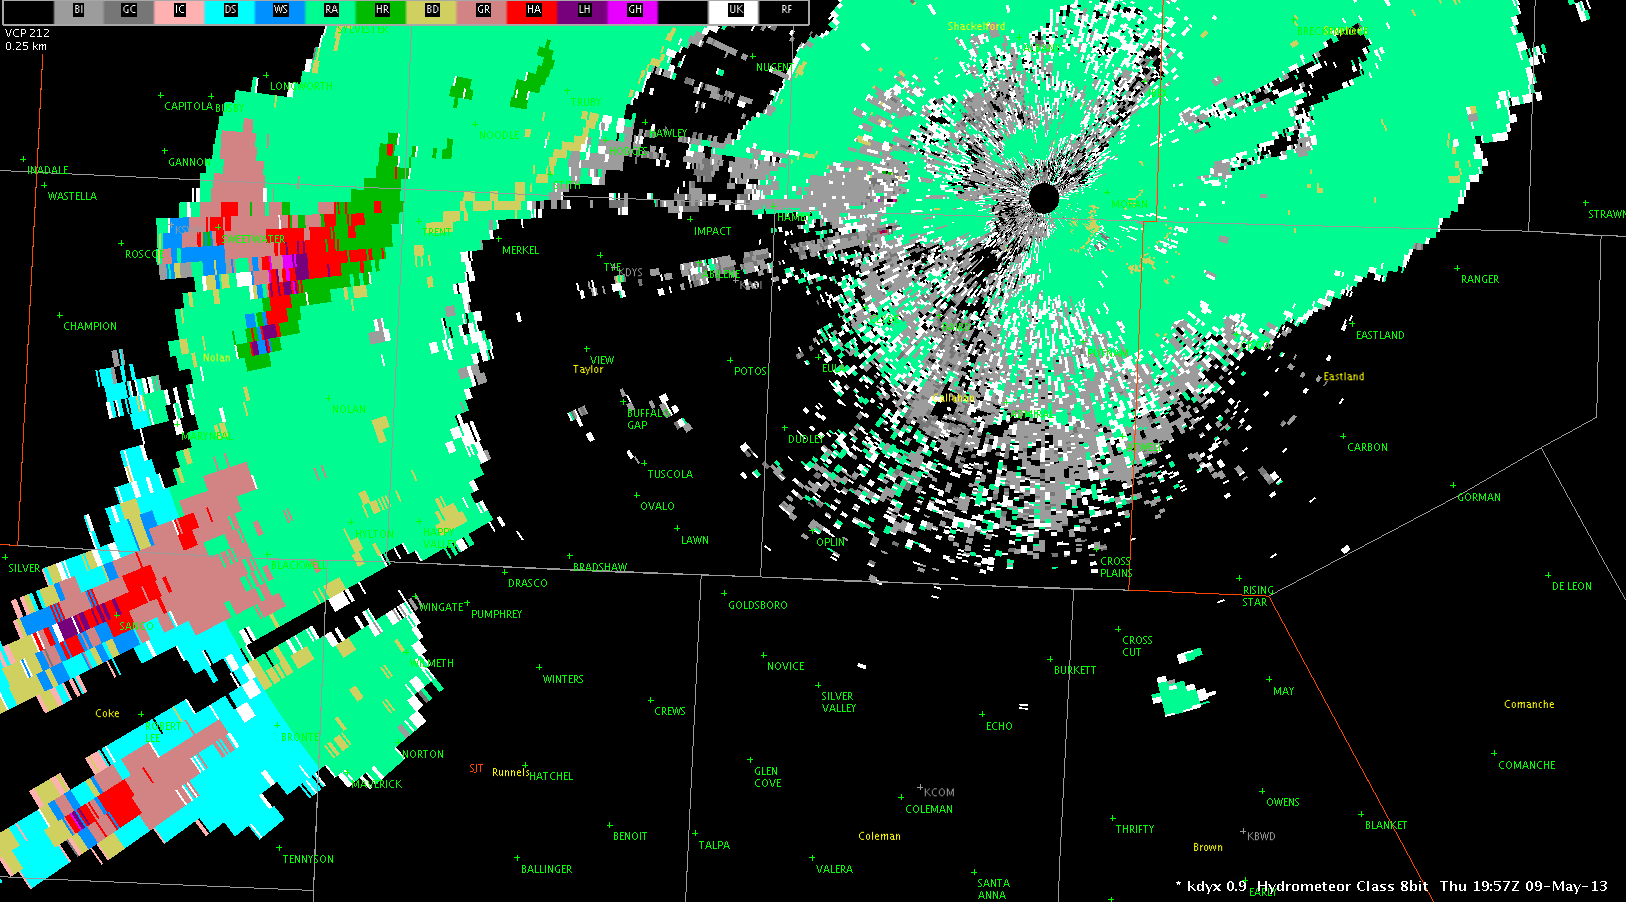
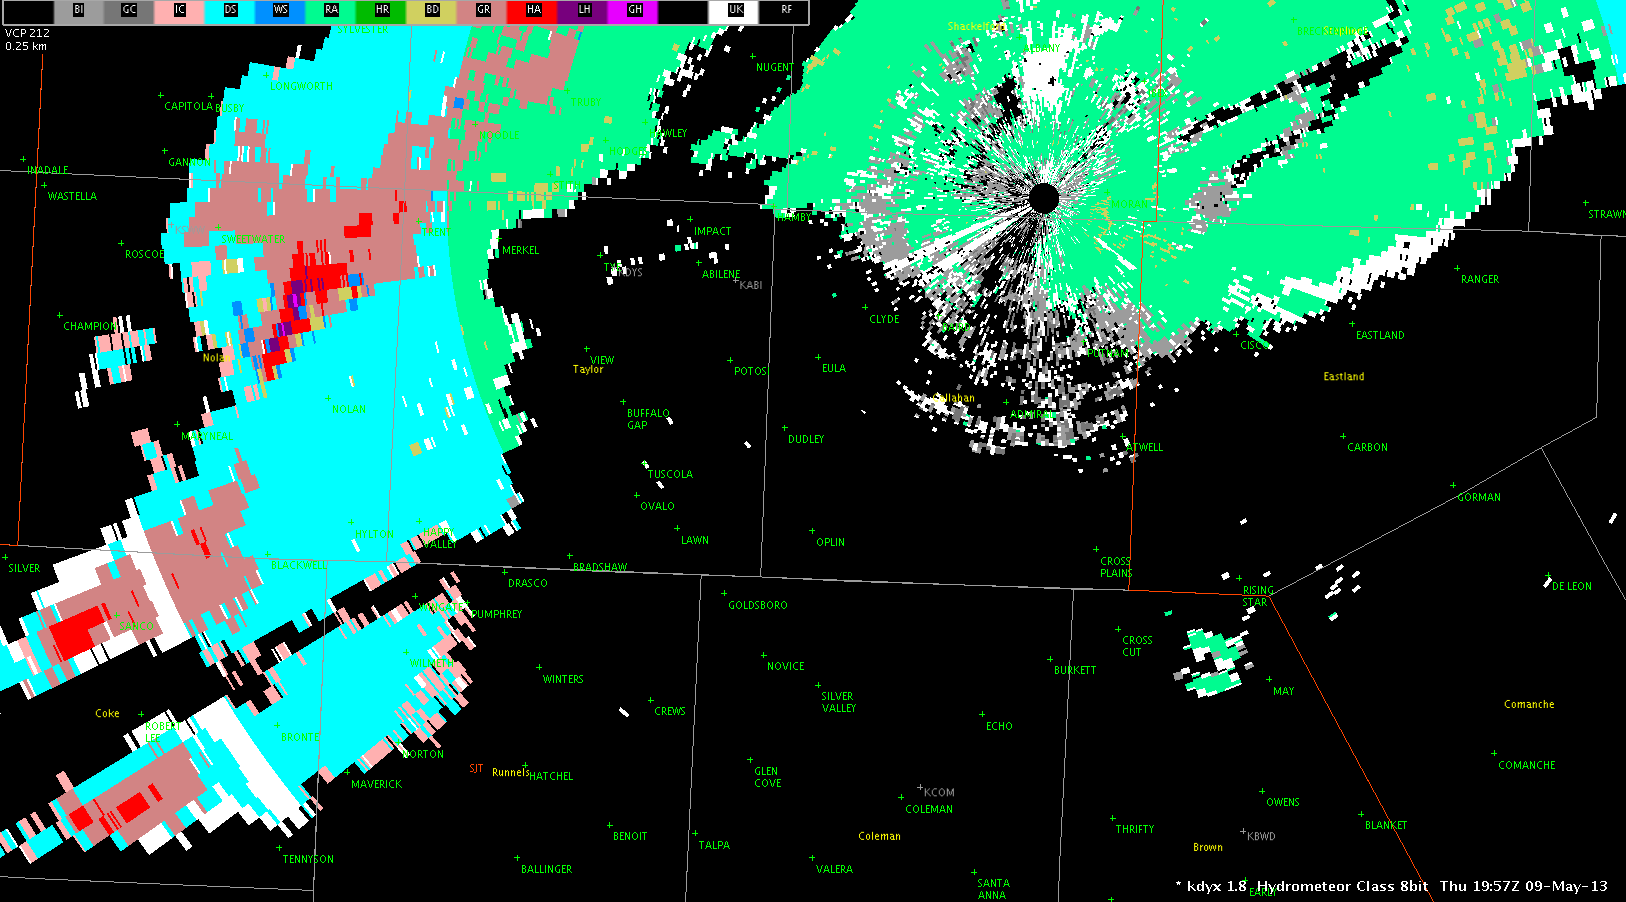
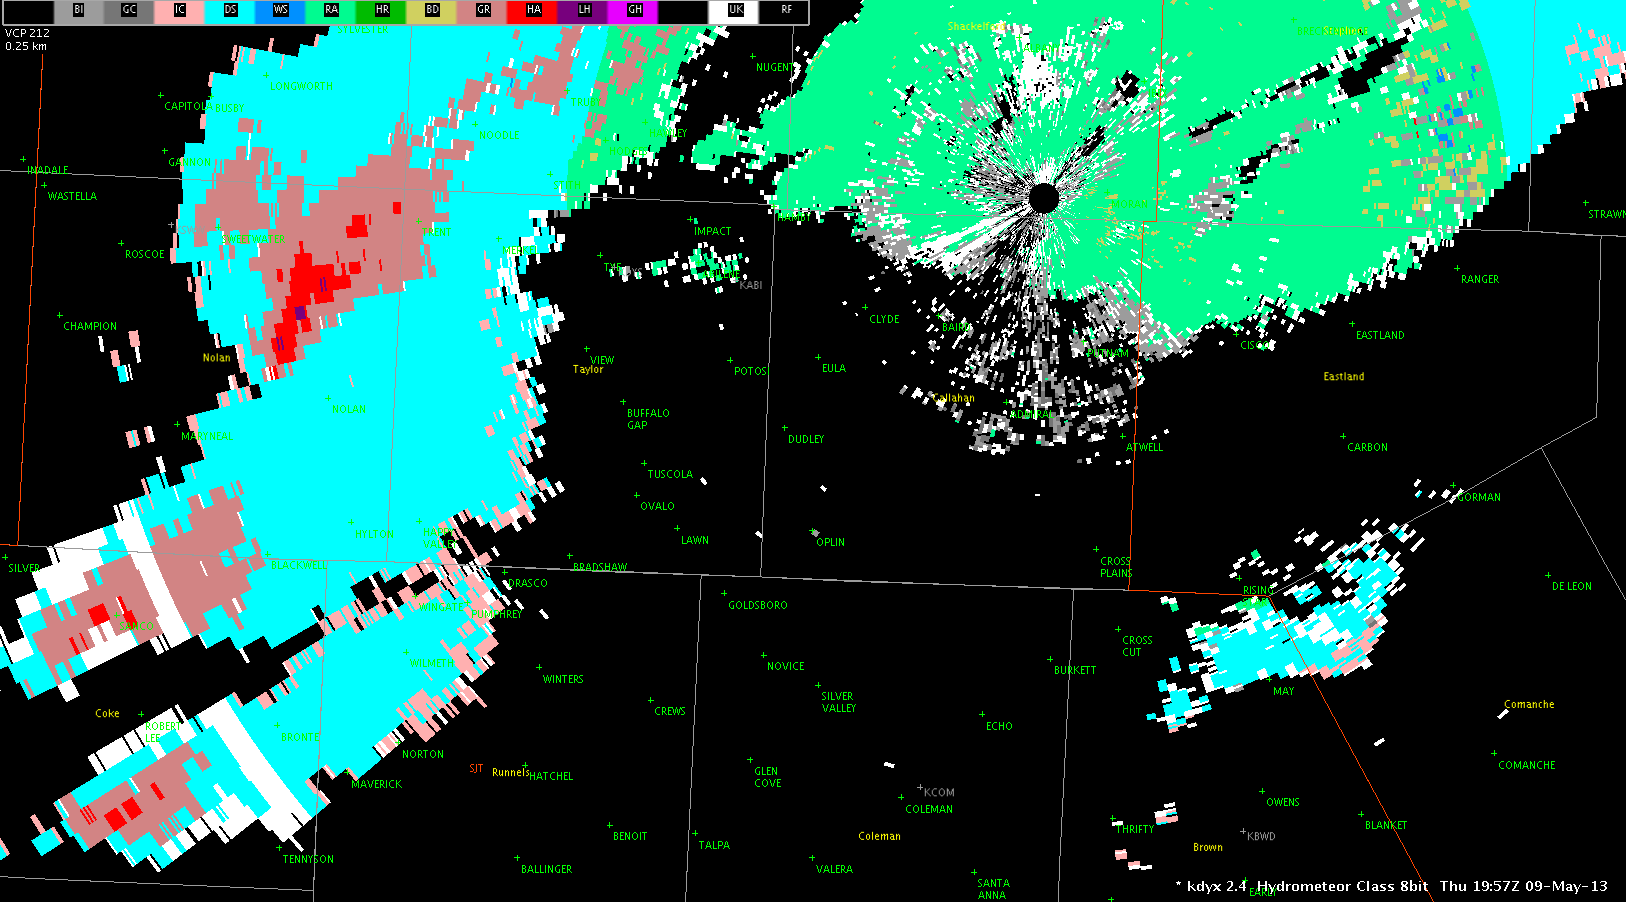
The HSDA algorithm has been persistent in diagnosing large hail with height. Several reports have been received verifying the accuracy of this depiction.
HSDA algorithm showing large hail at the 0.5 degree radar elevation.Same for 0.9 degree slice.1.8 degree slice.2.4 degree elevation.
Destabilization continues to occur further north into the southwestern portions of the OUN CWA. Surface CAPE values are approaching 3000 J/kg and CIN values are near zero. One severe storm has developed along the surface boundary and additional thunderstorms should develop.
In the SJT CWA, thunderstorms continue along the cold front/dryline. Thunderstorms should continue to build southward into the instability axis to the south. CAPE values remain in the 2500 to 3000 j/kg range with little CIN.
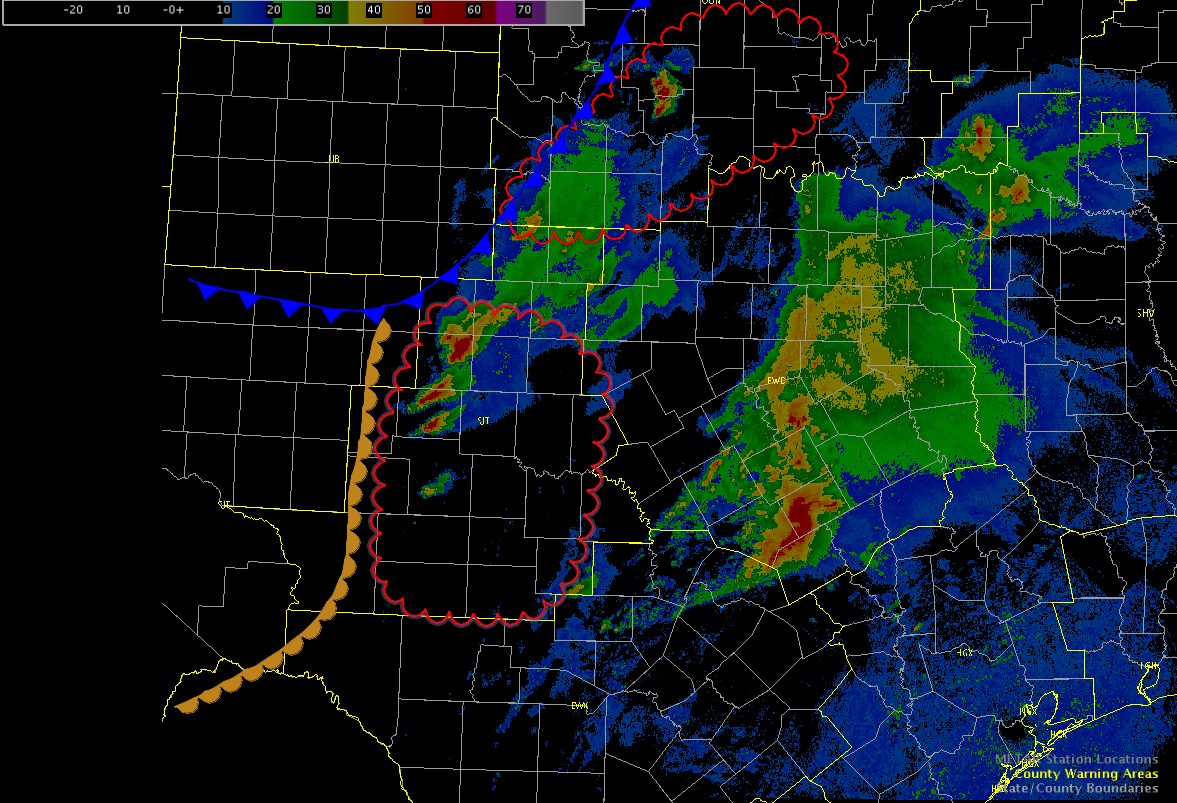
The severe storms in the southern FWD CWA continues to track ESE, but with no additional severe activity expected in the near-term, the FWD team has no moved into the OUN CWA where additional storms are expected and the pGLM data can be utilized.
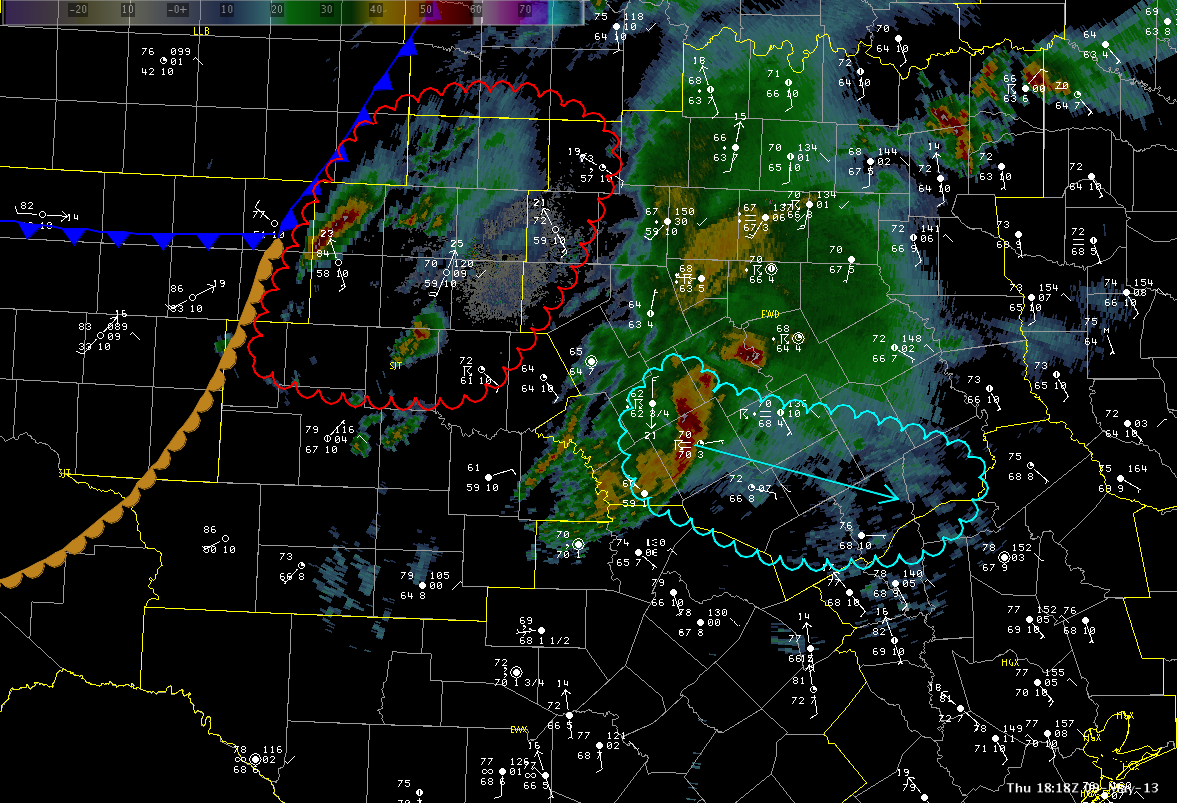
Red outlines mark highest confidence for significant severe weather.
Our forecasters have documented examples of how CTC has performed in areas that are generally clear (aside from cumulus/cumulonimbus development), and we are getting a good feel for how the product behaves. We also understand that areas completely shrouded by high clouds will likely show little to no CI/CTC indications at all.
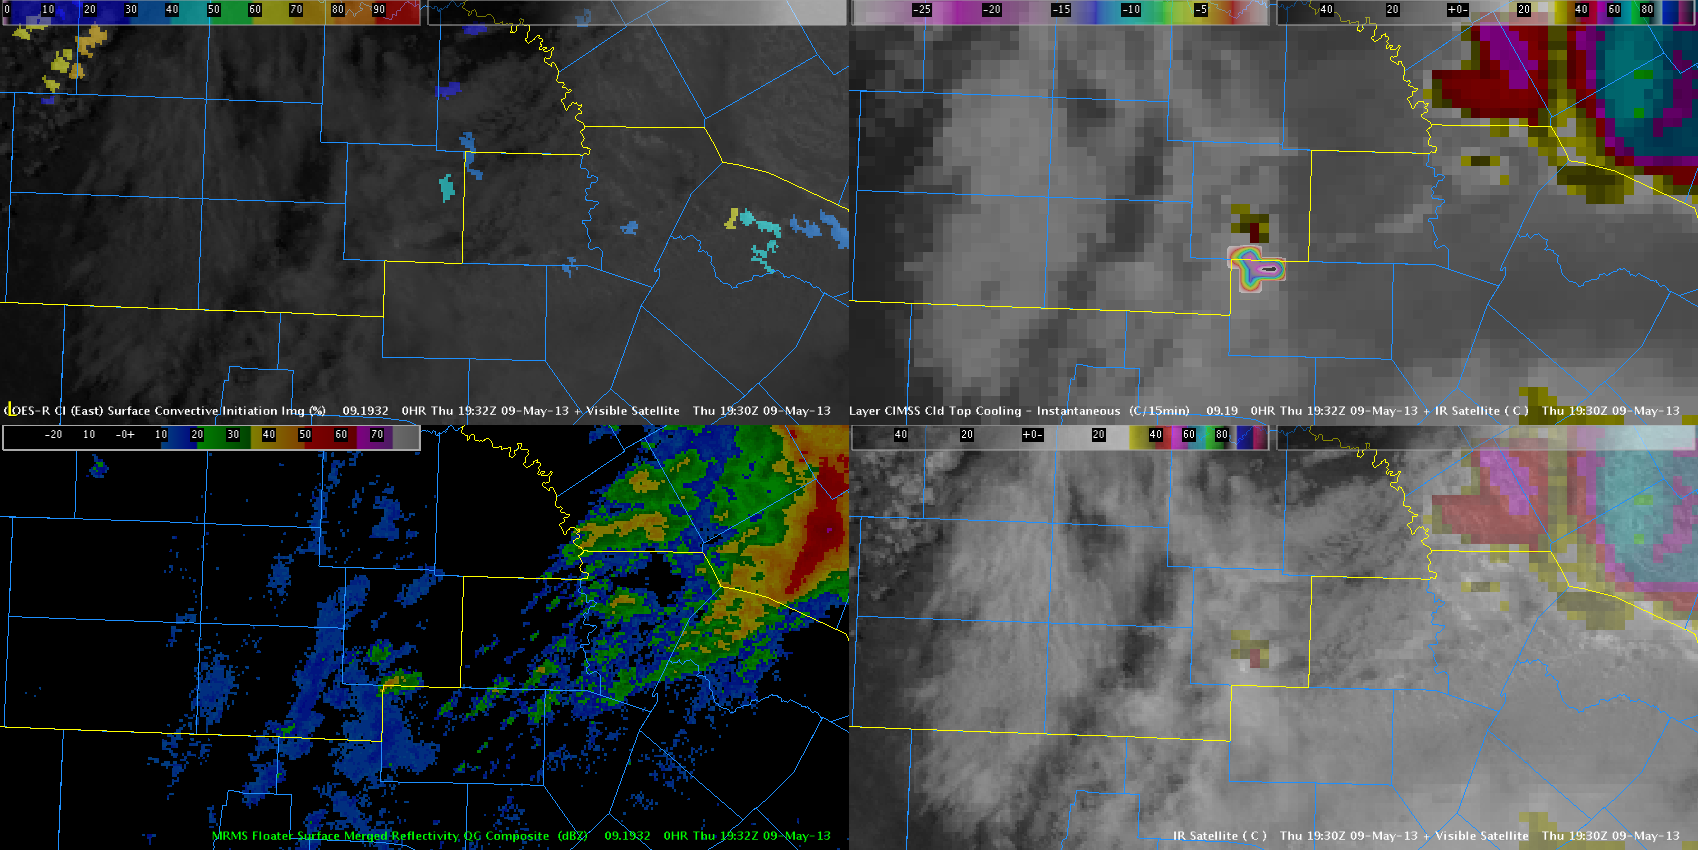
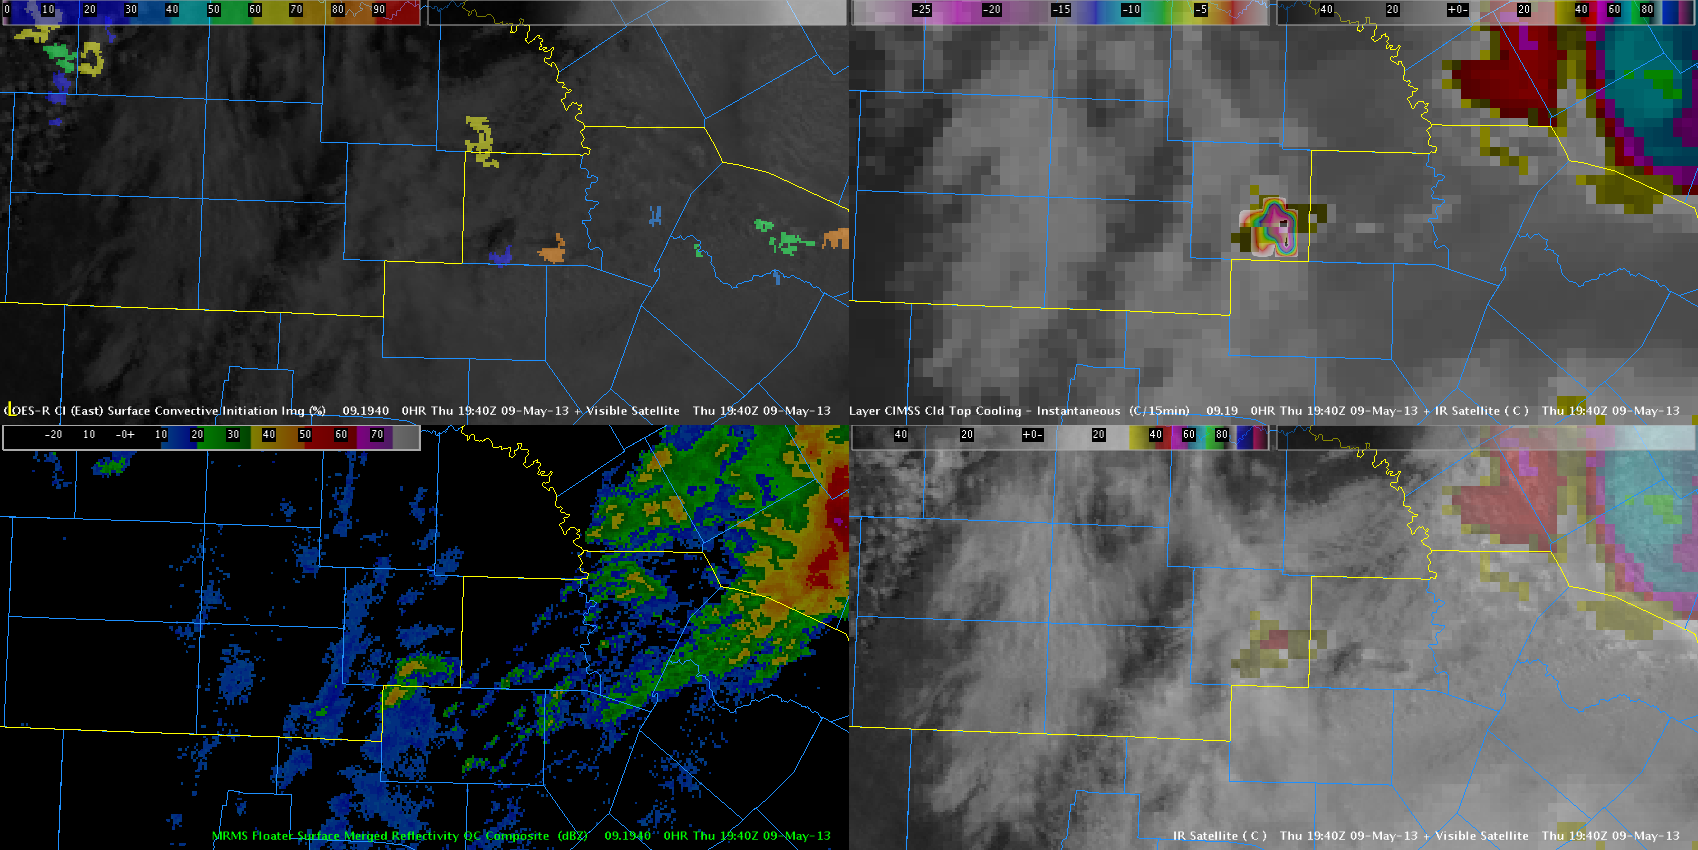
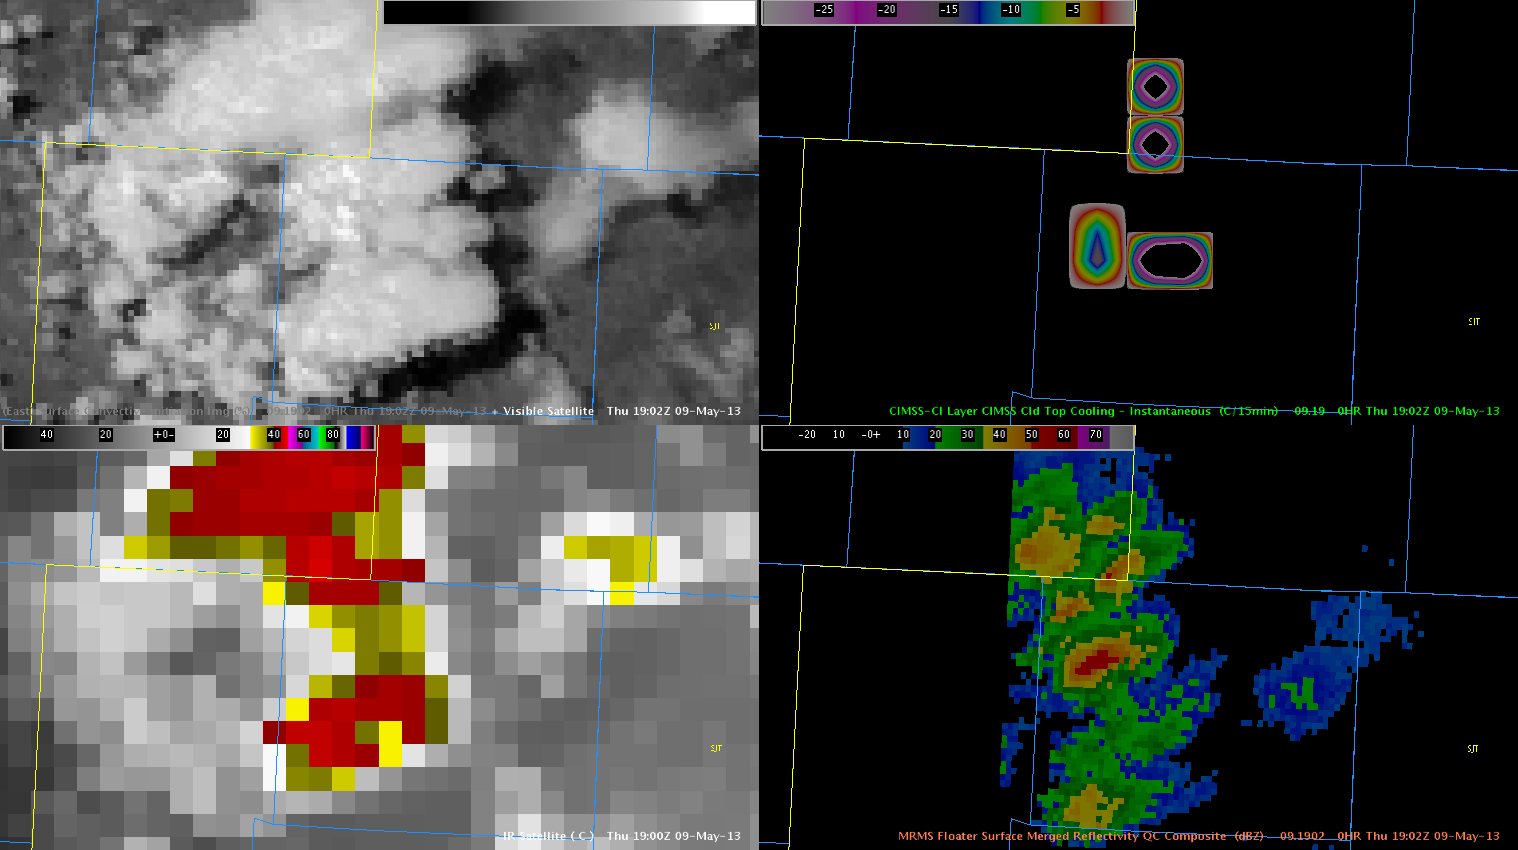
An “in between” example was found in the SE part of the San Angleo TX CWA near 1930Z this afternoon. This area was west of the enormous cirrus shield in central Texas, but still had some scattered to broken high cloud cover in place. As thunderstorm updrafts developed, CTC signals were indicated on two occasions (pictured below).
CTC (top-right) at 1932Z.CTC (top-right) at 1940Z.
The CT values generated here are extremely (and unrealistically) high. Unlike the “off the charts” error documented in an earlier blog entry, these values appear to be co-located with the actual development of the updraft, and not due to spatial or temporal displacement
At least from this example, we can see how differing cloud environments (clear vs. sct/bkn vs. overcast) will lead to different ways in which the CTC product behaves. It will definitely be useful to learn these differences, and if is determined to be more than just a localized problem here, find ways to separate the developing updraft from the incipient cloud cover in a way that will generate more reasonable and useful CTC values.
The western sections of the San Angelo TX CWA have become quite favorable for thunderstorm development. First, here is a look at the sounding from nearby Midland TX at 12Z.
MAF 12Z Sounding
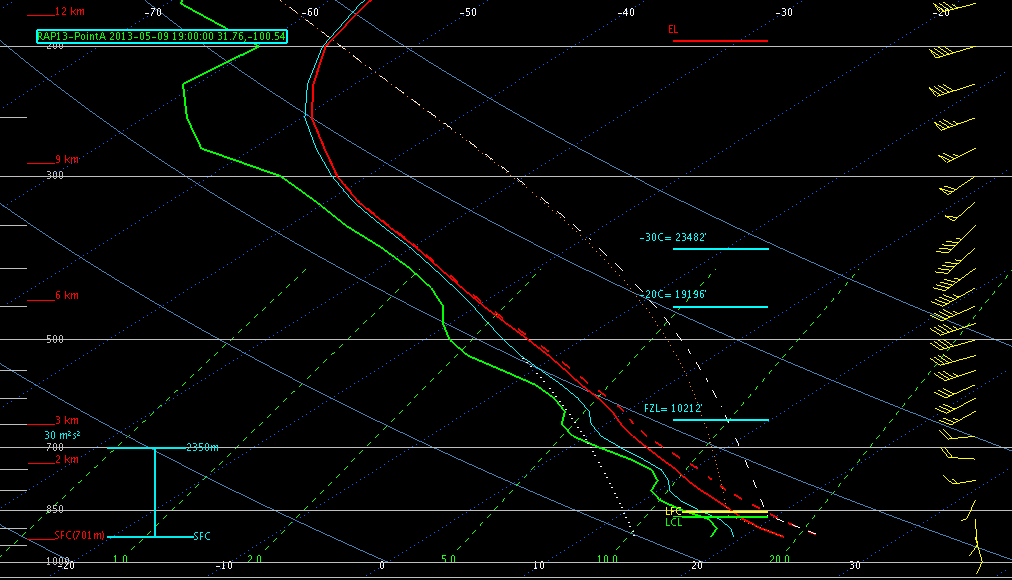
The values seen here are confirmed by RAP13 (pictured) and OUNWRF soundings just ahead of the developing convection near San Antonio.
RAP13 sounding near San Angelo at 19Z.
Lapse rates are extremely steep, and the moisture quality is quite good as well. Deep layer shear is favorable for supercells.
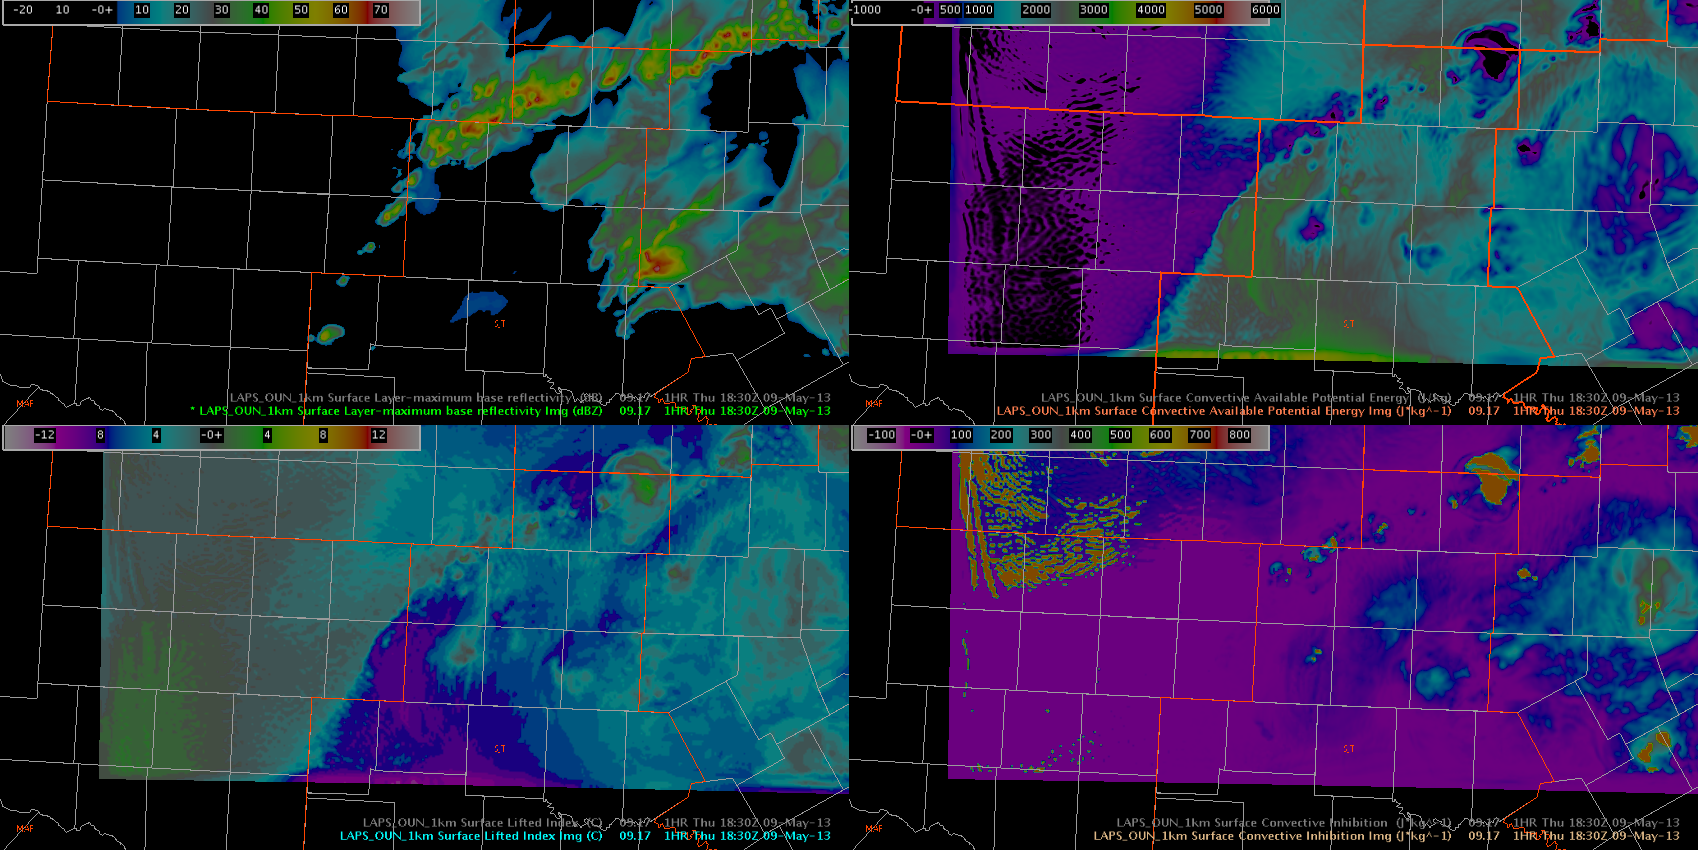
The LAPS 1km (OUN domain) data showed that the dryline in this area would activate explosively, in an area with 3000 J/KG CAPE (first image, top right corner) and LI values near -10 C (first image, bottom left corner). The second image is after the storms are mature, so these values diminish with time due to the convection (perhaps too aggressively ahead of the convection).
1KM LAPS Convective Forecast at 1830Z.1KM LAPS Convective Forecast at 1930Z.
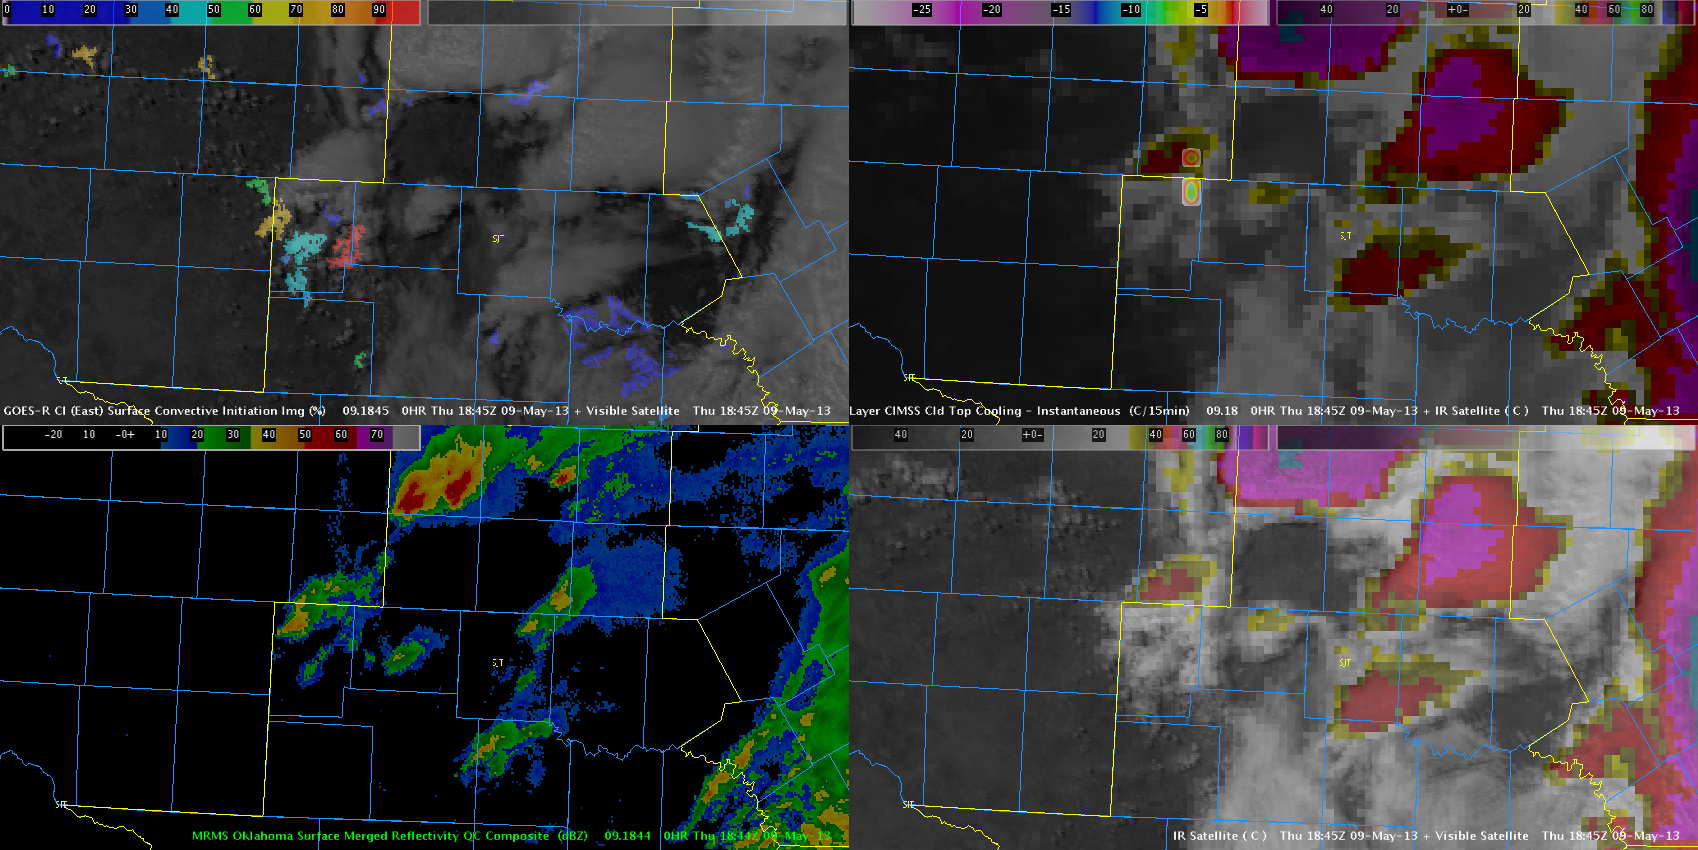
Because this is an area of clearing behind the large cirrus shield associated with the central Texas MCS, the GOES products are providing information about development in this region.
GOES CI/CTC at 1830Z. Note the areas of enhanced values near the dryline.GOES CI/CTC at 1845Z. Note the areas of enhanced values near the dryline.
A warning was issued based on this data. The polygon was massaged to incorporate both aggressive CI signal to the south and CTC signal to the north. The UAH CI product was persistent in depicting 90 plus percent probabilities of CI while the CTC product indicated 10 to 15 degrees of cooling over a 15 minute interval. No reports were received to verify the warning, but MESH did end up indicating values of 0.87 inches, which has correlated to severe hail in past events and similar environments this week.
The Cloud-top-Cooling algorithm was off the charts with values of -60 C/15min. This is most likely due to some error in the computing as the anvil moved east. The previous IR frame had no thunderstorm cloud over the location and the cloud top temperature went from +12 to -41 C. This could be a one time error, as other frames do not show this, but something a forecaster needs to be aware of.
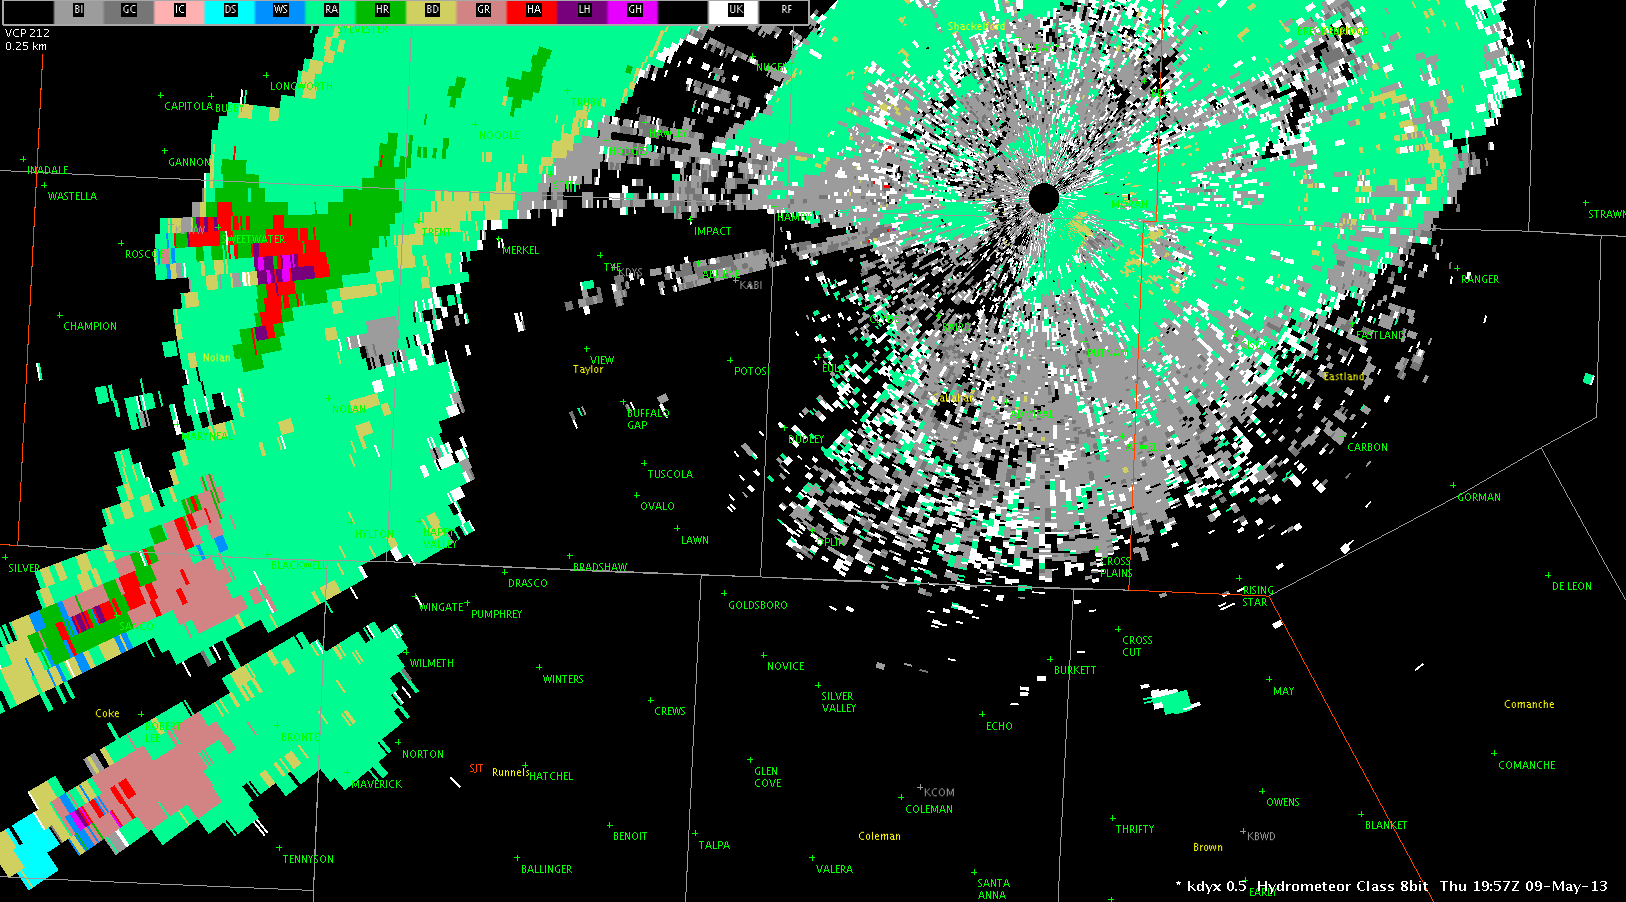
There are two main area of concerns over the next two to three hours. The first is across the southern FWD CWA. A strong to marginally severe storm is currently tracking ESE and is indicated in the image below in cyan. This storm is moving into an environment of 2000 J/kg of surface CAPE but is going to feel the effects of some inhibition. This should allow the storm to maintain its intensity with some growth possible if CIN values decrease with further heating and destabilization this afternoon.
Further to the west in the SJT CWA, some clearing as allowed temperatures to warm into the middle 80s with dewpoints in the upper 50s to lower 60s. This leads to CAPE values of 3000-4000 J/KG given steep mid-level lapse rates near 7.5 C/Km. This area is also near the surface front/dryline and this will serve as an additional surface focus for convection. With an uncapped airmass, this area will likely be the best area for supercells and large hail. This region is in red in the image below. The HWT will have one team in the FWD CWA and one in SJT.
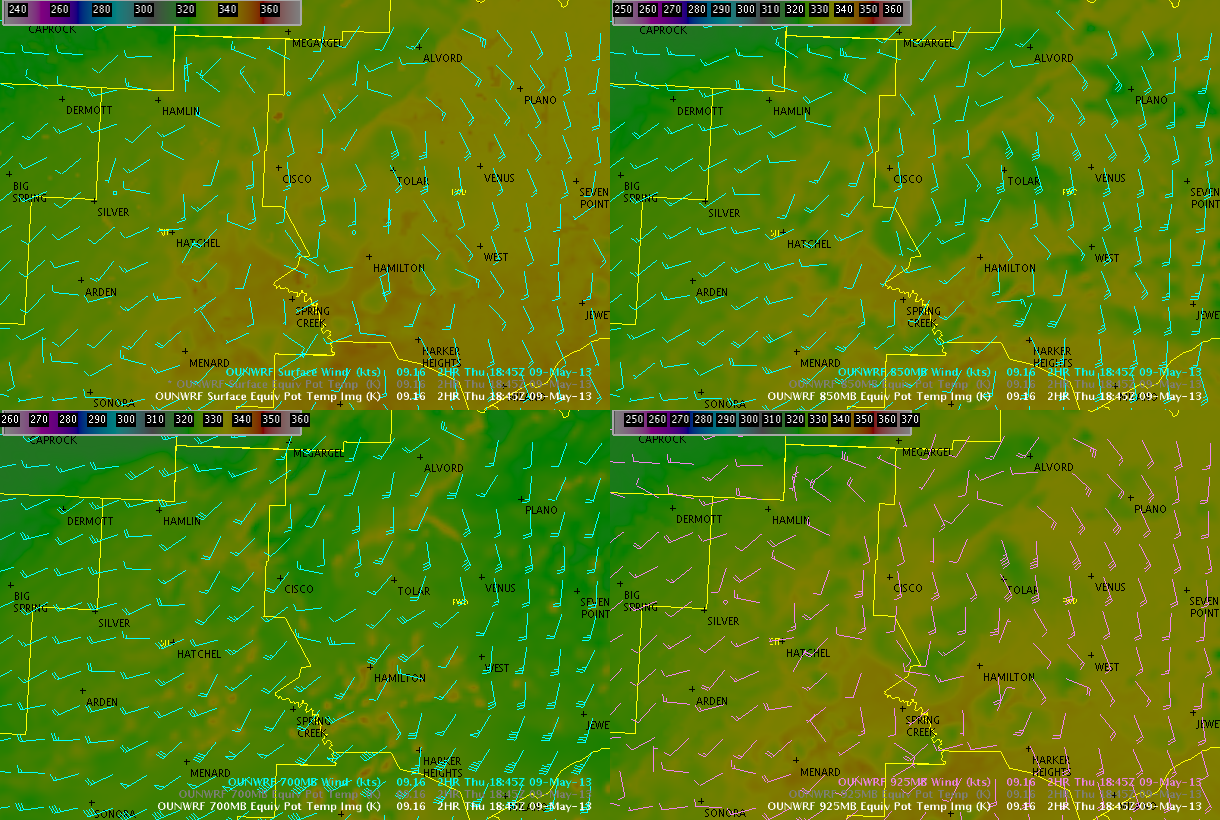
The 16z run of the OUNWRF has captured the increasing moisture and temps with its mid-level theta-e fields quite nicely…with theta e values at 850 and 700mb increasing 10 to 12 K over a 2 hour period, primarily pooled near the pseudo-triple point mentioned above across the northern portion of SJT’s CWA.
OUNWRF Theta E fields and Winds (sfc, 850, 700, 925)
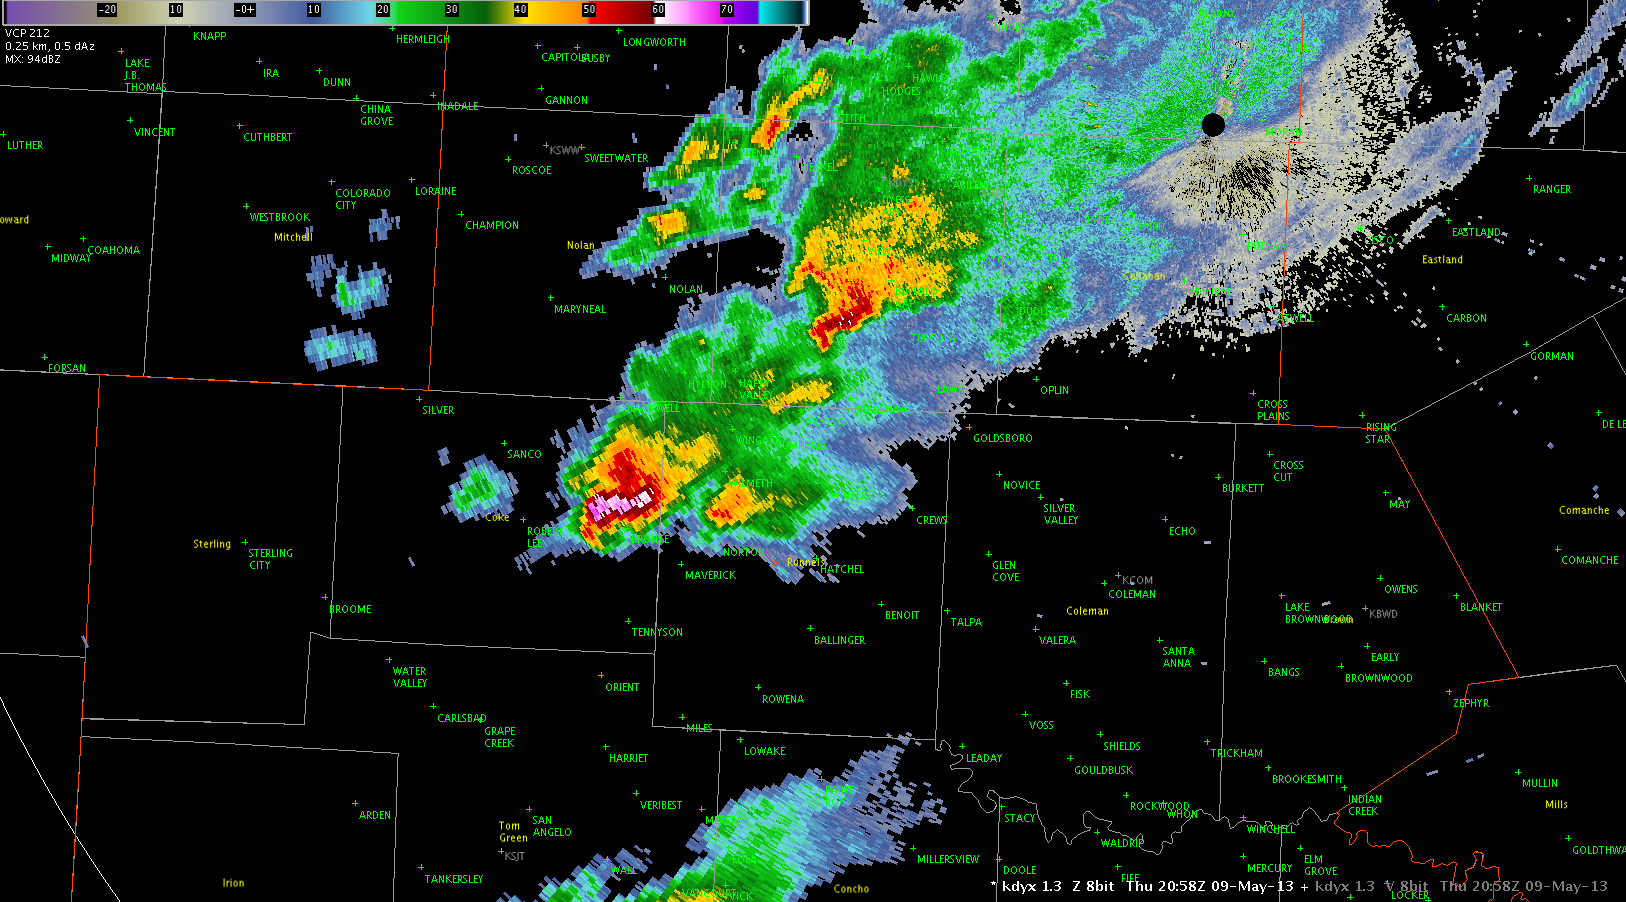
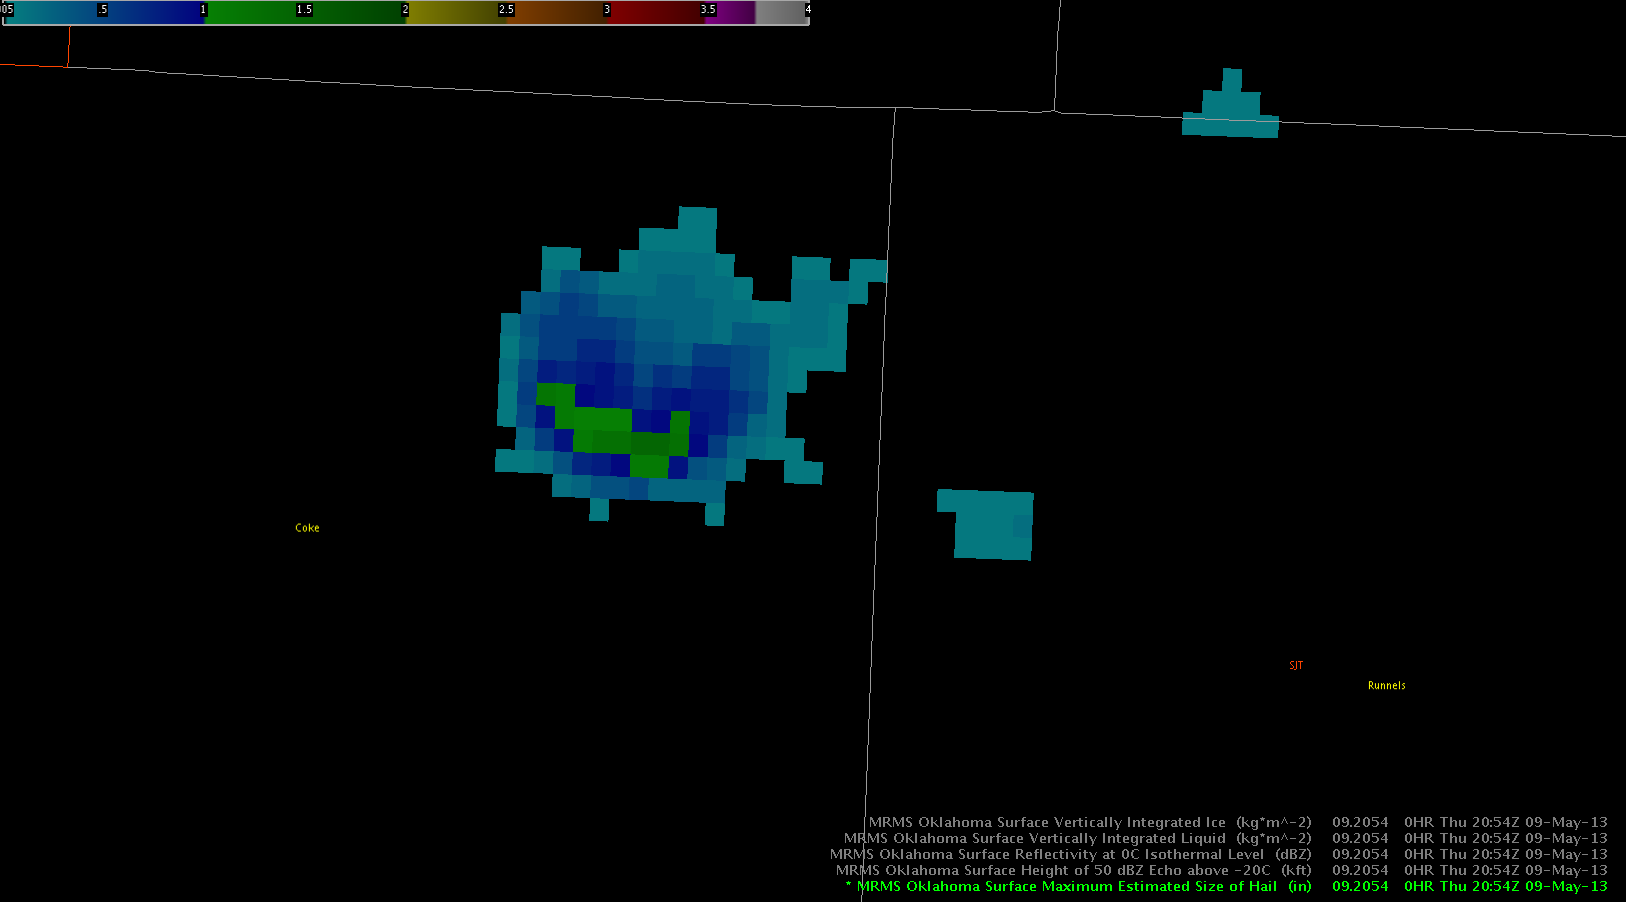
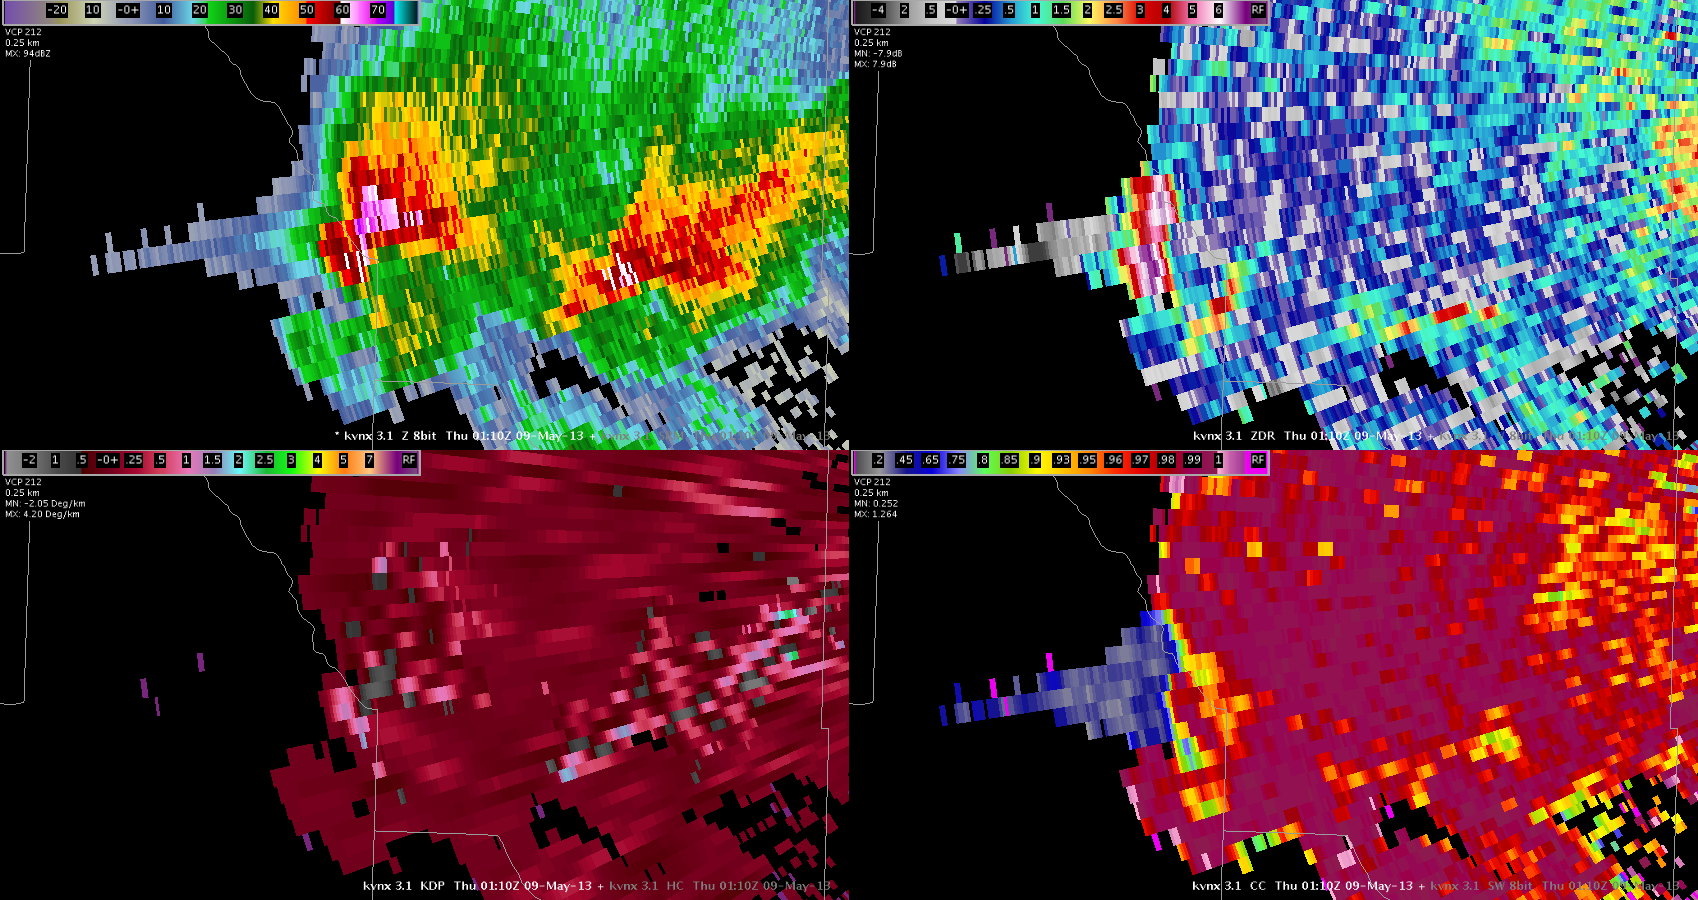
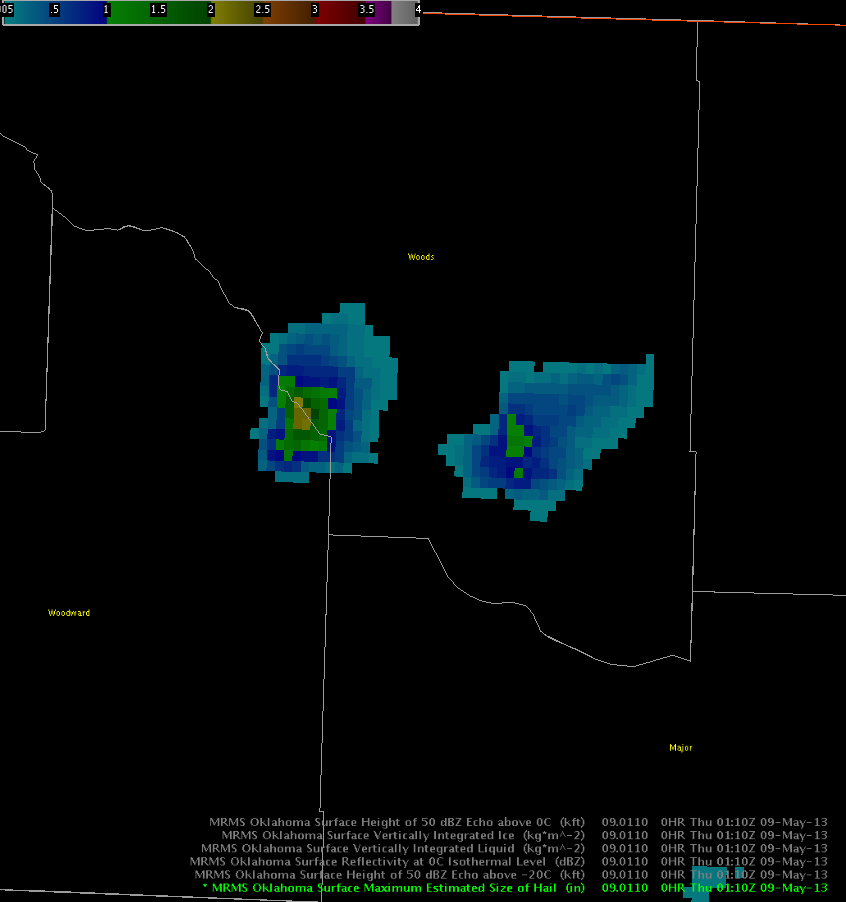
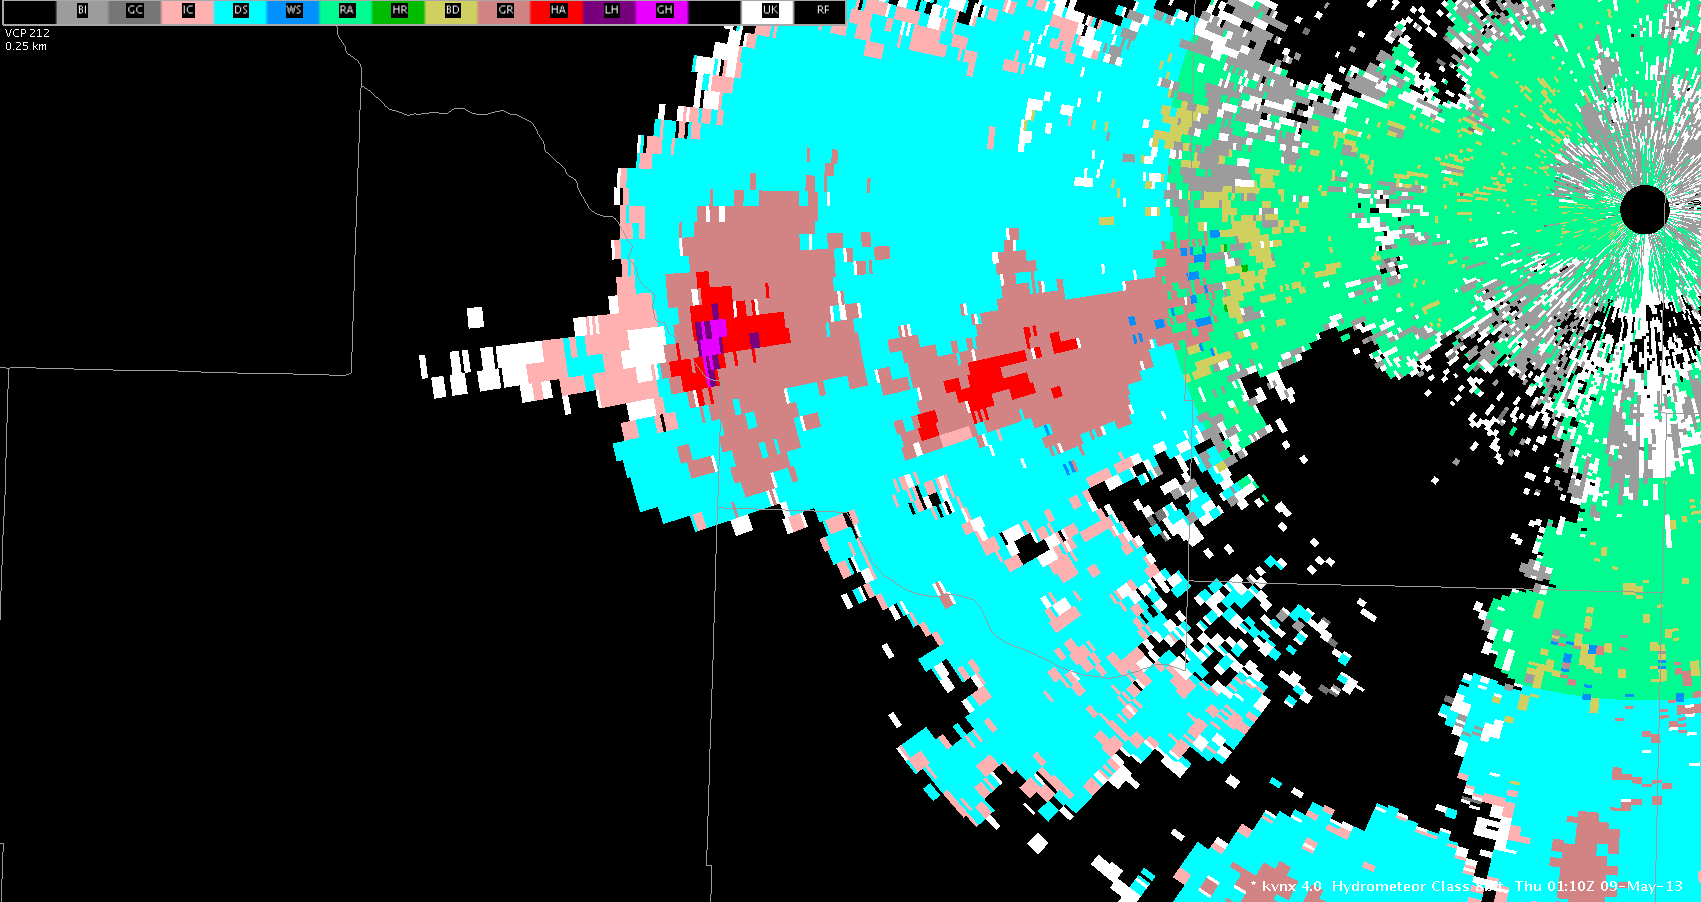
A 3 body scatter spike depicted by reflectivity, differential reflectivity, correlation coefficient, and specific differential phase correlated well with experimental products. MESH in excess of 2 inches corresponded with HSDA depicted giant hail.
4 panel showing a 3 body scatter spike in reflectivity and dual-polarization data.MESH values over 2 inches agreeing with the location of a 3 body scatter spike.Corresponding HSDA depiction of giant size hail.