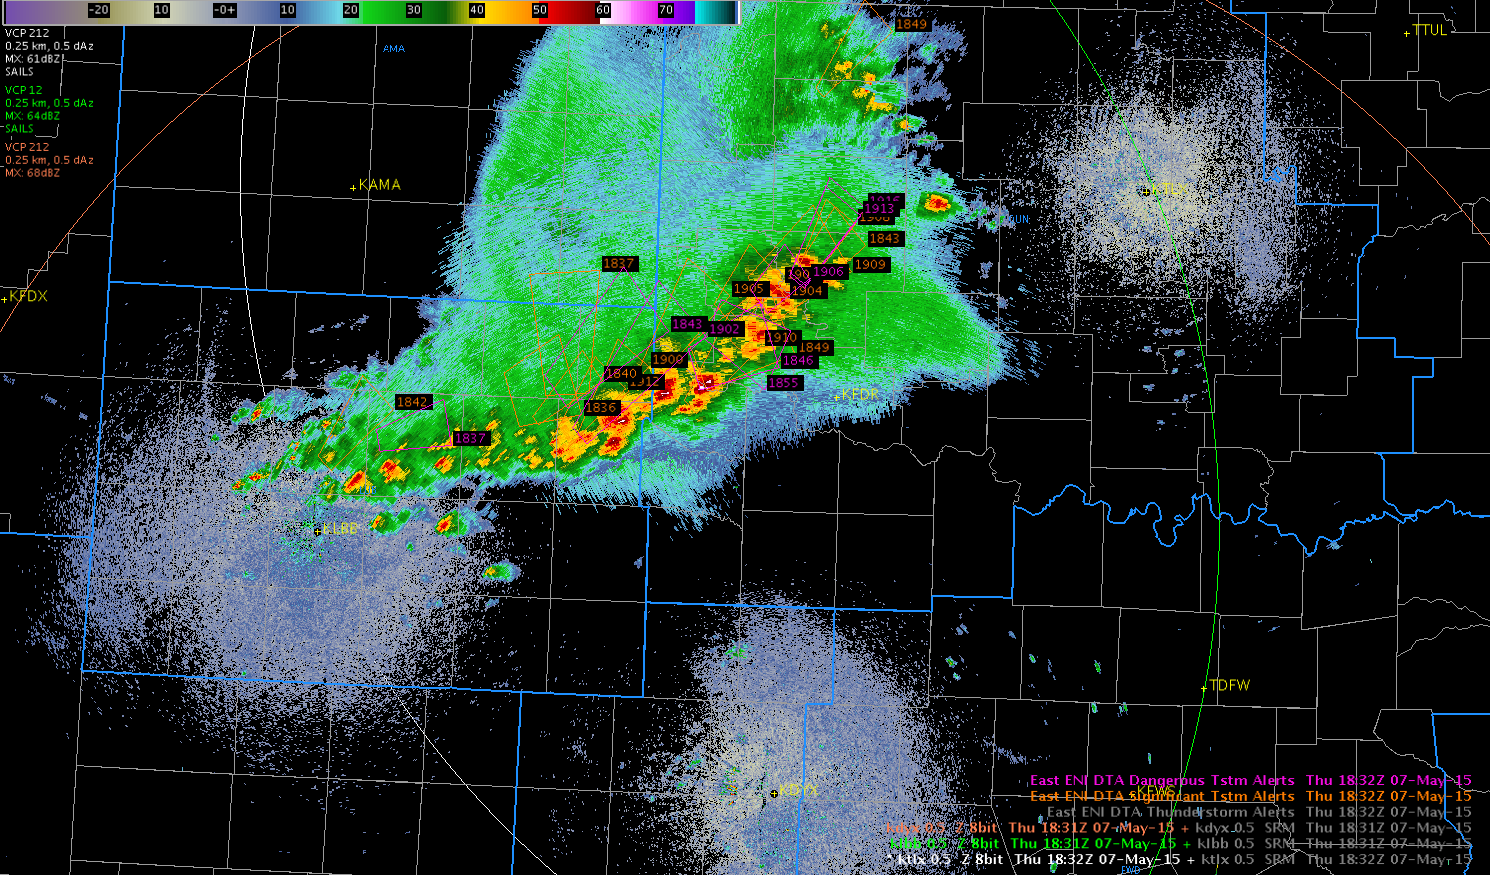
Water vapor imagery early this afternoon is showing a deep closed upper low over CA with broad southwesterly flow across the southern plains with a weak disturbance moving through the flow which seems to be enhancing/sustaining convection moving through the western portion of the forecast area. Visible imagery shows well the ongoing convection as well as a boundary situated across KS southwestward into the OK/TX panhandle.
 A quick look at the GOES-R CAPE showed values generally in the 1000-1500 J/kg except along the Red River where lower values were shown below 1000 J/kg. There definitely appears to be some influence of cirrus and mid level clouds associated with the ongoing convection affecting the output.
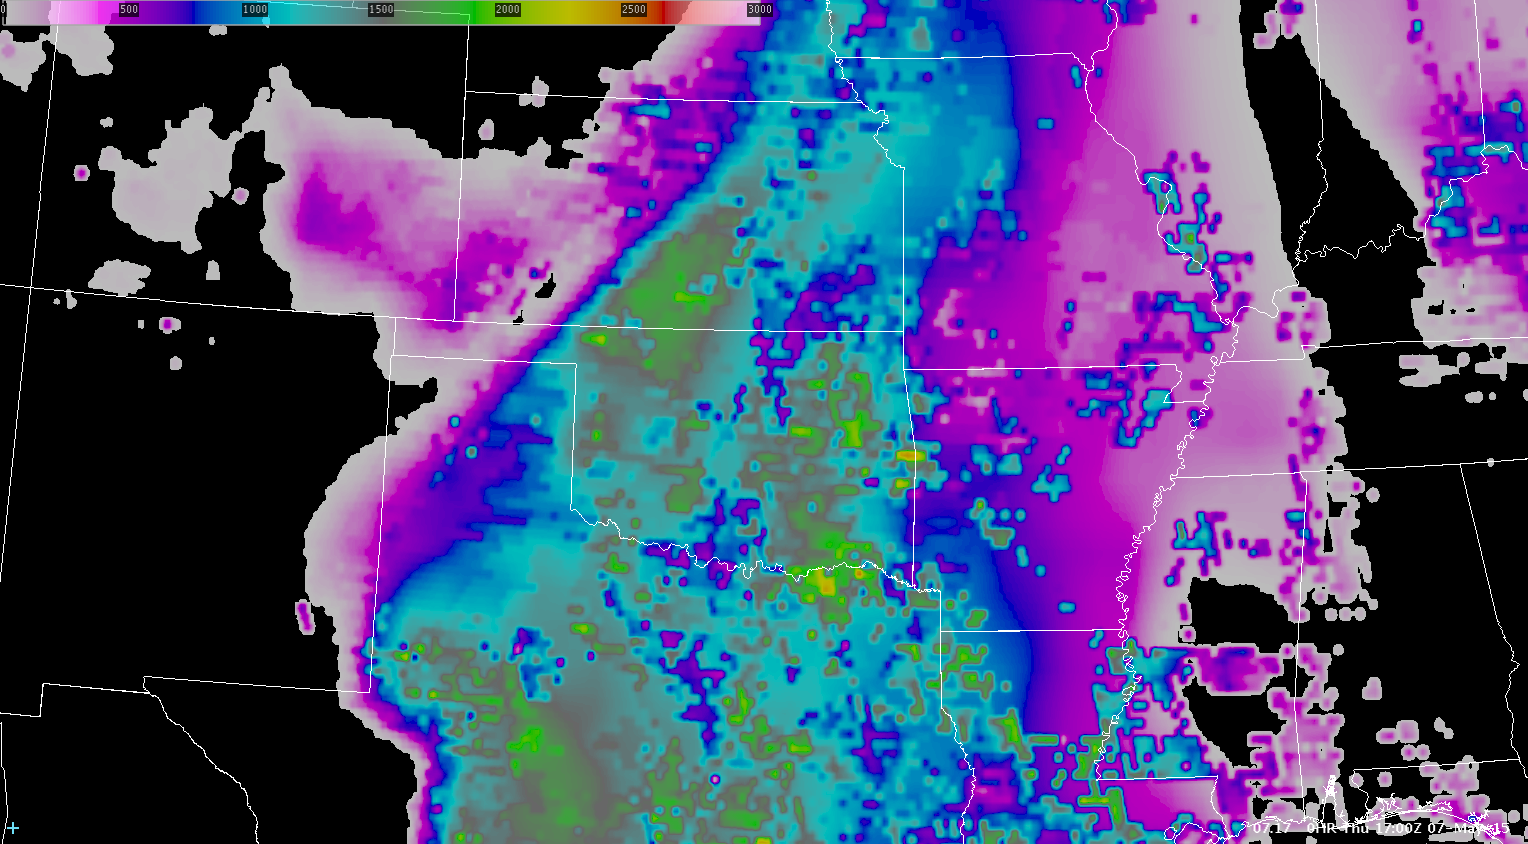 Comparing the GOES-R CAPE to the SPC mesoanalysis mixed layer CAPE it appears the values are too low, especially in the Red River area where values close to 2000 J/kg were noted.
 The continued moist southeasterly flow into the region today south of the ongoing convection should interact with outflow boundary from ongoing convection and initiate new convection across the southern portion of the forecast area.
Jack Bauer


 -SRF
-SRF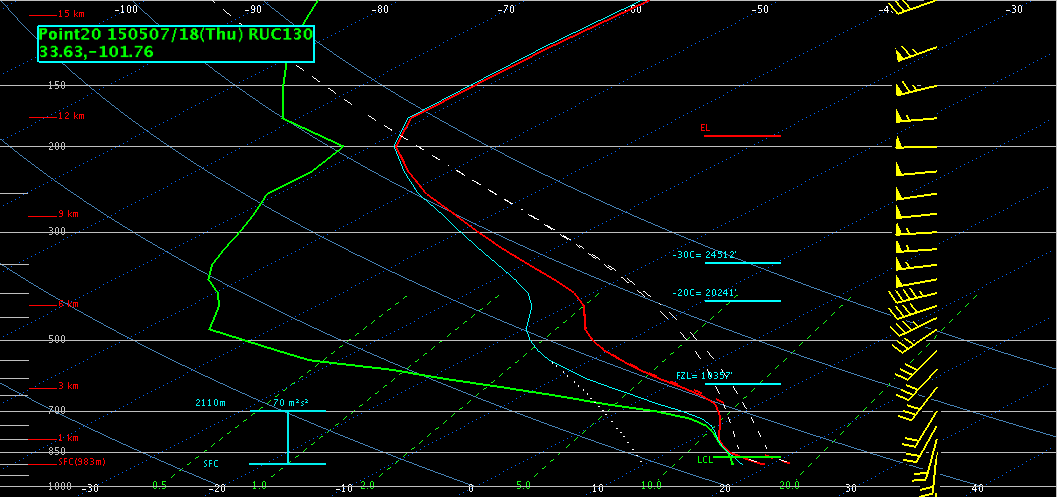

 -SRF
-SRF