LAPS CAPE Forecasts and Radar Observations…

The following imagery are taken from the 21 UTC forecast run of the 1 km LAPS model and are overlaid with KTLX 0.5 reflectivity imagery.  At the first image below, valid at 21 UTC, or the model initialization time, you can see the ribbon of high CAPE values, exceeding 4-5000 J/KG is some areas, stretching from SW-NE across portions of north Texas and central Oklahoma.  The radar imagery initially are valid at 2116 UTC.  Notice the large supercell over the Red River in Clay and Jefferson Counties.  The LAPS CAPE values can serve as a proxy of sorts for the resulting reduction of CAPE in association with the outflow from this storm.  In subsequent imagery, the outlow (or relatively low CAPE field) can be seen to migrate quickly northward.  In image 2, the wind at KPJV is observed to shift from the south, as the outflow boundary crossed the area.  The timing matched the LAPS forecast values quite well.  Later, in images 3 and 4, as the outflow boundary intersected an area of higher CAPE in the OK City metro, a small storm suddenly develops.  The timing of the propagating outflow boundary was handled very well by the LAPS model in this particular case.

Image 1.  LAPS CAPE values (K) at 2115 UTC, overlaid with KLTX 0.5 degree reflectivity. Observations included.
Image 1. LAPS CAPE values (K) at 2115 UTC, overlaid with KLTX 0.5 degree reflectivity. Observations included.
Image 2.
Image 2.  LAPS CAPE values (K) at 2300 UTC, overlaid with KLTX 0.5 degree reflectivity.  Observations included.
Image 3.  LAPS CAPE values (K) at 2345 UTC, overlaid with KLTX 0.5 degree reflectivity. Observations included.
Image 3. LAPS CAPE values (K) at 2345 UTC, overlaid with KLTX 0.5 degree reflectivity. Observations included.  Notice the small cell that has developed over the OKC metro.
Image 4.  LAPS CAPE values (K) at 0000 UTC, overlaid with KLTX 0.5 degree reflectivity. Observations included.
Image 4. LAPS CAPE values (K) at 0000 UTC, overlaid with KLTX 0.5 degree reflectivity. Observations included.

Too bad we couldn’t show a loop of the imagery, because the LAPS’ handling of the outflow from the convection was rather stunning.

Tags: None

LAPS Observations and Determining Future Storm Development…

Just a quick post about observations of the LAPS theta-e field this afternoon. It was interesting to see the near stationary aspect of the theta-e boundary in assoc/w the dryline to our south across portions of north Texas this afternoon. This suggests that continued development is possible late this afternoon especially across northern Texas, where the gradients have been sustained and have even increased lately.  However, notice that the gradients have decreased generally across much of Oklahoma where convection and related effects (rain cooled air, cloud shield) have helped to stabilize the environment.

Image 1.  LAPS 2115 UTC analysis.  Shaded values are sfc theta-e, while wind vectors are in blue.
Image 1. LAPS 2115 UTC analysis. Shaded values are sfc theta-e (K), while wind vectors are in blue.
Image 1. LAPS 2130 UTC analysis. Shaded values are sfc theta-e (K), while wind vectors are in blue.


Image 1. LAPS 2115 UTC analysis. Shaded values are sfc theta-e (K), while wind vectors are in blue.
Image 1. LAPS 2145 UTC analysis. Shaded values are sfc theta-e (K), while wind vectors are in blue.
Image 1. LAPS 2115 UTC analysis. Shaded values are sfc theta-e (K), while wind vectors are in blue.
Image 1. LAPS 2200 UTC analysis. Shaded values are sfc theta-e (K), while wind vectors are in blue.
Image 1. LAPS 2115 UTC analysis. Shaded values are sfc theta-e (K), while wind vectors are in blue.
Image 1. LAPS 2215 UTC analysis. Shaded values are sfc theta-e (K), while wind vectors are in blue.

The 15-minute temporal resolution of the product can be very useful for diagnosing locations of continued convection especially in rapidly developing convective situations.

Tags: None

May 20 2013 Early Afternoon Discussion – Focus OK

Sct TS development over south central OK as of 19z. Tor watch issued for most of eastern OK to account for expected development this afternoon. Latest obs indicate cold front draped over central OK with dry line extending back into SW OK with upper level low over Dakotas. Strong southerly flow over eastern OK pushing dew pts well into the 70s as of mid day, with sharp contrast west of dry line, with dew pts remaining in the 50s over the pan handle of OK. MU CAPE over eastern OK around 4000 j/kg already and blk shear around 75 kts. 17z OUN sounding shows deep low level moisture with capping around 850mb, which should weaken within the next couple of hours. 16z OUN WRF indicates development to close proximity with on going convection attm, with further super cell development this afternoon as the current cells push east and north into the more unstable atmo.

1kmRefl_F00230

1kmRefl_F00330 1kmRefl_F00515


Tags: None

EWP2013 Week 1 Summary: 6 – 10 May 2013

EWP2013 PROJECT OVERVIEW:

The National Oceanic and Atmospheric Administration (NOAA) Hazardous Weather Testbed (HWT) in Norman, Oklahoma, is a joint project of the National Weather Service (NWS) and the National Severe Storms Laboratory (NSSL).  The HWT provides a conceptual framework and a physical space to foster collaboration between research and operations to test and evaluate emerging technologies and science for NWS operations.  The Experimental Warning Program (EWP) at the HWT is hosting the 2013 Spring Program (EWP2013).  This is the sixth year for EWP activities in the testbed.  EWP2013 takes place across three weeks (Monday – Friday), from 6 May through 24 May.

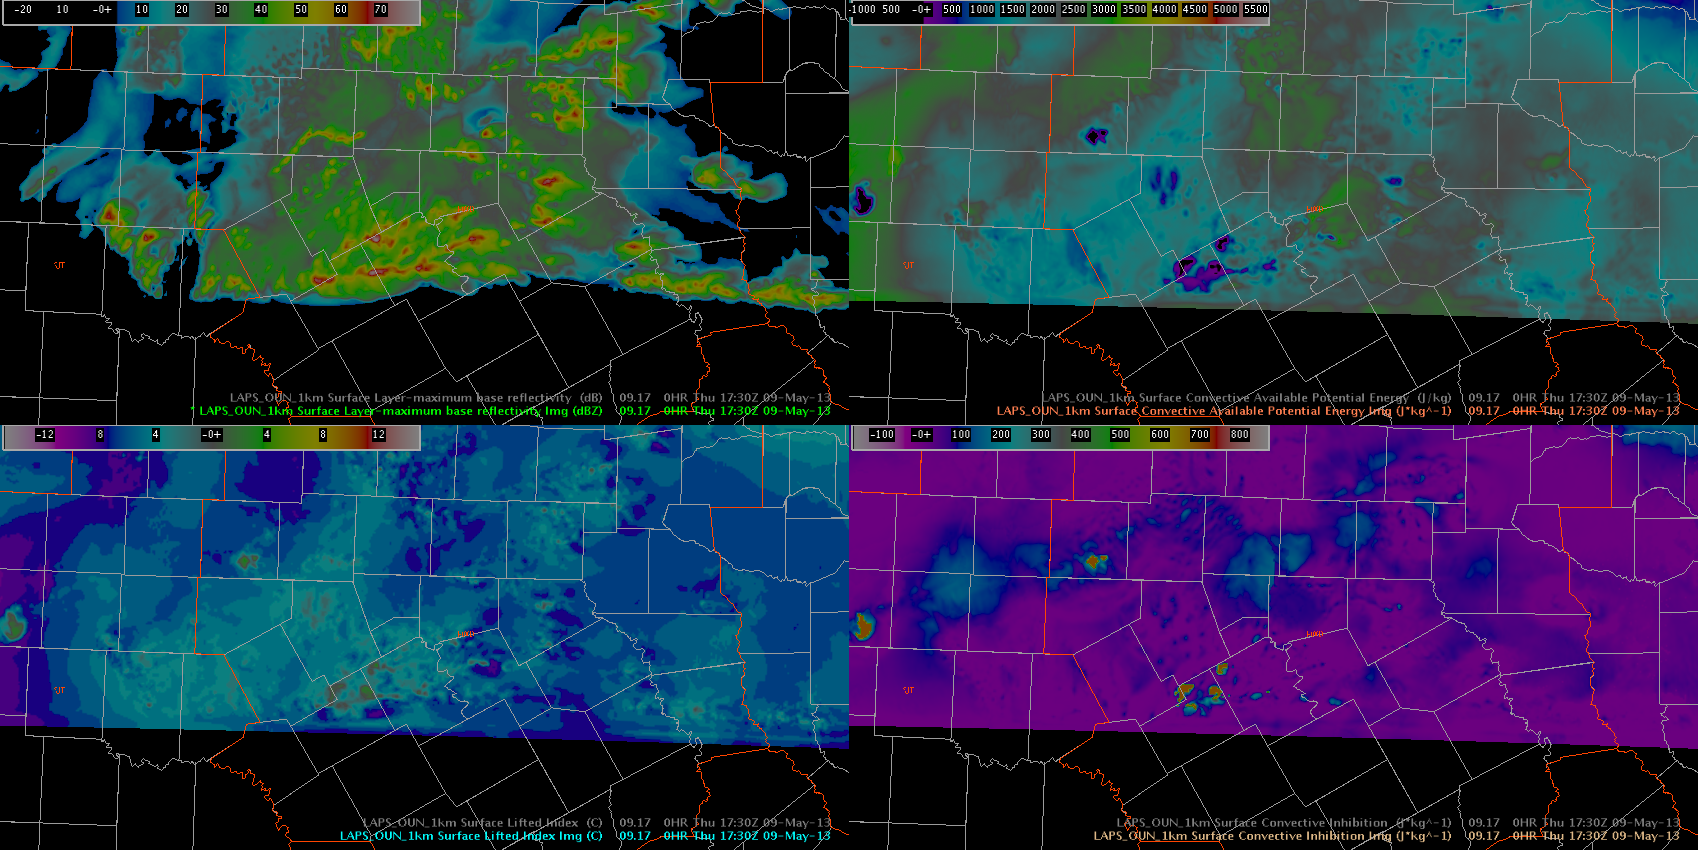
EWP2013 is designed to test and evaluate new applications, techniques, and products to support Weather Forecast Office (WFO) severe convective weather warning operations.  There will be three primary projects geared toward WFO applications this spring, 1) evaluation of multiple CONUS GOES-R convective applications, including pseudo-geostationary lightning mapper products when operations are expected within the Lightning Mapping Array domains (OK/west-TX, AL, DC, FL), 2) evaluation of model performance and forecast utility of the OUN WRF when operations are expected in the Southern Plains, and 3) evaluation of model performance and forecast utility of the 1-km and 3-km WRF initialized with LAPS.

PARTICIPANTS:

We had six visiting NWS forecasters this week: Marc Austin (WFO, Norman, OK), Hayden Frank (WFO, Boston, MA), Jonathan Guseman (WFO, Lubbock, TX), Nick Hamphsire (WFO, Fort Worth, TX), Andrew Hatzos (WFO, Wilmington, OH), and Jonathan Kurtz (WFO, Norman, OK).  The GOES-R program office, the NOAA Global Systems Divisions (GSD), and NWS WFO Huntsville’s Applications Integration Meteorologist (AIM) Program have generously provided travel stipends for our participants from NWS forecast offices nationwide.

Visiting scientists this week included Lee Cronce (Univ. Wisconsin), Geoffrey Stano (NASA-SPoRT), Isidora Jankov (NOAA/GSD), and Amanda Terberg (NWS Air Weather Center GOES-R Liaison).

Gabe Garfield was the weekly coordinator.  Clark Payne (WDTB) was the “Tales from the Testbed” Webinar facilitator. Our support team also included Darrel Kingfield, Kristin Calhoun, Travis Smith, Chris Karstens, Greg Stumpf, Kiel Ortega, Karen Cooper, Lans Rothfusz, Aaron Anderson, and David Andra.

ewp2013_week1_photo_inset

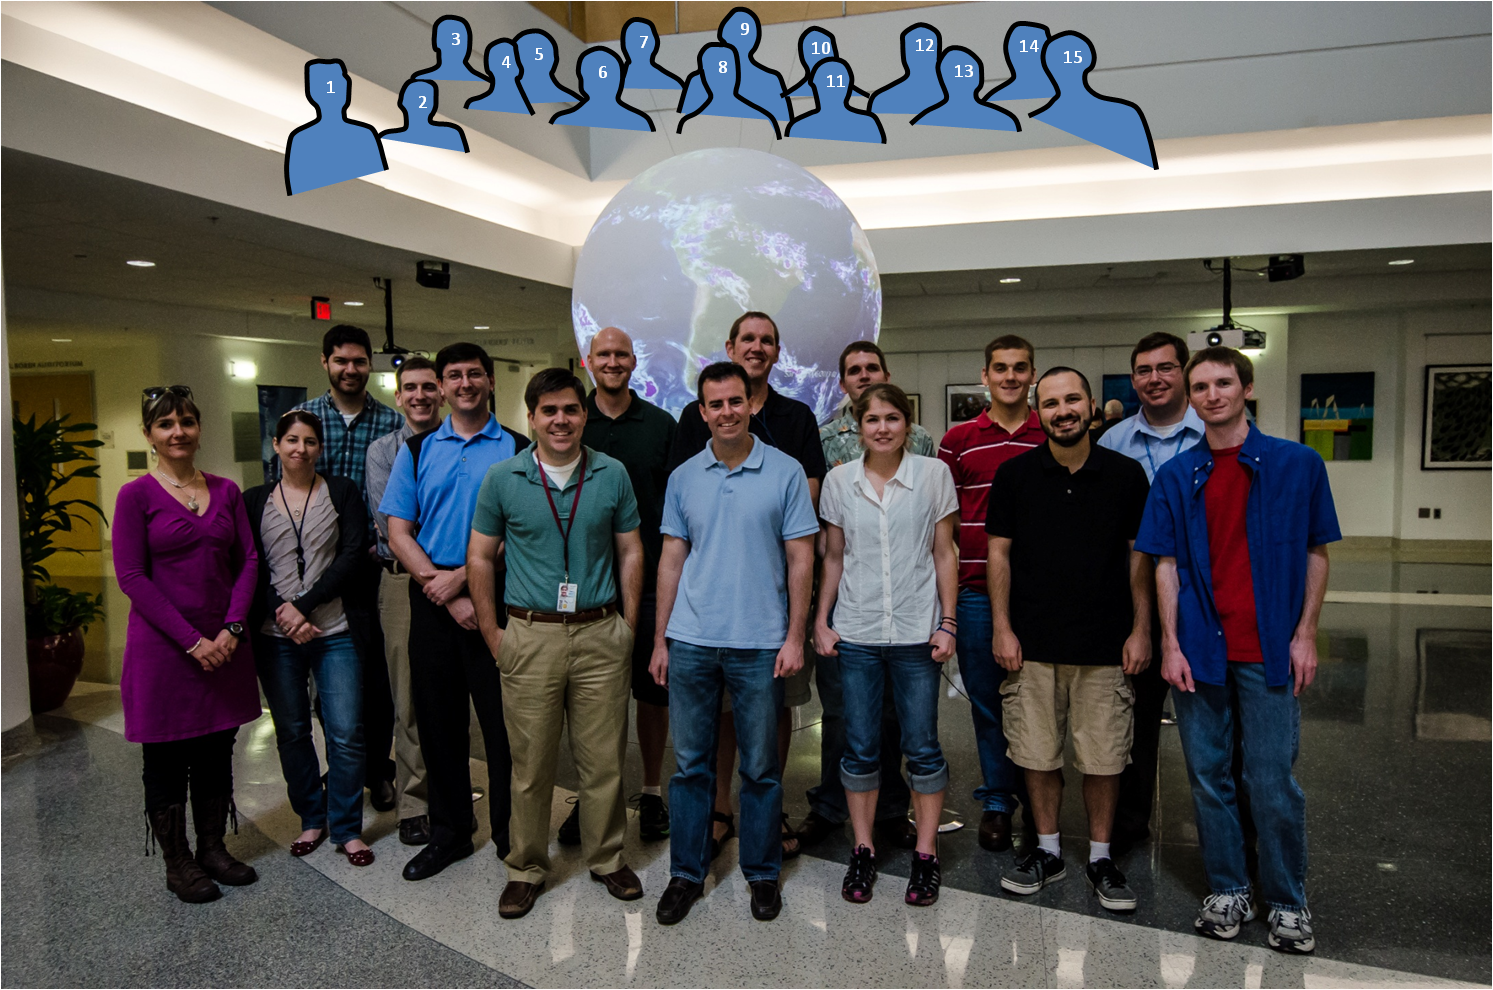
Experimental Warning Program Week #1 group photo. 1) Isidore Jankov (NOAA/ESRL/GSD), 2) Kristin Calhoun (CIMMS/NSSL), 3) Gabe Garfield (CIMMS/NWS/WFO/OUN), 4) Darrel Kingfield (CIMMS/NSSL), 5) Geoffrey Stano (NASA/SPoRT), 6) Nick Hampshire (NWS/WFO/Fort Worth, TX), 7) Lee Cronce (U. Wisc/CIMSS), 8 ) Hayden Frank (NWS/WFO/Boston, MA), 9) Greg Stumpf (CIMMS/NWS-MDL), 10) Marc Austin (NWS/WFO/Norman, OK), 11) Amanda Terborg (U. Wisc./CIMSS), 12) Jonathan Guseman (NWS/WFO/Lubbock, TX), 13) Kiel Ortega (CIMMS/NSSL), 14) Jonathan Kurtz (NWS/WFO/Norman, OK), and 15) Andy Hatzos (NWS/WFO/Wilmington, OH).

REAL-TIME EVENT OVERVIEW:

6 May: Blacksburg (RNK), Raleigh (RAH), and Lubbock (LUB):  Marginally severe storms with hail and wind.

7 May: Goodland (GLD), Dodge City (DDC), and Lubbock (LUB):  Severe storms in KS with large to very large hail; marginally severe storms in the Texas Panhandle.

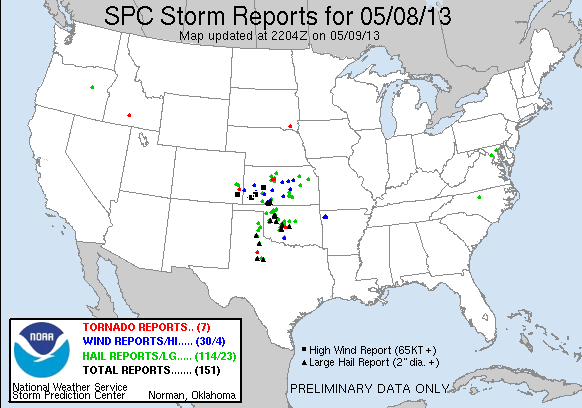
8 May: Norman (OUN), Lubbock (LUB), and Dodge City (DDC):  Widespread severe weather outbreak with hail and wind.

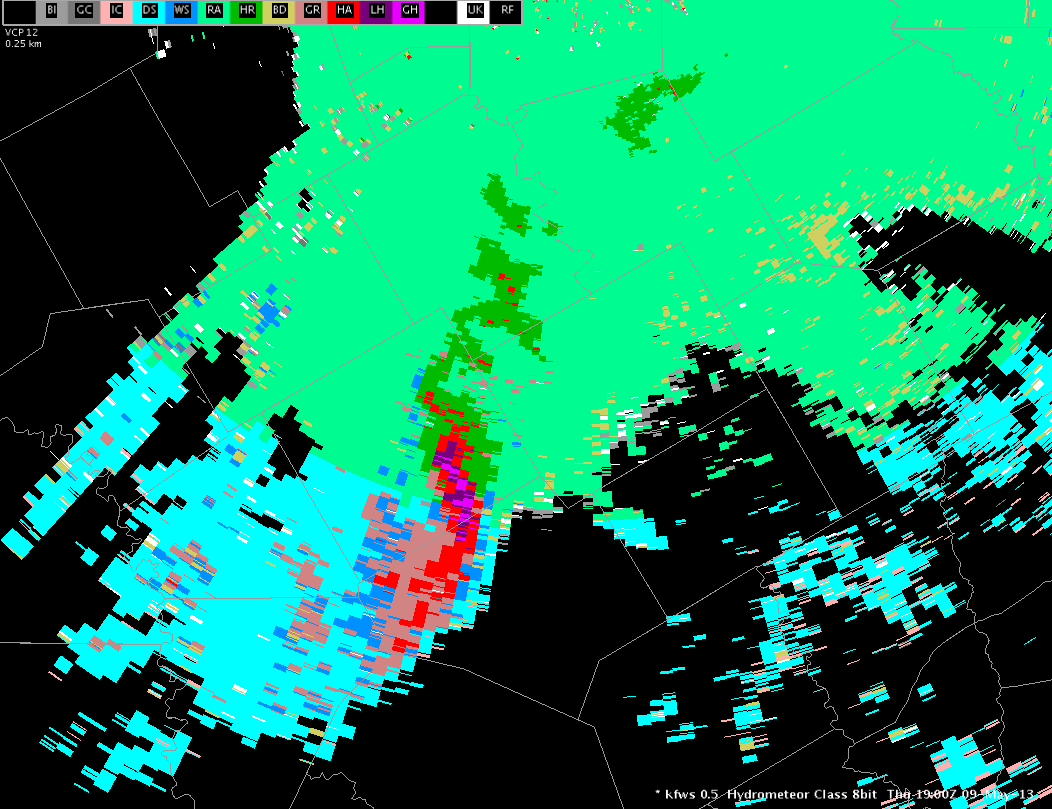
9 May: Fort Worth (FWD), San Angelo (SJT), and Lubbock (LUB):  Supercells with large to very large hail and severe winds.

FEEDBACK ON EXPERIMENTAL PRODUCTS:

HSDA:

  • Giant hail detections are too generous.  Seems to be indicating giant hail when many reports are below 2”.
  • The algorithm is good at detecting hail, but the area is too large.
  • When using FSI to cut vertical cross-sections, the change to all red (any size hail) above melting layer was particularly noted.

MRMS:

  • MESH underestimated hail size in colder core low on Monday; the algorithm did much better on Thursday.
  • MESH and other hail diagnosis indicators underestimate hail size for left splits.
  • Recommend adding a radial shear product, to help detect mid-altitude radial convergence (MARC) signatures.
  • Has the greatest value in identifying hail threats; however, tornadoes will still always require examination of base data.

OUN WRF:

  • Recommend a new convective initiation product that displays the probability of convection.
  • Recommend a surface convergence product to monitor CI (there is a Severe Local Storms conference preprint by a Fort Worth WFO author).
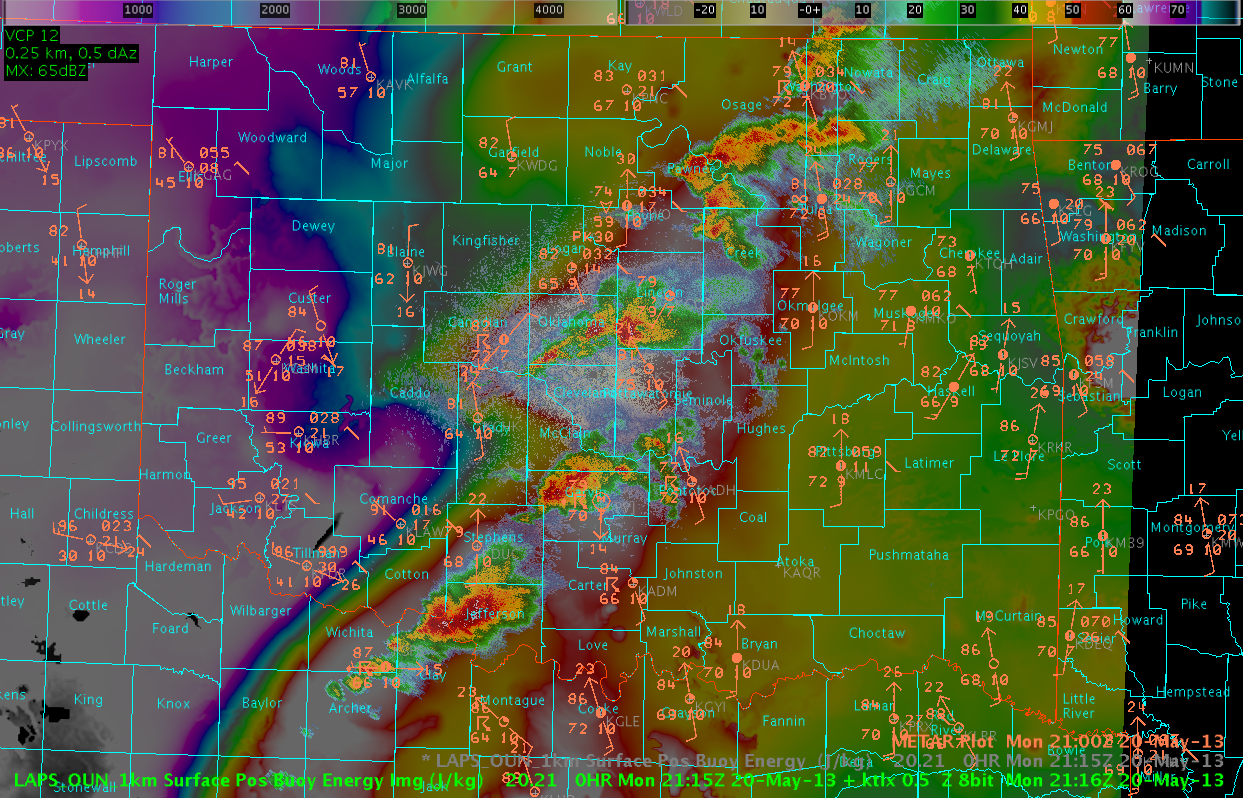
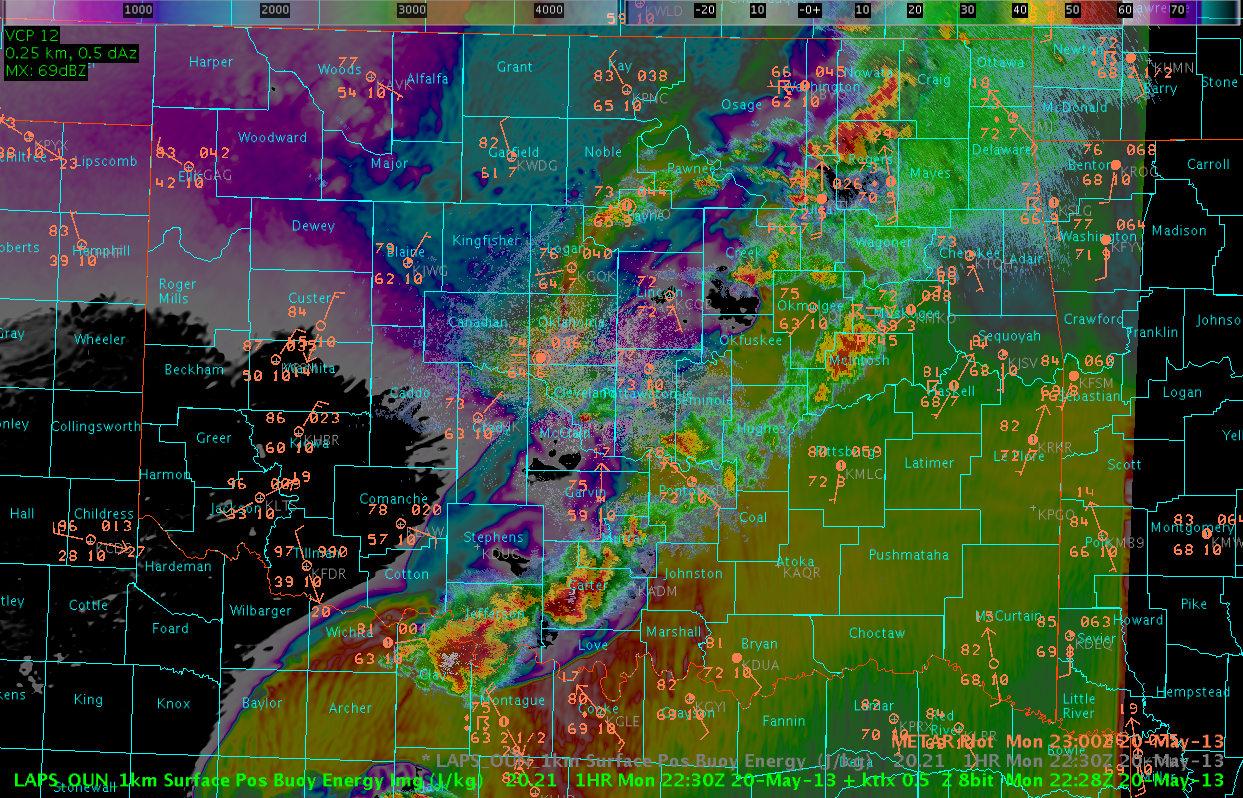
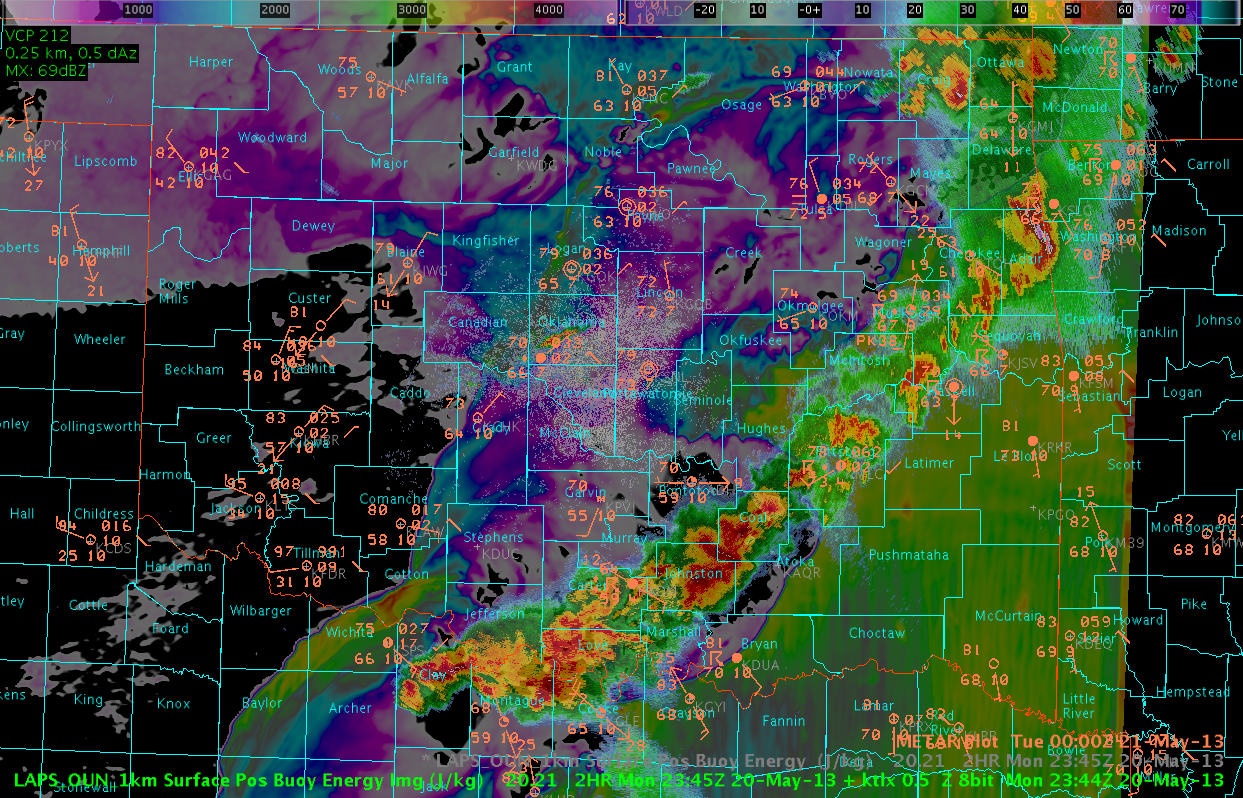
Variational LAPS:

  • Some WFOs deliver an enhanced short term forecast every 3 hours, and variational LAPS would be useful.

GOES-R UAH SatCast/UW Cloud-Top Cooling:

  • The UAH CI product was found to be “too noisy”
  • Would like to change color curve to filter out UAH CI Strength of Signal values below 50% (or some other threshold).

GOES-R PLGM and Lightning Trend Tool:

  • Recommend adding capability to use trending tool in four panels.  Right now, it only works in a single panel.

OVERALL COMMENTS:

  • Suggest that the PIs sit with forecasters to write procedures on the first part of the first day of operations.
  • All the products are useful and valuable; each forecaster will find their own ways to implement.
  • Need to work with WDTB to determine an optimal way to attract forecasters to the new products so that they do not immediately default to their “comfort zones” of base products.  Perhaps having an assistant forecaster or HMT monitor the new products side-by-side with the warning forecaster.
  • Suggests starting week by incorporating experimental products and concluding week with just experimental products.  However, many weeks won’t have quality storms each day.
  • New product evaluation would probably not be helpful in a “canned case” – need real-time evaluation.
  • Time allotted for surveys was adequate.
  • Training was sufficient to prepare for week’s activities.

CONTRIBUTORS:

Gabe Garfield, EWP 2013 Week #1 Weekly Coordinator

Greg Stumpf, EWP 2013 Week #1 Back-up Coordinator

Tags: None

Daily Summary: 9 May 2013

On Thursday, operations began at noon in the Development Lab, with storms ongoing in the Southern Plains.  After the daily debriefing and forecast discussion, we moved to the Hazardous Weather Testbed.  Around 1 p.m., the Experimental Forecast Program provided an in-depth weather briefing.  This discussion confirmed our decision to operate in the Fort Worth and San Angelo County Warning Areas.

The San Angelo desk consisted of Andrew Hatzos and Jonathan Buseman; the Fort Worth office of Hayden Frank and Marc Austin; and the Mesoscale Desk of Jon Kurtz and Nick Hampshire.  Multiple clusters of thunderstorms were already present, including supercellls.    With time, it became apparent that the storms in the Norman CWA would allow for an examination of the PGLM data.  Thus, the Fort Worth office was shifted to become the Norman office.  Not long after this, storms began to develop in the Lubbock CWA, which gave us another opportunity to examine PGLM data.  Thus, we decided to send the Mesoscale Desk to Lubbock to cover this activity.

After operations concluded, the forecasters completed the daily surveys.  Clark Payne (WDTB) arrived around 7 p.m. to help the forecasters complete the Friday webinar.

 -G. Garfield, Week 1 Coordinator

Tags: None

PGLM Flash Extent Density in Linear Convection

The PGLM flash extent density product was useful at picking out areas of more severe convection in a linear storm segment. While the lightning “jumps” were not all that impressive (~20 to 30 flashes/min), they were still significant enough in conjunction with MESH near an inch to issue a warning. This is evident in the four panel image below which shows FED, Comp Reflectivity and MESH.pglmline

Austin/Frank

Tags: None

Daily Summary: 8 May 2013

stormreports_0508

On Wednesday, we began operations in the Development Lab.  After a short debrief of the previous day’s events, we discussed the Day 1 forecast.  We agreed that the Norman and Dodge City County Warning Areas were most likely to receive severe weather.   Before we decided where to operate, though, we asked Jimmy Correia (SPC) to give a forecast briefing for the Experimental Forecasting Program.  From his briefing, it became apparent that convection was most likely to develop in the Norman CWA first.  So, it was decided to operate there initially.

Our forecasters were divided into three teams: two warning teams and one mesoscale team.  The North warning team consisted of Hayden Frank and Jonathan Buseman; they covered the warnings in north of I-40 in Norman’s CWA.   The South warning team consisted of Marc Austin and Nick Hampshire; they covered the warnings in Lubbock’s CWA, then the southern half of Norman’s CWA.  Andrew Hatzos and Jonathan Kurtz filled the Mesoscale Desk.  We kept these teams throughout the afternoon and into the early evening.  Around 5 p.m., though, it became apparent that Dodge City’s CWA was likely to see severe weather.  For this reason, Jonathan Kurtz was moved to the DDC Warning Desk.

A squall line developed just west of the National Weather Center toward late evening, which gave us an opportunity to observe the weather for which we were forecasting.  The Norman mesonet registered a 40 mile wind gust, and we observed blowing dust from the observation deck of the National Weather Service.  After issuing almost 40 warnings, the EWP crew finished operations.

-G. Garfield, Week 1 Coordinator


Tags: None

Monitoring CTC for Possible Storm Initiation Further West than Expected

The image below shows several intense (less than -20 C per 15 min) signals over West Texas in Lubbock’s area. This is a bit of a surprise as most activity was expected to develop farther east. With somewhat limited moisture, we will monitor this area for possible high based severe thunderstorms. If these storms do develop and head east into better low level moisture, they may pose a severe risk across southwest Oklahoma or western north Texas later today.Cooling clouds tops LBB050913

**Updated at 2305 UTC**

As was advertised by the CTC product nearly two hours in advance, marginally severe high based storms developed over the Texas Panhandle in AMA’s area. This lead time was likely due to the relatively dry environment, which was not conducive to rapidly developing severe storms.

Austin/Frank

Tags: None

HSDA and MESH Verified by Large Hail Report

HSDA and MESH were both verified with a golf ball hail report in the FWD CWA. The image below shows a capture of the HSDA showing giant hail in the region where the report came from. MESH also showed around 1.5 inch hail at the time. Though it was a bit underdone, the utility of MESH stands.HC on Golfball hail at FTW

Austin/Frank

Tags: None

WRF Domain Generating False Environmental Boundary

The OUNWRF does fairly well when storms are within the domain, however, as we are situated in FWD’s CWA today, it appears that the southern domain boundary has a significant impact on convection. The images below are of the 1 KM Lapse, which is extrapolated in time with the WRF. The first image shows a clear delineation of the southernmost boundary. The second image, only 15 minutes later, shows deep convection developing along a phony boundary generated by the southern limit of the domain. This obviously wouldn’t be a problem in the 2.5 km products, but would more likely be an issue for the OUNWRF domain if operating in north Texas.

Image 11kmLapse_boundary1

Image 21kmLapse_boundary2

Tags: None