My First Go at the Tracking Meteogram Tool

Well… unfortunately, my first crack at this tool has not gone well. When I initially pulled up the tool, it looked fine but then at some point, I had closed the Tracking Meteogram tab and could not figure out a way to pull it back up without reloading it all over again. I consulted with folks and we could not figure out how to bring a closed tab back up. It is unfortunate because I had already created a track and my points so I had to redo it.

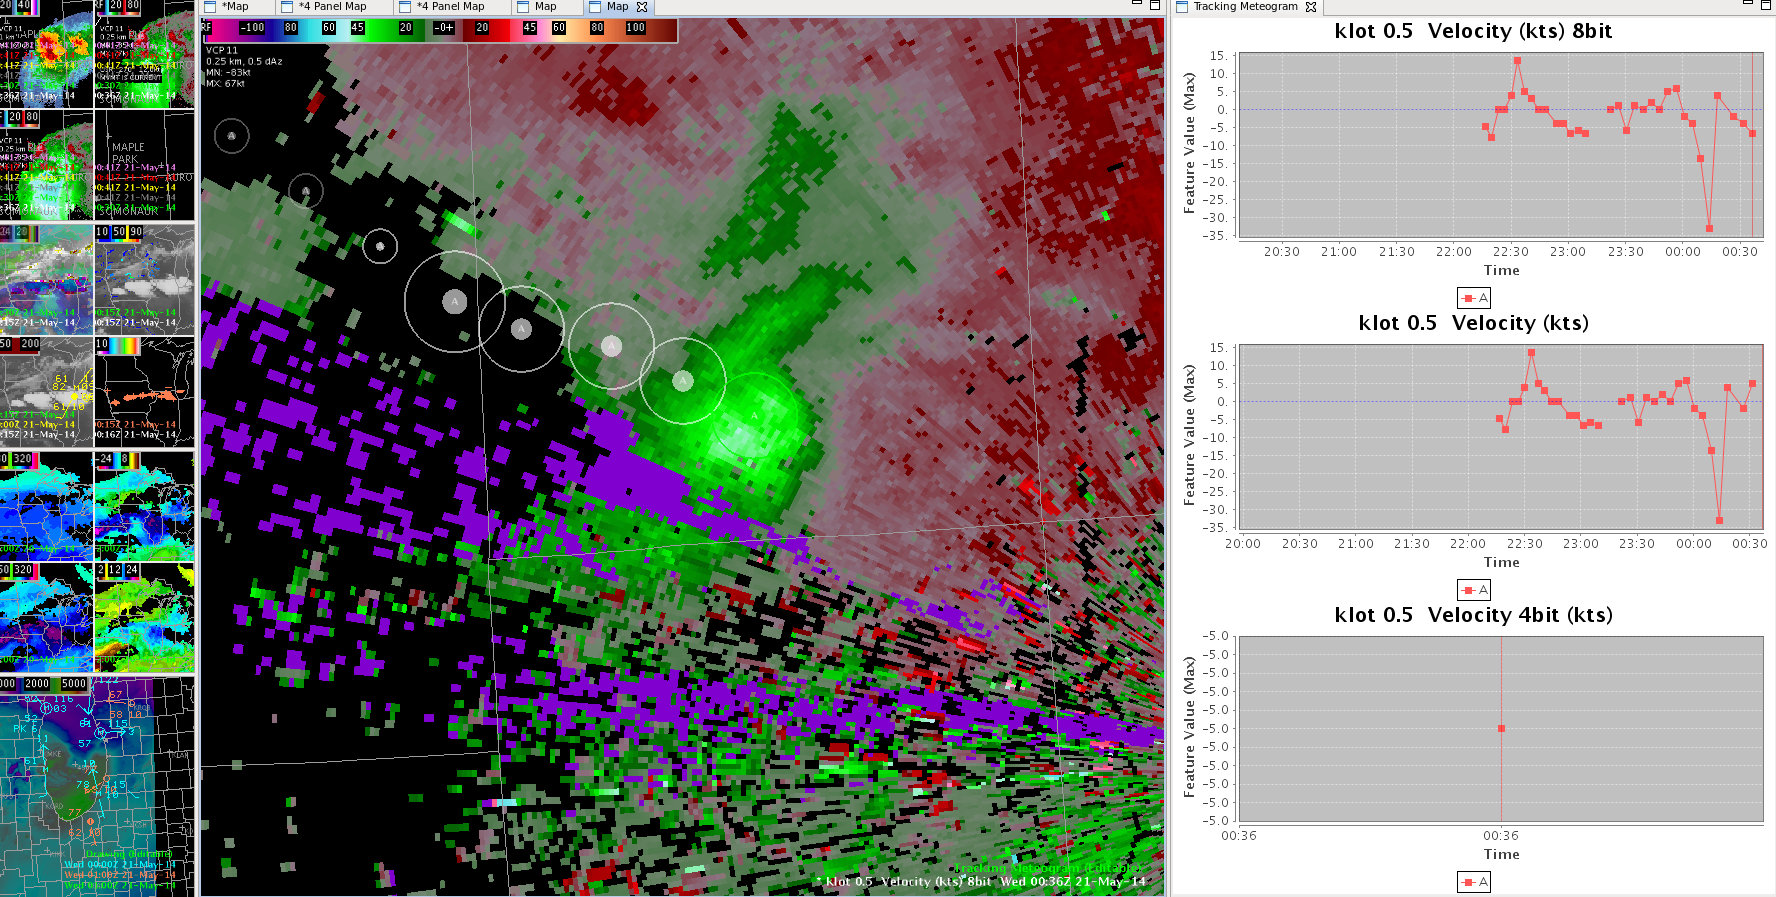
Another problem I ran into was when the tab was opened, the meteogram would sporadically go blank/missing. Additionally, I received constant red banners that said An internal error occurred during: “Loading Tracking Meteogram.,” whether the meteogram was visible or missing. Lastly, I was testing the meteogram with KDVN 0.5 Z/V products and the Z meteogram did not line up temporally with V. Every time a new radar scan would come in, the V meteogram would update with the latest scan but the Z meteogram increased in the amount of points on the x-axis without accurately or correctly updating the time (x-axis)/max reflectivity value (y-axis).

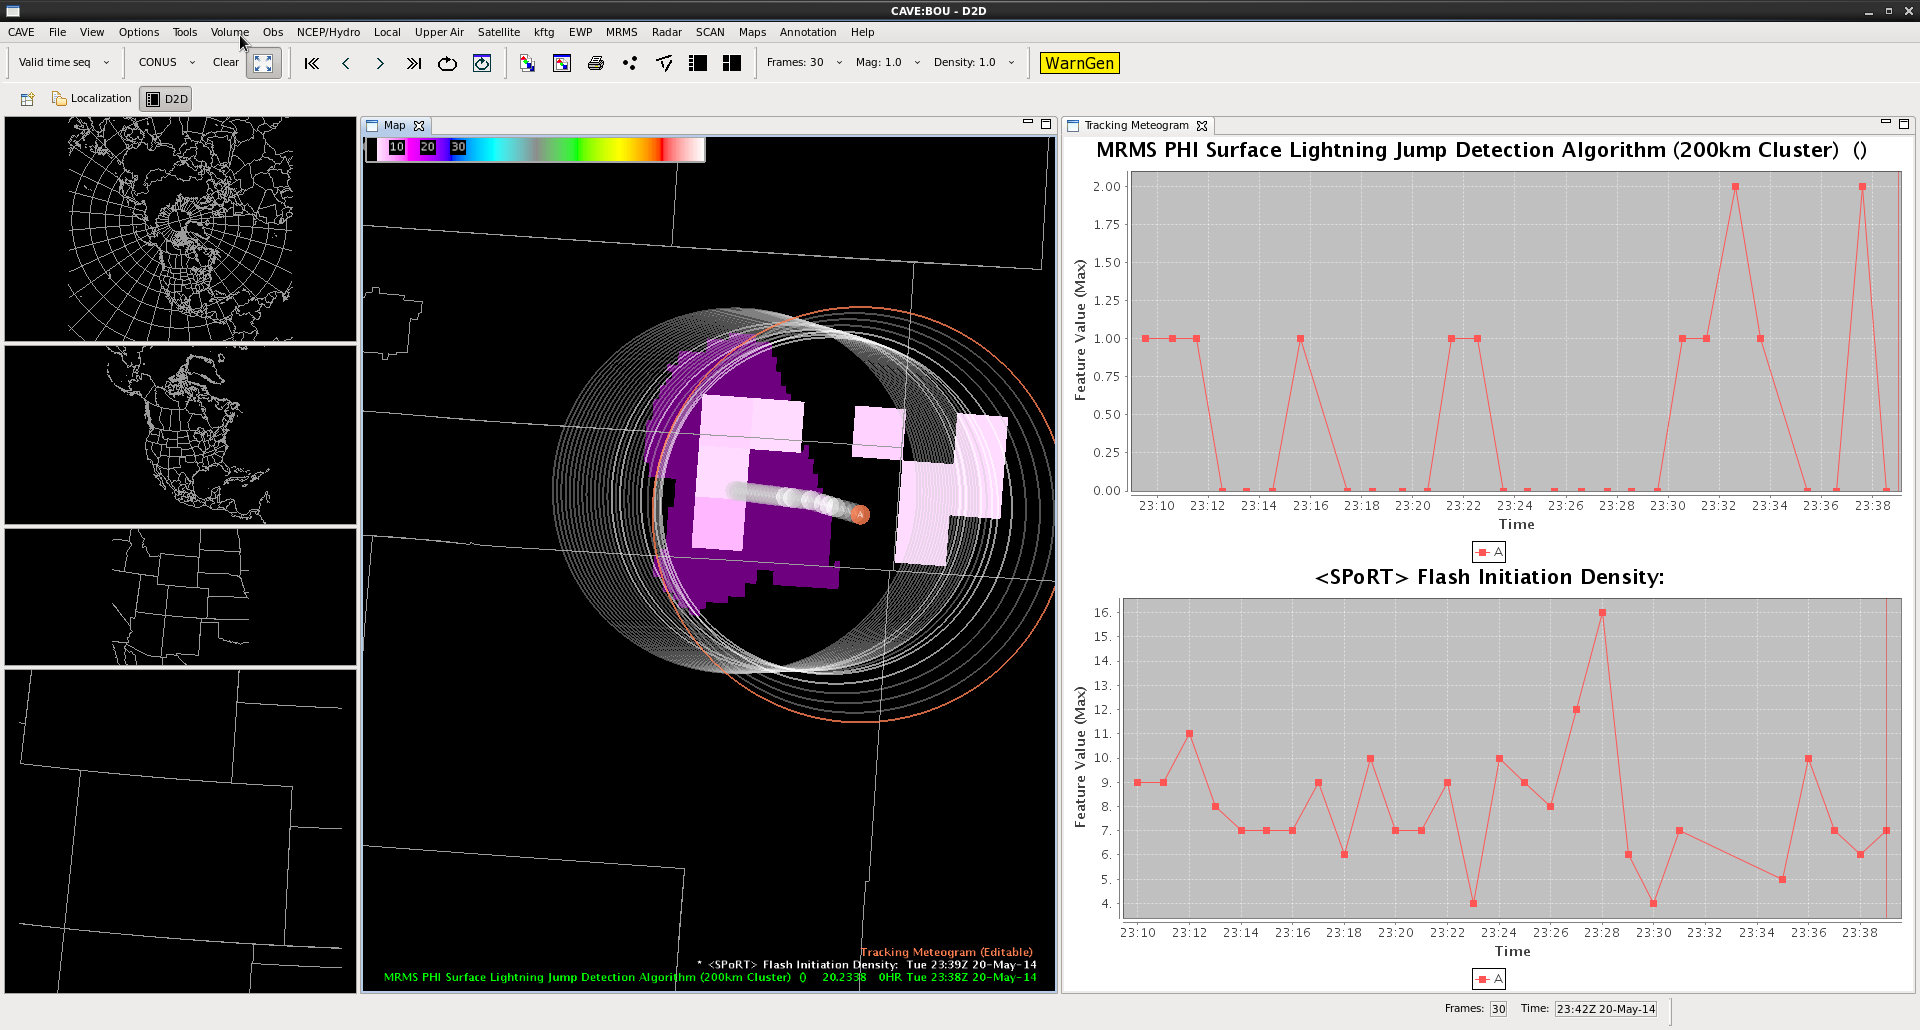
I do like the ability to move individual points (instead of the entire line like with similar tracking tools in AWIPS-I) and it was interesting to be able to increase/decrease the circle size to capture certain storm features. I also like the capability that it has to offer to be able to see trends laid out in graph form for a particular product or set of products.

2303Z-0018Z_TrackTool

0023Z_incorrect_time_cropped

~Linda

Tags: None

Three Meteogram Boxes One Product

I loaded the the base velocity product and then the meteogram program and it seemed to work well initially, but as the radar product updated the meteorgram split into two boxes, one for 8 bit and one that just indicated velocity. It later added a 3rd box that included 4-bit after the screen updated again.

-JB

meteogram_interesting

Tags: None

Reasons for the slow warns.

May 21st 0021Z

Just wanted to add that on some of these storms I have been a little slower on the draw to warn. This is due to examining other new products such as LAPs CAPE and composite reflectivity MESH, while also participating in a round table discussion with some extra students on why and how they impact the mesoscale forecast, how newer dual pol products interact with the old legacy products, and examining the new prob of severe function that surrounds these storms.

MESH seems to be doing excellent here. However MESH and Prob of SVR do not capture  information of the latest lowest scan because the volume is not complete yet. It is important to use Prob of Svr as a trend tool and seeing a quick graph of Prob of Svr rising would be very helpful.  (Again a tie in to SCAN for ease of graphing would be wonderful. )

Grant H.


Tags: None

Same Storm Different Lightning Jump

jump_delay_2310_2338UTC

A secondary lightning jump occurs at 23:28 UTC with the same storm east of Denver Co. The lightning jump here reached the 2 sigma level when the total flash rate increased from 8 flashes per minute to 16 flashes per minute in the span of two minutes. This reinforcing lightning jump indicates that the storm’s updraft was still undergoing periods of intensification.  Baseball size hail was being reported at the time of the jump, and ping pong ball size hail was reported at 23:35 UTC in association with this storm.  Hail was reported as deep as 3 inches on the ground.

*There appears to be a delay between the jump occurrence in the Flash Initiation Density (23:28 UTC) and the LJA sigma plot (23:33 UTC).

vLAPS Surface CAPE

I loaded the surfaced based CAPE product from the vLAPS and below is the 1-hr forecast. The interesting area is over lake MI where the water temperature is still very cold, generally in the 40s F, and the model is indicating SBCAPE values of 1500-2500 j/kg over the central and southern area of the lake. This seems to be overdone given the very cold surface temperatures.

-JB

strange_cape_20_2330

Tags: None

Simulated Satellite Imagery Very Useful Today

Simulated Satellite verse Current MRMS and IR Satellite

I decided to look back at the NSSL-WRF Simulated Satellite Imagery (top left) and it is pretty close to the actual IR satellite (top right).  You can also see the MRMS radar (bottom left) that it had the idea of a cluster of storms breaking out in central Iowa to N. Illinois.  The only issue I would say is it may have been slightly slower (30 min-1hr) with initializing the convection.  Other than that it has it timed pretty well after. I like it! ~Vollmar

Tags: None

Overshoot-Top Product

over_shooting_top_20_2337

Visible satellite imagery indicates a few overshooting tops associated with the convection from central IL back west into central IA. The over-shooting top product did highlight the region over northern IL (where currently a golf ball size hail report was just received) but the ones to the west were not highlighted. The ones to the west must not have been large enough of an over-shooting top to trip the algorithm. Since the one indicated did product the big hail it tends to add confidence to use of the product.

-JB

Tags: None

EWP Operations Update – Tuesday 5/20 – 6:20pm

We moved our CYS team to the Chicago, IL (LOT) CWA as the convection in the CYS region wasn’t providing many severe reports. Our forecasters are deep into warning operations now, using GOES-R CI, ProbSevere, NearCast, MR/MS, and base data to interrogate and gauge storm severity. I feel like we may be going through Super-Rapid scan withdrawals though. 🙁

MR/MS Reflectivity at Lowest Altitude product - 2206z - 2346z.
MR/MS Reflectivity at Lowest Altitude product – 2206z – 2346z.

-Darrel Kingfield
EWP Week 3 Coordinator

Tags: None

Another vLAPs.

May20th 2346Z

Just another view of LAPs CAPE field here. Lake County appears to have its cell simulated by LAPs during the actual storm time. While the storm over Ogle county did not show up in the CAPE field. HOWEVER… I would like to note that LAPs did initiate with a very high CAPE maxima of almost 3000 J/kg in this area. Perhaps there was slightly stronger cap aloft in this simulation than what occurred in reality.

Grant H.

Tags: None

Simulated IR/WV Verifying Well

Building on the previous post the simulated IR/WV imagery did very well capturing the orientation/timing of the convection later in the day across eastern IA and into northern IL. In reality it did under-forecast the degree of convection over western IA.

-JB

simulated_wv_ir_20_00

Tags: None