EWP2012 Week 2 Summary: 14-18 May 2012

EWP2012 PROJECT OVERVIEW:

The National Oceanic and Atmospheric Administration (NOAA) Hazardous Weather Testbed (HWT) in Norman, Oklahoma, is a joint project of the National Weather Service (NWS) and the National Severe Storms Laboratory (NSSL).  The HWT provides a conceptual framework and a physical space to foster collaboration between research and operations to test and evaluate emerging technologies and science for NWS operations.  The Experimental Warning Program (EWP) at the HWT is hosting the 2012 Spring Program (EWP2012).  This is the fifth year for EWP activities in the testbed.  EWP2012 takes place across five weeks (Monday – Friday), from 7 May through 15 June.  There are no operations during Memorial Day week (28 May – 1 June).

EWP2012 is designed to test and evaluate new applications, techniques, and products to support Weather Forecast Office (WFO) severe convective weather warning operations.  There will be three primary projects geared toward WFO applications this spring, 1) evaluation of 3DVAR multi-radar real-time data assimilation fields being developed for the Warn-On-Forecast initiative, 2)  evaluation of multiple CONUS GOES-R convective applications, including pseudo-geostationary lightning mapper products when operations are expected within the Lightning Mapping Array domains (OK/west-TX, AL, DC, FL), and 3) evaluation of model performance and forecast utility of the OUN WRF when operations are expected in the Southern Plains.

WEEK 2 SUMMARY:

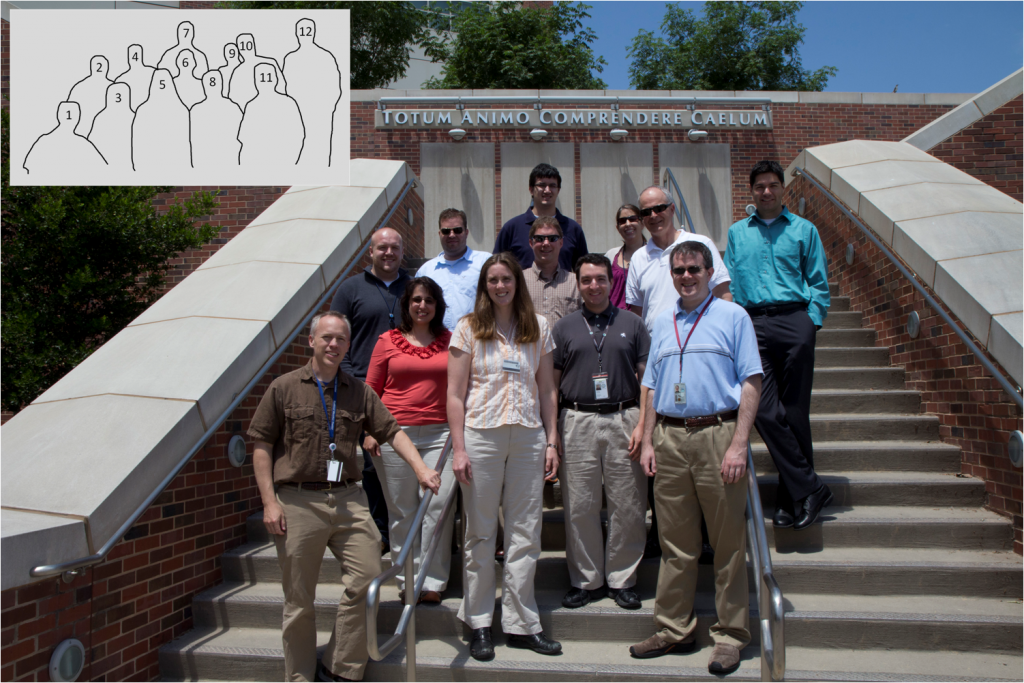
Week #2 of EWP2012 occurred during 7-11 May.  NSSL and the GOES-R program provided travel funds for four forecasters from the NWS: Brian Carcione (WFO, Huntsville, AL), Stephen Kearney (CWSU, Memphis, TN), Julia Ruthford (WFO, Charleston, WV), and Todd Dankers (WFO, Denver, CO).  Other visiting participants this week included Dave Carlsen (Environment Canada), Bob Aune (UW-CIMSS), Wayne Feltz (UW-CIMSS), Jordan Gerth (UW-CIMSS), Lori Schultz (UAH), and Chad Gravelle (GOES-R NWSTC liaison, Kansas City, MO).  Overall the weather pattern was exceptionally quiet for this time of year as a large ridge dominated the central US.  Nevertheless, southern stream disturbances  brought convection to the Rio Grande Valley eastward into Florida.  And northern stream flow over the ridge allowed short-wave troughs to deliver convection from the Western Great Lakes to the East Coast.

Photo:  1)  Jim LaDue (NWS/WDTB), 2)  Chris Siewert (CIMMS/SPC/GOES-R), 3)  Lori Schultz (UAH), 4)  Chad Gravelle (GOES-R NWSTC liaison), 5)  Julia Ruthford (WFO, Charleston, WV), 6)  Todd Dankers (WFO, Denver, CO), 7)  Jordan Gerth (UW-CIMSS), 8)  Stephen Kearney (CWSU, Memphis, TN), 9) Kristin Calhoun (CIMMS/NSSL), 10) Bob Aune (UW-CIMSS), 11) Brian Carcione (WFO, Huntsville, AL), and 12) Gabe Garfield (CIMMS/WFO Norman, OK). Photograph by Greg Stumpf (CIMMS/NWS-MDL).

REAL-TIME EVENT OVERVIEW:

14 May:  SC early, and then Central FL.  SW TX was also briefly worked.

15 May:  Western VA, Eastern IA, and Central FL all had marginal storms.

16 May:  Hailers in VT and Upstate NY.

17 May:  A marginally-severe event across eastern FL, GA, and SC.

FEEDBACK ON EXPERIMENTAL PRODUCTS:

NSSL 3DVAR DATA ASSIMILATION:

NSSL 3DVAR products were quite useful as judged by the majority of forecaster comments.  But there were a few drawbacks.   The following are specific comments:

Benefits:

  • Ten km divergence was extremely useful.  Somehow when the colorscale turned red (10 ^s-1), it seemed to precede severe weather.   On May 16, 10 km divergence turned red 20 min before the first report of large hail.  It also was useful at far ranges from radars.  NSSL may actually adjust so that max divergence at upper levels would be used, or storm top divergence would be added.
  • Updraft helicity was extremely useful too.  But it was more the trend that was important.
  • Updraft strength was used with success.  The team that covered the NWS Burlington, VT CWA storms on May 16 noted values of 12 – 16 m/s preceded severe reports.

Challenges:

  • 3DVAR had problems depicting the rear inflow into a bow echo northeast of Albany, NY on May 16.
  • Beam blockage issues in Burlington’s area possibly produced spurious updrafts.
  • There was little calibration with respect to identifying what horizontal winds at the lowest levels could be associated with severe winds at the ground.

Wishlist:

  • Would’ve liked cross-sections and information on elevation of max vorticity and updraft strength.
  • What can be done about visualizing 1 km wind?  Fabricating 1 km wind and making comparison to ground reports is desirable.  Preferred something in addition to wind barbs.  Would’ve liked isotachs on wind barbs.
  • Forecasters would like to go up in MRMS product height levels like all-tilts does with PPI elevation scans.
  • No one compared the 3DVAR maximum vorticity  to the MRMS azimuthal shear product.

OUN-WRF:

There were no events within the OUN WRF domain this week.

Multiple-Radar / Multiple-Sensor (MRMS)

Everyone was in agreement that the MRMS products were quite useful in depicting storm intensity trends at higher frequency than traditional radar data.  Here are some other remarks below:

Benefits:

MRMS was very good in quantifying trends azimuthal shear without having to worry tilts.

  • MRMS was complimentary to 3DVAR in highlighting first indications that a storm was going severe.
  • Could see MESH, and 60 dBZ height products trend upward before single radar features.
  • It was good in figuring out if warning should be continued.
  • Liked using height of 50 dBZ above -20 and -10 C, especially for lightning anticipation.
  • Accuracy was good in MESH though perhaps with a somewhat high bias.  That may be due to lack of perfectly placed reports.
  • MRMS Helped validate base data.
  • Most common products:  height of 50 dBZ above -20C & -10C,  MESH.
  • Update frequency seemed good, not too frequent, not too noisy.

Challenges:

  • Could see a forecaster just warning when a 50 dBZ echo reaches above a certain temp level.

Wishlist:

  • Thought a negative in the volume browser was having NSSL 0.5 km vs 1 km split into different grids.
  • Need good training to calibrate  forecaster to strong values within MRMS products.
  • MRMS needs to be imported into FSI
  • Forecasters would like to go up in MRMS product height levels like all-tilts does with PPI elevation scans.

GOES-R SimuSat:

The simulated satellite imagery was useful to visualize model output, and sometimes scarily accurate given the storm-scale model was run almost 24 hours before the experiment time.  Here are some comments below:

Benefits:

  • Couldn’t live without it?   Thought it was amazingly useful tool for evaluating model convection.  WRF runs were quite accurate.
  • The product was useful in figuring out whether to go to Chicago or Davenport on Tuesday.  Would we have made those same decisions looking at QPF?

Challenges:

  • Didn’t recognize that the output was tuned to GOES-R instruments and not current GOES.  This was especially true with WV imagery.  It looked very different compared to obs.

Wishlist:

  • Would it be better to have a somewhat different colorscale.
  • Would like simusat in GFE because that’s where the grids are being produced.  Would also like a cloud base image (the cloud base is not satellite but camera view).

GOES-R Nearcast:

The Nearcast product was often used by forecasters mostly before they were consumed by warning decisions.  Both CAPE and delta-Theta-E were used most often.  Here are a few comments below:

Benefits:

  • Really liked the CAPE product.  Qualitatively it was highlighting the areas needed for closer inspection of convective potential.
  • Noticed CAPE did differ from delta-Theta-E in places.
  • Noted the good job nearcast products diagnosed the outflow interacting with the seabreeze and then having the storms initiate there later.
  • There were good delta THTE gradients in Arkansas

Challenges:

  • Nearcast products didn’t depict the Hudson Valley instability maximum as well as RAP data, or just looking at surface dewpoint observations.
  • None of them liked the signs of delta THTE changing from one day to the next.  Credibility was lost a bit.

GOES-R CI (UAH, UW Cloud top cooling)

Both tools received mixed reviews but mostly positive.  Forecasters found that they were useful at most times.  Though sometimes, the CI product didn’t detect CI for various reasons (e.g., cirrus, other unknowns).   Here are specific comments below:

Benefits:

  • Thought that adding the strength of signal color scheme was a significant improvement to the UAH CI tool.
  • The cloud top cooling product detections were better correlated with potential severity than the UAH CI detections.
  • Would like to pull in these products into the NWS pilot projects.

Challenges:

  • Had to stop from associating high UAH values with intensity.   Be wary of missed expectations with products.  This potential for confusion could be reduced with good training.

Wishlist:

  • Would like to include it into the pilot project in Charleston. 

GOES-R PGLM

While we used the LMA a couple times, there was not enough action to get a good feeling for what values constituted timing for using for warning decision.  The case study showed jumps in the first hour of initiation.  This product was a bit lost within all of the other products.

There are more GOES-R feedback details on the GOES-R HWT Blog Weekly Summary.

AWIPS2

The following comments were made by the forecasters as they recalled their memories of using AWIPS2 in HWT experimental warning operations:

  • Paraphrasing the forecaster’s thoughts, If they could use up-arrow keys to ascend model layers or any 3-D grid, that would be great!
  • FSI should add 3-D visualization for MRMS or 3dVAR.
  • Julia would like to be able to contour image and overlay contours on other images.
  • Julia experienced difficulty with keeping AWIPS2 up and running more so than others.  Her failure rate for issuing warnings was 25%.
  • AWIPS2 was great for loading any data on CONUS scale and zooming in as far as WFO-scale could do in the past.

OVERALL COMMENTS:

We were short on logistics discussions but a few points came out worthy of note:

  • Training day was great!  But still struggled on the first days.
  • Would like training delivered a few weeks ahead of time.  Took training in smaller chunks than time allowed.
  • Couldn’t get an admin shift added for the last minute.
  • There are the usual WES issues.  Some offices have operable WES machines while others do not.
  • Thought a quick reference guide would be good.

CONTRIBUTORS:

Jim LaDue, EWP2012 Week #2 Weekly Coordinator

Tags: None

EWP2012 Week 1 Summary: 7-11 May 2012

EWP2012 PROJECT OVERVIEW:

The National Oceanic and Atmospheric Administration (NOAA) Hazardous Weather Testbed (HWT) in Norman, Oklahoma, is a joint project of the National Weather Service (NWS) and the National Severe Storms Laboratory (NSSL).  The HWT provides a conceptual framework and a physical space to foster collaboration between research and operations to test and evaluate emerging technologies and science for NWS operations.  The Experimental Warning Program (EWP) at the HWT is hosting the 2012 Spring Program (EWP2012).  This is the fifth year for EWP activities in the testbed.  EWP2012 takes place across five weeks (Monday – Friday), from 7 May through 15 June.  There are no operations during Memorial Day week (28 May – 1 June).

EWP2012 is designed to test and evaluate new applications, techniques, and products to support Weather Forecast Office (WFO) severe convective weather warning operations.  There will be three primary projects geared toward WFO applications this spring, 1) evaluation of 3DVAR multi-radar real-time data assimilation fields being developed for the Warn-On-Forecast initiative, 2)  evaluation of multiple CONUS GOES-R convective applications, including pseudo-geostationary lightning mapper products when operations are expected within the Lightning Mapping Array domains (OK/west-TX, AL, DC, FL), and 3) evaluation of model performance and forecast utility of the OUN WRF when operations are expected in the Southern Plains.

NEW FOR 2012:

(After this week, this section will not be included in the summaries)

Based on the experience gained from our first five years of operations, the EWP is experimenting with a few changes in our weekly and daily operations for 2012:

1) On-station training shift

Based on feedback from former EWP spring experiment participants, we are providing the training and orientation materials for our spring experiment online. Forecasters will now go through the material in an 8-hour self-paced course to be taken during an on-station supernumerary shift within two weeks prior to their arrival at the Hazardous Weather Testbed in Norman.  A WES Virtual Machine archive case DVD was also sent to the participants as part of the training regimen.  This freed up our Mondays as a real-time operations day (giving us 4 days for the week, instead of only 3 days).

2) Flex shifts

Again, based on feedback from former EWP spring experiment participants, we developed a new shift schedule that provides for some flexibility to account for variable severe weather event times.  Typically, we have operated in the 1-9pm time frame to capture the most likely times for severe weather in which to conduct our experimental warning operations with live data.  These shifts sometimes ended prior to the peak of some severe weather events.

We are now running a flexible shift schedule during Tuesday, Wednesday, and Thursday, pre-determined the prior day via a day-2 forecast  Typically, the shifts will run from 1-9pm.  However, if weather conditions warrant, we may run the shift on either of these alternate times:  12-8pm, 2-10pm, 3-11pm.  The Day 2 shift decisions are posted as a shift status message on the EWP Blog and mailed out to the participants at the end of the previous day’s shift.  Note that our Monday shifts will always be 1-9pm, and our Friday shifts from 9am-1pm.

3) “Tales from the Testbed” Webinars

With the generous assistance of the NWS Warning Decision Training Branch (WDTB), we are embarking on a new feature of the spring experiment.  Each Friday of the experiment (11 May, 18, May, 25 May, 8 June, 15 June), from 12-1pm CDT (1-2pm EDT), we will be conducting forecaster-led Webinars known as “Tales from the Testbed”.   The format will be similar to WDTB’s Dual-pol “Storm of the Month” Webinars.  At each Webinar, each visiting NWS forecaster will summarize their biggest takeaway from their week of participation in the testbed.  After the short presentation, there will be a 30 minute q&a session with the audience.  The audience is for anyone with an interest in what we are doing to improve NWS severe weather warnings, including field personnel, regional and national headquarters folks, and our other stakeholders in the NOAA labs, the GOES-R office, the NextGen program, and elsewhere.  The Webinars will be posted to the EWP2012 Web page, the EWP Blog, and on the WDTB Web site a few days after they are presented.

WEEK 1 SUMMARY:

Week #1 of EWP2012 wrapped up during the week of 7-11 May.  The week was dominated by a split jet stream flow regime, with the best shear associated at the base of a cutoff low over the southwest U.S., affecting southwest and southern Texas and adjacent New Mexico.  However, we did get to work one day on the southeast coast as well.  During this week, NSSL, the GOES-R program, and the NWS Decision Support Services Pilot Project hosted the following National Weather Service participants:  Ryan Barnes (WFO, Norman, OK), Jeffrey Hovis (WFO, Charleston, WV), Roland Nuñez (CWSU, Houston, TX), and Andrea Schoettmer (WFO, Louisville, KY).   Other visiting participants this week included Justin Sieglaff (UW-CIMSS), John Walker (UAH), David DeWitt (OAR), and Amanda Terborg (GOES-R AWC liaison, Kansas City, MO).
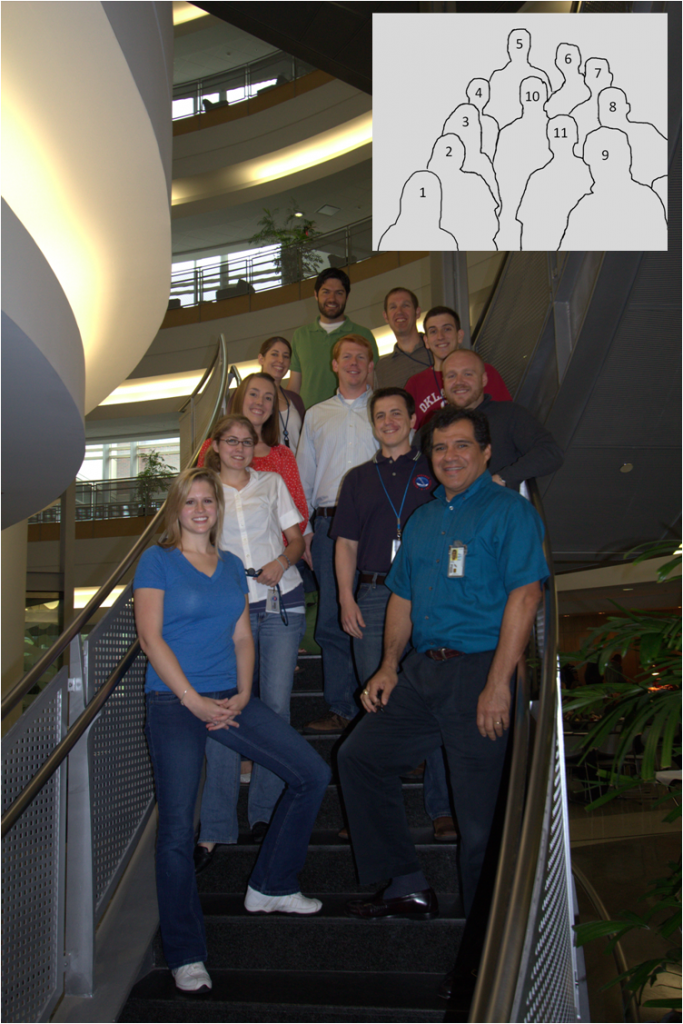
Photo:  1)  Andrea Schoettmer (WFO, Louisville, KY), 2)  Amanda Terberg (CIMMS/GOES-R – AWC liaison, Kansas City, MO), 3)  Madison Miller (CIMMS/NSSL), 4)  Kristin Calhoun (CIMMS/NSSL), 5)  Gabe Garfield (CIMMS/WFO Norman, OK), 6)  Greg Stumpf (CIMMS/NWS-MDL), 7)  Darrel Kingfield (CIMMS/NSSL), 8)  Chris Siewert (CIMMS/SPC/GOES-R), 9) Roland Nuñez (CWSU, Houston, TX), 10) John Walker (UAH), and 11) Ryan Barnes (WFO, Norman, OK).  Photograph by Jim LaDue (NWS/WDTB).


REAL-TIME EVENT OVERVIEW:

7 May: Moderately severe weather and one tornado in Central TX.

8 May: Just a few marginally-severe storms over southern NM; a big hailer in southern TX.

9 May: More marginally-severe storms, this time over coastal SC and GA.

10 May: Supercells with large hail and tornadoes in south TX.

FEEDBACK ON EXPERIMENTAL PRODUCTS:

NSSL 3DVAR DATA ASSIMILATION:

  • Useful for determining when winds meet 40 mph CWSU criteria.
  • 3DVAR products showed rotation in the storms (based on multi-radar integration) better than the single radar data did.  The multiple-radar integration really helped fill in gaps of having to analyze multiple radars separately, especially where storms from one radar were in the “purple haze” of the range-folded obscuration.
  • Would be nice to see same products between 3DVAR and the OUN WRF.
  • The addition of the 3D wind vectors for AWIPS2 is nice.
  • Recommend adding TDWR to the real-time 3DVAR.
  • Vorticity products (1km, 4km) helped reinforce where strongest rotation was tracking, whether storms were deviating and right turning to help polygon placement.  Updraft pulses also helped determine when the storms were intensifying.
  • Depicted a total wind field that simulated the potential of winds descending behind the advancing storm.
  • Composite Updraft seems to be relatively helpful in confirming the strength of a storm.  However, with some quick pulse storms, the 3DVAR data seemed to lag behind a little.

OUN-WRF:

NOTE:  Only the 7 May event (Central TX) was within the OUN WRF domain.

  • Nice have 1 hour updates to monitor changes in the environment.
  • From the CWSU perspective, we’re constantly looking at the progress of mesoscale forecasts, helps keep track of evolution.
  • Subsidence in upper levels for suppression and downdraft velocity could be very useful.  It could be used to project time of convective demise.
  • It is a great situational awareness tool to help determine location of initiation and storm mode.
  • Usually starts out a bit aggressive on convection, but after time it “calms down”.  The later runs (closest to CI) seemed to do the best job of capturing coverage.

GOES-R SimuSat:

  • Could see the moisture ahead of a shortwave, so it was good for anticipating how the environment was changing.
  • This imagery would be very helpful to forecasters in the field because it seems to do a decent job of predicting upper level features, low level clouds, and convection 12-20 hrs in advance.

GOES-R Nearcast:

  • Was very useful on Thursday storms in south TX.  Could see that the storm over the Gulf would continue on a long track based on Nearcast instability forecast.
  • Good for isolated storms, to quickly determine if will be long lasting, or it is going to demise.
  • Used it to determine the evolution of the cold front and stable air on the South Carolina event.
  • Used the theta e difference field when storm first started to intensify and move into more notable area; helped with initial warning.

GOES-R UAH-CI/Satcast:

  • Great move to go to strength of signal, to provide a level of confidence.  But would also like to see some threshold studies, to determine optimal values to use for decision making.
  • Important to to stress to look at environment first, to avoid false alarming.
  • It would be nice to see what is happening inside the storms as well, and match with 3DVAR output.
  • Only saw one ‘high’ false alarm, over Mexico.  Otherwise, when you saw red, you could count on at least 30 DBz storms soon.
  • Would like to see model data integration into product (UAH says this is coming next year), but would like to see output from a non-model and model version for comparison.
  • Would like access to the intermediate products used to make the final product.
  • Helped with boundary identification.

GOES-R UW-CI/CTC:

  • Likes how algorithm combines the data automatically to give a quick answer, versus determining this manually from the base products.
  • Product  was very consistent.
  • Output was hard to see, because it was fleeting and small, but accumulating product helps.  Or an audible or visual alarm (at -10 or -20) would help.
  • Several longer accumulation periods (e.g., 120 min) would be nice.
  • CI provides additional lead time.  It would be great to put an intermediate product out conveying the possibility of strong storms when we first see these CI signals with an actual warning coming later.

GOES-R PGLM:

None of our events this week impacted the Lightning Mapping Array domains with severe weather.  We did briefly operate over central FL, but only one weak storm developed.

There are more GOES-R feedback details on the GOES-R HWT Blog Weekly Summary.

AWIPS2:

  • Seems to do better job with high res data.
  • Had the “not as bad as you think” impression, but because we are ingesting a lot data, had more memory issues.
  • Liked the customization, and the ability to get screen capture and blog to when on same workstation.

OVERALL COMMENTS:

  • Having the principle scientists in the room helps improve use of products in decision making, even if they are “hovering” and occasionally asking questions.
  • Since we are experimental, it’s nice not to have to worry about lead time, etc.  Gives time to interact with the scientists.
  • Addition of 6th day for training was huge day was plus.  It got everyone in the mindset prior to their visit.  Then using Monday to get a good idea of how to start integrating it all within AWIPS2.
  • The WES case did a great job of introducing products.
  • Many of the products would work really well with a meso forecaster paired up with a warning forecaster.
  • Consider more pre-warning products, perhaps akin to what was done during PHI (low-probability warnings).

NOTES FROM THE EWP2012 STAFF:

Several changes to our forecaster schedule will be implemented beginning week 2.  After some consideration, we’ve made a two adjustments to the EWP2012 shift schedules, effective Friday 18 May 2012.  They are:

Monday:  1pm-9pm  (starts 21 May 2012)

Friday:  9am-1pm  (starts 18 May 2012)

The Monday change (moving the start and end time an hour later) was done to accommodate activities of the Hazardous Weather Testbed’s forecast exercise with the Storm Prediction Center.  The Friday change (addition of one hour at the start) was to accommodate the extra time needed to prepare for the “Tales From the Testbed” Webinar.  The shift times on Tuesday, Wednesday, and Thursday will continue to follow the “flex” schedule.

A LOOK AHEAD:

Next week should be very quiet for severe weather.  We may have to fill in some down time with an additional archive case on the WES.  Near the end of the week, some upper-level flow may begin to impact the western part of the Northern Plains.

CONTRIBUTORS:

Greg Stumpf, EWP2012 Operations Coordinator and Week #1 Weekly Coordinator

EWP2012 PROJECT OVERVIEW:

The National Oceanic and Atmospheric Administration (NOAA) Hazardous Weather Testbed (HWT) in Norman, Oklahoma, is a joint project of the National Weather Service (NWS) and the National Severe Storms Laboratory (NSSL). The HWT provides a conceptual framework and a physical space to foster collaboration between research and operations to test and evaluate emerging technologies and science for NWS operations. The Experimental Warning Program (EWP) at the HWT is hosting the 2012 Spring Program (EWP2012). This is the fifth year for EWP activities in the testbed. EWP2012 takes place across five weeks (Monday – Friday), from 7 May through 15 June. There are no operations during Memorial Day week (28 May – 1 June).

EWP2012 is designed to test and evaluate new applications, techniques, and products to support Weather Forecast Office (WFO) severe convective weather warning operations. There will be three primary projects geared toward WFO applications this spring, 1) evaluation of 3DVAR multi-radar real-time data assimilation fields being developed for the Warn-On-Forecast initiative, 2) evaluation of multiple CONUS GOES-R convective applications, including pseudo-geostationary lightning mapper products when operations are expected within the Lightning Mapping Array domains (OK/west-TX, AL, DC, FL), and 3) evaluation of model performance and forecast utility of the OUN WRF when operations are expected in the Southern Plains.

NEW FOR 2012:

(After this week, this section will not be included in the summaries)

Based on the experience gained from our first five years of operations, the EWP is experimenting with a few changes in our weekly and daily operations for 2012:

1) On-station training shift

Based on feedback from former EWP spring experiment participants, we are providing the training and orientation materials for our spring experiment online. Forecasters will now go through the material in an 8-hour self-paced course to be taken during an on-station supernumerary shift within two weeks prior to their arrival at the Hazardous Weather Testbed in Norman. A WES Virtual Machine archive case DVD was also sent to the participants as part of the training regimen. This freed up our Mondays as a real-time operations day (giving us 4 days for the week, instead of only 3 days).

2) Flex shifts

Again, based on feedback from former EWP spring experiment participants, we developed a new shift schedule that provides for some flexibility to account for variable severe weather event times. Typically, we have operated in the 1-9pm time frame to capture the most likely times for severe weather in which to conduct our experimental warning operations with live data. These shifts sometimes ended prior to the peak of some severe weather events.

We are now running a flexible shift schedule during Tuesday, Wednesday, and Thursday, pre-determined the prior day via a day-2 forecast Typically, the shifts will run from 1-9pm. However, if weather conditions warrant, we may run the shift on either of these alternate times: 12-8pm, 2-10pm, 3-11pm. The Day 2 shift decisions are posted as a shift status message on the EWP Blog and mailed out to the participants at the end of the previous day’s shift. Note that our Monday shifts will always be 1-9pm, and our Friday shifts from 9am-1pm.

3) “Tales from the Testbed” Webinars

With the generous assistance of the NWS Warning Decision Training Branch (WDTB), we are embarking on a new feature of the spring experiment. Each Friday of the experiment (11 May, 18, May, 25 May, 8 June, 15 June), from 12-1pm CDT (1-2pm EDT), we will be conducting forecaster-led Webinars known as “Tales from the Testbed”. The format will be similar to WDTB’s Dual-pol “Storm of the Month” Webinars. At each Webinar, each visiting NWS forecaster will summarize their biggest takeaway from their week of participation in the testbed. After the short presentation, there will be a 30 minute q&a session with the audience. The audience is for anyone with an interest in what we are doing to improve NWS severe weather warnings, including field personnel, regional and national headquarters folks, and our other stakeholders in the NOAA labs, the GOES-R office, the NextGen program, and elsewhere. The Webinars will be posted to the EWP2012 Web page, the EWP Blog, and on the WDTB Web site a few days after they are presented.

WEEK 1 SUMMARY:

Week #1 of EWP2012 wrapped up during the week of 7-11 May.  The week was dominated by a split jet stream flow regime, with the best shear associated at the base of a cutoff low over the southwest U.S., affecting southwest and southern Texas and adjacent New Mexico. However, we did get to work one day on the southeast coast as well. During this week, NSSL, the GOES-R program, and the NWS Decision Support Services Pilot Project hosted the following National Weather Service participants:  Ryan Barnes (WFO, Norman, OK), Jeffrey Hovis (WFO, Charleston, WV), Roland Nuñez (CWSU, Houston, TX), and Andrea Schoettmer (WFO, Louisville, KY).

Photo: From bottom left, going up stairs clockwise then down stairs: Andrea Schoettmer (WFO Louisville, KY), Amanda Terberg (CIMMS/GOES-R – AWC liaison, Kansas City, MO), Madison Miller (CIMMS/NSSL), Kristin Kuhlman (CIMMS/NSSL), Gabe Garfield (CIMMS/WFO Norman, OK), Greg Stumpf (CIMMS/NWS-MDL), Darrel Kingfield (CIMMS/NSSL), Chris Siewert (CIMMS/SPC/GOES-R), and Roland Nuñez (CWSU, Houston, TX). In the middle, top: John Walker (UAH), bottom: Ryan Barnes (WFO, Norman, OK).

REAL-TIME EVENT OVERVIEW:

7 May: Moderately severe weather and one tornado in Central TX.

8 May: Just a few marginally-severe storms over southern NM; a big hailer in southern TX.

9 May: More marginally-severe storms, this time over coastal SC and GA.

10 May: Supercells with large hail and tornadoes in south TX.

FEEDBACK ON EXPERIMENTAL PRODUCTS:

NSSL 3DVAR DATA ASSIMILATION:

The following feedback was obtained:

·         Useful for determining when winds meet 40 mph CWSU criteria.  
 
·         3DVAR products showed rotation in the storms (based on multi-radar integration) better than the single radar data did.  The multiple-radar integration really helped fill in gaps of having to analyze multiple radars separately, especially where storms from one radar were in the “purple haze” of the range-folded obscuration.
 
·         Would be nice to see same products between 3DVAR and the OUN WRF.  
 
·         The addition of the 3D wind vectors for AWIPS2 is nice.
 
·         Recommend adding TDWR to the real-time 3DVAR.

·         Vorticity products (1km, 4km) helped reinforce where strongest rotation was tracking, whether storms were deviating and right turning to help polygon placement.  Updraft pulses also helped determine when the storms were intensifying.

·         Depicted a total wind field that simulated the potential of winds descending behind the advancing storm.

·         Composite Updraft seems to be relatively helpful in confirming the strength of a storm.  However, with some quick pulse storms, the 3DVAR data seemed to lag behind a little.
 

OUN-WRF:

The following feedback was obtained:

NOTE: Only the 7 May event (Central TX) was within the OUN WRF domain.

· Nice have 1 hour updates to monitor changes in the environment

· From the CWSU perspective, we’re constantly looking at the progress of mesoscale forecasts, helps keep track of evolution.

 
·         Subsidence in upper levels for suppression and downdraft velocity could be very useful.  It could be used to project time of convective demise.
 
·         It is a great situational awareness tool to help determine location of initiation and storm mode.  
 
·         Usually starts out a bit aggressive on convection, but after time it “calms down”.  The later runs (closest to CI) seemed to do the best job of capturing coverage.

GOES-R SimuSat:

The following feedback was obtained:

·         Could see the moisture ahead of a shortwave, so it was good for anticipating how the environment was changing.  

·         This imagery would be very helpful to forecasters in the field because it seems to do a decent job of predicting upper level features, low level clouds, and convection 12-20 hrs in advance.
 

GOES-R Nearcast:

The following feedback was obtained:

·         Was very useful on Thursday storms in south TX.  Could see that the storm over the Gulf would continue on a long track based on Nearcast instability forecast.
 
·         Good for isolated storms, to quickly determine if will be long lasting, or it is going to demise.  
 
·         Used it to determine the evolution of the cold front and stable air on the South Carolina event.

· Used the theta e difference field when storm first started to intensify and move into more notable area; helped with initial warning.


GOES-R UAH-CI/Satcast:

The following feedback was obtained:

·         Great move to go to strength of signal, to provide a level of confidence.  But would also like to see some threshold studies, to determine optimal values to use for decision making.
 
·         Important to to stress to look at environment first, to avoid false alarming.  
 
·         It would be nice to see what is happening inside the storms as well, and match with 3DVAR output.
 
·         Only saw one 'high' false alarm, over Mexico.  Otherwise, when you saw red, you could count on at least 30 DBz storms soon.
 
·         Would like to see model data integration into product (UAH says this is coming next year), but would like to see output from a non-model and model version for comparison.
 
·         Would like access to the intermediate products used to make the final product.
 
·         Helped with boundary identification.
 

GOES-R UW-CI/CTC:

The following feedback was obtained:

·         Likes how algorithm combines the data automatically to give a quick answer, versus determining this manually from the base products.
 
·         Product  was very consistent.
 
·         Output was hard to see, because it was fleeting and small, but accumulating product helps.  Or an audible or visual alarm (at -10 or -20) would help.
 
·         Several longer accumulation periods (e.g., 120 min) would be nice.

·         CI provides additional lead time.  It would be great to put an intermediate product out conveying the possibility of strong storms when we first see these CI signals with an actual warning coming later.
 

GOES-R PGLM:

None of our events this week impacted the Lightning Mapping Array domains with severe weather. We did briefly operate over central FL, but only one weak storm developed.

There are more GOES-R feedback details on the GOES-R HWT Blog Weekly Summary.

AWIPS2:

·         Seems to do better job with high res data.  
 
·         Had the “not as bad as you think” impression, but because we are ingesting a lot data, had more memory issues.  
 
·         Liked the customization, and the ability to get screen capture and blog to when on same workstation.  
 

OVERALL COMMENTS:

·         Having the principle scientists in the room helps improve use of products in decision making, even if they are “hovering” and occasionally asking questions.
 
·         Since we are experimental, it’s nice not to have to worry about lead time, etc.  Gives time to interact with the scientists.
 
·         Addition of 6th day for training was huge day was plus.  It got everyone in the mindset prior to their visit.  Then using Monday to get a good idea of how to start integrating it all within AWIPS2.
 
·         The WES case did a great job of introducing products.
 
·         Many of the products would work really well with a meso forecaster paired up with a warning forecaster.
 
·         Consider more pre-warning products, perhaps akin to what was done during PHI (low-probability warnings).
 

NOTES FROM THE EWP2012 STAFF:

Several changes to our forecaster schedule will be implemented beginning week 2. After some consideration, we’ve made a two adjustments to the EWP2012 shift schedules, effective Friday 18 May 2012. They are:

Monday: 1pm-9pm (starts 21 May 2012)

Friday: 9am-1pm (starts 18 May 2012)

The Monday change (moving the start and end time an hour later) was done to accommodate activities of the Hazardous Weather Testbed’s forecast exercise with the Storm Prediction Center. The Friday change (addition of one hour at the start) was to accommodate the extra time needed to prepare for the “Tales From the Testbed” Webinar. The shift times on Tuesday, Wednesday, and Thursday will continue to follow the “flex” schedule.

A LOOK AHEAD:

Next week should be very quiet for severe weather. We may have to fill in some down time with an additional archive case on the WES. Near the end of the week, some upper-level flow may begin to impact the western part of the Northern Plains.

CONTRIBUTORS:

Greg Stumpf, EWP2012 Operations Coordinator and Week #1 Weekly Coordinator
Tags: None

Week 4 Summary: 6-10 June 2011

EWP2011 PROJECT OVERVIEW:

The National Oceanic and Atmospheric Administration (NOAA) Hazardous Weather Testbed (HWT) in Norman, Oklahoma, is a joint project of the National Weather Service (NWS) and the National Severe Storms Laboratory (NSSL).  The HWT provides a conceptual framework and a physical space to foster collaboration between research and operations to test and evaluate emerging technologies and science for NWS operations.  The Experimental Warning Program (EWP) at the HWT is hosting the 2011 Spring Program (EWP2011).  This is the fifth year for EWP activities in the testbed.  EWP2011 takes place across four weeks (Monday – Friday), from 9 May through 10 June.  There are no operations during Memorial Day week (30 May – 3 June).

EWP2011 is designed to test and evaluate new applications, techniques, and products to support Weather Forecast Office (WFO) severe convective weather warning operations.  There will be three primary projects geared toward WFO applications this spring, 1) evaluation of 3DVAR multi-radar real-time data assimilation fields being developed for the Warn-On-Forecast initiative, 2)  evaluation of multiple CONUS GOES-R convective applications, including pseudo-geostationary lightning mapper products when operations are expected within the Lightning Mapping Array domains (OK, AL, DC, FL), and 3) evaluation of model performance and forecast utility of the OUN WRF when operations are expected in the Southern Plains.

More information is available on the EWP Blog:  https://hwt.nssl.noaa.gov/ewp/internal/blog/

WEEK 4 SUMMARY:

Week #4 of EWP2011 was conducted during the week of 6-10 June and was the final week of the spring experiment.  It was another pretty “average” week for severe weather, certainly paling in comparison to Week #3.  During this week, NSSL and the GOES-R program hosted the following National Weather Service participants:  Bill Bunting (WFO Fort Worth, TX), Chris Buonanno (WFO Little Rock, AR), Justin Lane (WFO Greenville, SC), and Chris Sohl (WFO Norman, OK).  We also hosted special guest Dr. Pieter Groenemeijer, Director of the European Severe Storms Laboratory near Munich, Germany, for several of the days.  Pieter was visiting both sides of the HWT to learn about the process in order to develop a similar testbed for the ESSL in 2012.

The real-time event overview:

7 June: Failure of CI over eastern ND and northern MN; late action on post-frontal storms in central ND.

8 June: Squall line with embedded supercell and bow elements over eastern IA and southern WI.

9 June: Afternoon squall line over southern New England and NY; evening supercells western OK and southern KS.

The following is a collection of comments and thoughts from the Friday debriefing.

NSSL 3D-VAR DATA ASSIMILATION:

One major technical issue was noted but not diagnosed.  It appeared that at times, the analysis grids were offset from the actual storms, so it is possible that there were some larger-than-expected latency issues with the grids.

It was suggested to add a “Height of maximum vertical velocity” product.  However, we hope to have the entire 3D wind field available in AWIPSII.  We also hope to have a model grid volume browser, similar to the radar “All-Tilts” feature within AWIPSII.  We used the WDSSII display for the wind vector displays.  The forecasters noted that the arrows were plotted such that the tail of the arrow was centered on the grid point.  It should be changed to the middle of the arrow.

The vorticity product was the deciding factor on issuing a Tornado Warning for the Thursday storm north of Wichita.

Bad data quality leads to bad 3DVAR.  In particular, it was noted several times that side-lobe contamination in the inflow of storms was giving false updraft strengths.  Improper velocity dealiasing is also detrimental to good 3DVAR analysis.  There is an intensive data quality improvement effort ongoing as part of the WOF project.

The downdraft product occasionally took a maximum “downdraft” at the upper levels of the storm and projected it to the surface.  There’s not a lot of continuity, and it is difficult to discern consistent features associated with the storms.

Would also like to use the products with less classic type storms, like low-topped convection, microbursts, etc.

David Dowell, who was visiting from GSD this week, is working on a next-generation assimilation using Kalman filtering, but requires more CPU power.  Jidong Gao at NSSL might create a blended technique (with Dowell) that requires less CPU power, something like a 3.5DVAR, which uses 3DVAR for hot-start analysis with radar and model analysis background, and then runs a cloud model out 5 minutes based on that and use it for the first guess on the next analysis, and so on.  This means we would be able to get more fields like T and P for cold pools, downdraft intensity and location, for storm types other than supercells.

OUN-WRF:

There were very few opportunities to evaluate OUN WRF data this week.  Our only event within the domain was on Thursday with a late domain switch for evening half of activities within OK and KS, but convection was already on-going and evaluation concentrated on other experimental EWP products.  The model suggested a few more storms that weren’t there.  One of our forecasters who use the data during regular warning operations in their WFO commented that the updraft helicity product helps with predicting storm type, but that it tends to overproduce cold pools and outflow.

GOES-R Nearcast:

The Nearcast principle investigator, Ralph Peterson, was on hand this week.  He posed the following questions to the forecasters:  Did you find the Nearcast products useful to ID the areas likely for convection initiation, and to predict the timing and location in pre-convective atmosphere.

The Nearcast products were primarily used during the early parts of the day to facilitate the area forecast discussion and afternoon/evening warning location decisions.  One forecaster noted that the Nearcast data behind squall lines becomes less useful with time due to intervening cloud cover.

The forecasters were asked if it would be useful to provide extended forecast hours but at the expense of greater data smoothing.  They liked to have the higher-resolution data to as far out as it is useful to have it.

The forecasters were also asked if they would have used the observation/analysis alone without the forward extrapolation, and the answer was that it wouldn’t have been as useful, since it is better to see how the current environment will evolve.

Showed an arch of destabilization between 2200-0300 across the eastern halves of OK and KS… storms formed on the western edge of this gradient and forecaster did not expect the storms to diminish anytime soon and thus increased warning confidence… stronger wording regarding hail/wind potential in warning was issued.

There seemed to be small scale features in the fields, areas of relative maximum that were moving around… would be nice to compare to radar evolution and see how those areas affected the storm structure.

Helped understand why convection occurred and where it would occur… definitely the 1-6 or 1-9 hour timeframe was the most useful aspect of it.

Having a 4-panel set up of the individual layers in addition to the difference field to help increase the understanding of the product.

The color-table in AWIPS was poor… Also, the values were reversed from those in NAWIPS and on the web. The individual layers of PW were also not available in AWIPS.

GOES-R Convective Initiation (UW and UAH):

The forecasters were asked if they compared the two CI products side-by-side.  The UAH product is more liberal in detections, has a higher resolution (1 km), and uses visible satellite data during daytime mode.  The UW product is more conservative in detections, has a 4 km resolution, uses only IR data, and masks output where there is cirrus contamination.

During the daytime, most forecasters were able to spot initiation in the visible satellite data, and thus the CI products were not all that useful for heads-up.  They did mention there could be value during nocturnal events, but the EWP doesn’t operate after dark, so we couldn’t test.

The notion of probabilistic output was once again brought up.  Instead of a product that was “somewhere in the middle” of good detections and false alarms, a probabilistic product could be more useful.  And a comment was made to bring both groups together to product a single probabilistic product.

In some cases, the products failed to trigger on clumps of cumulus that looked similar to other clumps that were receiving detections.

One forecaster raised a concern about consistency with respect to the FAA using the product for air routing.  If the CI product was automated and used by FAA, how would that conflict with human-created TAFs and other products?

A forecaster found that the UW cloud-top cooling rates useful to look for the timing of the next area of developing convection.

Even though CI didn’t always occur… false hits were useful in identifying clouds trying to break the cap.

GOES-R OTTC:

The one day we would have expected a lot of Overshooting Top detections, Thursday over Kansas, there were lots of missed detections.  Otherwise, the forecasters felt that they could ID the overshooting tops well before the algorithms, except perhaps at night (when we don’t operate).  Chris Siewert mentioned that the spatial resolution of current imager is too great (4x4km), and OT detection works better on higher-res data sets.  The temporal refresh rate also affects detection; sometimes feature show up between scans.

GOES-R pGLM:

We only had one half of an event day to view real-time pGLM data, the Thursday evening OK portion of our operations. Some of the storms to the east had higher flash rates, but this was an artifact of the LMA network’s detection efficiencies.  Flash rates would pick up a short time before increases in reflectivity.

One forecaster has access to real-time LMA data in the WFO and had some comments. They get a lot of calls wanting to know about lightning danger for first and last flash and stratiform rain regions.  It is also good for extremely long channel lightning – might get a rogue hit well away from main core, and sometimes anvils well downstream of main core can get electrically active.

There are more GOES-R details on the GOES-R HWT Blog Weekly Summary.

OVERALL COMMENTS:

The challenge, which was good, was integrating that info with all the other data sets, but also on how to set up the workstations, and best practices to use it.  Need six monitors!

Need pre-defined procedures.  Forecasters used the “ultimate CI” procedure heavily and liked to see what we think they should be combining to help enhance the utility of the products. (However, it is not always clear to the PIs which procedures would be best, as the experimental data has not yet been tested in real-time).

Like the two shifts.  Get to experience both types, a nice change.

I sometimes got too tied into warning operations rather than looking at experimental products.  It’s Pavlovian to think about the “issuing warnings” paradigm. (We tried to emphasize that getting the warning out on time wasn’t a priority this year, but using the warning decision making process to determine how best to use the experimental data sets, but “comfort zone” issues inevitably rise up.)

Training would have been better if done prior to visit, using VisitView or Articulate, and spend training day on how to use products rather than coming in cold.

Two weeks is nice, but April-May is a tough time to add another week, or even one or two X shifts for pre-visit training.

I went through most of training on web before visiting, it was abstract.  But once here, went through it again in a different light.

EFP interaction was tough – it was too jammed at the CI desk.  We felt more like an “add-on” rather than an active participant.

The joint EFP/EWP briefings were too long, and covered aspects we didn’t care about.  There were competing goals.  We should have done it in 15 minutes and moved on.  Need microphones for briefing.  Didn’t need to hear hydro part.  Need to set a time guideline at briefing for all groups.  Also, the information being provided was more academic than pure weather discussion.

The HWT needs more chairs.  Also, two separate equal sized rooms would be better than the current layout.

A LOOK AHEAD:

EWP2011 spring experiment operations are now completed.

CONTRIBUTORS:

Greg Stumpf, EWP2011 Operations Coordinator and Week 4 Weekly Coordinator

Chris Siewert, EWP2011 GOES-R Liaison (from the GOES-R blog)

Tags: None

Week 3 summary (May 23-27)

Week #3 had a very interesting local event, with the following guest NWS forecasters:  Jason Jordan (WFO Lubbock, TX), Daniel Leins (WFO Phoenix, AZ), Bobby Prentice (WDTB, Norman, OK), Pablo Santos (WFO Miami, FL), and Kevin E. Smith (WFO Paducah, KY).  Other visiting participants this week will include Chris Jewett (UAH), Scott Rudlosky (UMD), Lee Cronce (UW-CIMSS), and Rudolf (Rudi) Kaltenböck (Austro Control, Vienna, Austria)

Overview of week 3

Monday was primarily a training day, and was spent familiarizing the forecasters with the products.  They examined both the playback case we have used consistently each week of the experiment, as well as some real-time storms that developed in western OK.

Tuesday was possibly one of the more exciting days in the 5-year history of the EWP.  The morning shift focused on examining the OUN WRF and other data sets, producing the discussion “Tornado Outbreak Likely over KS/OK/n TX.”  We met with the EFP for a combined discussion at 1 pm, and quickly regrouped in the Development Lab for a more detailed strategy session, and were into operations mode by 2pm.

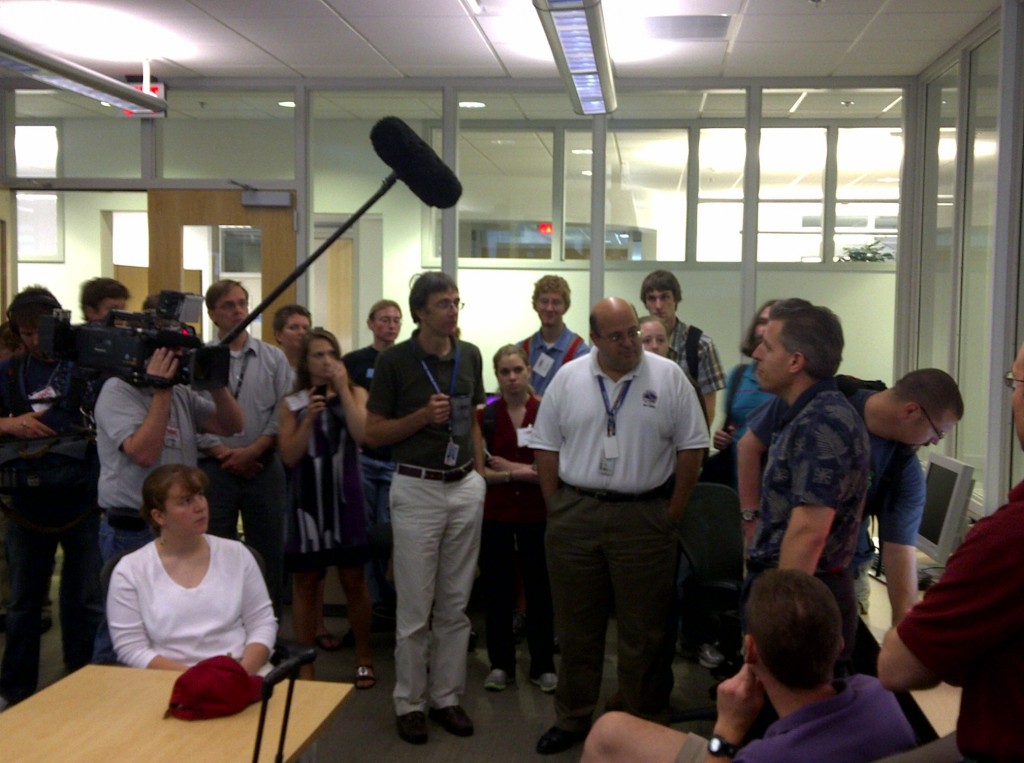
Bobby Prentice briefs the joint EWP/EFP (as well as a few media members) prior to the May 24th outbreak event.

As we moved into the mid-afternoon, supercells developed by 3:30pm, and by 4pm there were tornadoes being observed by spotters and shown in real-time on the Situational Awareness Display.

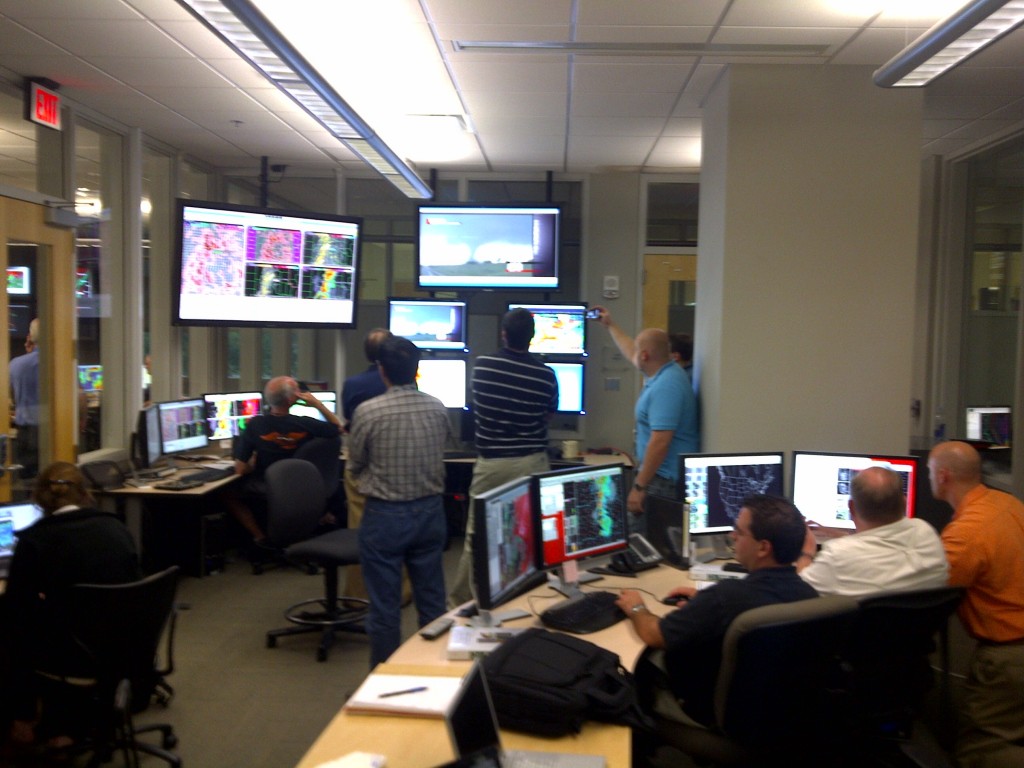
A tornado is observed in real-time on the HWT Situational Awareness Display.

With several supercells approaching central Oklahoma, one group took responsibility for the northern cluster of storms, while the other group observed the southern storms.  Forecasters were able to evaluate all the experimental products (GOES-R, 3DVAR, OUN WRF), although the pGLM feed stopped when one of the OK Lightning Mapping Array sites was damaged by a tornado.  At 5:45pm, the National Weather Center security desk called for everyone to take shelter on the lower level of the NWC.  A few forecasters stayed and observed the storm approaching on radar, but operations were suspended.

As Jason Jordan wrote:

The majority of the forecasters stayed in the HWT to watch the storms as they approached the National Weather Center. Live data from the PAR along with area TDWRs and the KTLX radar showed an impressive evolution of two confirmed tornadic debris balls as the storms moved towards us.

The 3DVar products all handled the track and evolution of the storms very well and the combined radar products also have an excellent track of the tornadoes as well. Continuity was maintained as the storms moved into the cone of silence of the KTLX radar.

As the storms started to move into the metro OKC area, attention to the details/operations was lost as we watched live TV feeds and could see the hail falling outside the WFO window. The excitement rapidly turned to sorrow however as the live TV feeds showed homes and structures being ripped apart.

One last item that made it very clear how close we were to being impacted by the tornadoes directly; leaf and light matter debris was falling from the sky when several EWP members went up to the roof of the NWC to see the dissipation of the tornado moving south of Norman.

Because Central Oklahoma was affected by several violent tornadoes, we suspended operations on Wednesday, and all EWP participants assisted the Norman NWSFO in surveying the damage.  With the help of the EWP teams and others from the Norman community, 8-10 groups of 2-3 people each were able to survey a majority of the damage in one day.

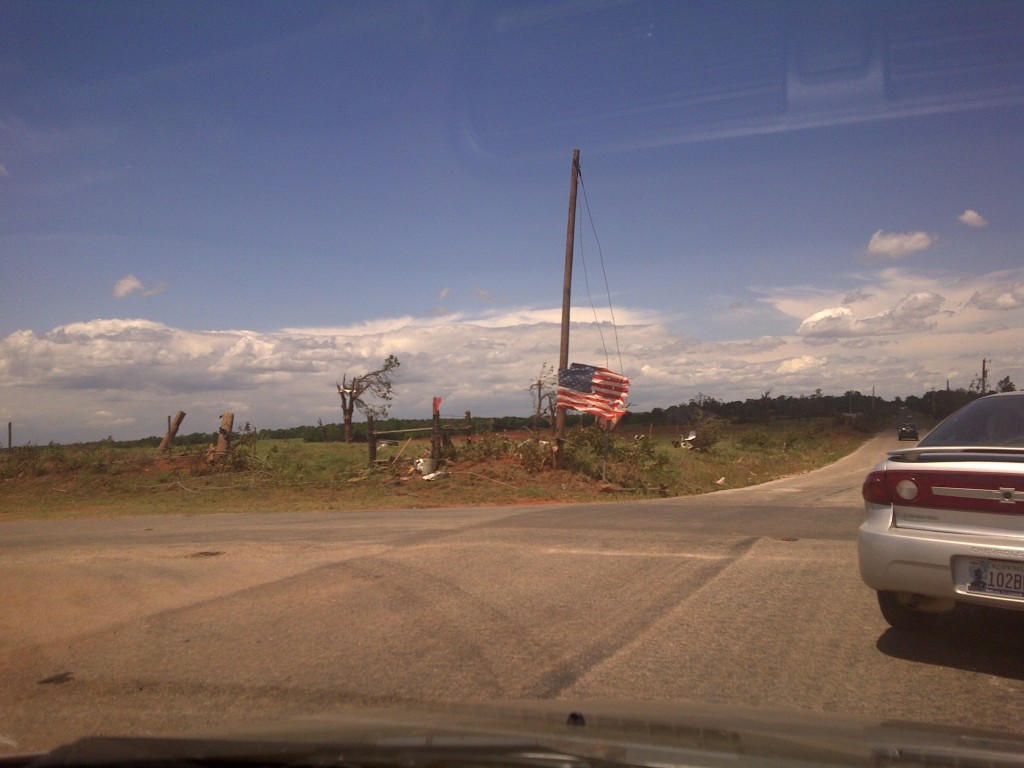
Old Glory flies near Blanchard OK, in the path of an EF4 tornado's destruction.

Thursday’s operations focused on convection in Pennsylvania and Maryland, which allowed additional use of the pGLM products from the DC LMA.  The CI and Nearcast products were examined during the early shift, and the 3DVAR and other remaining satellite products were used during warning operations.

Our usual Friday round-table discussion of the week’s activities provided a lot of additional feedback.  Comments:

UH CI:

  • performance should improve with next-gen satellites.  Probabilities would be a good addition.
  • the CI algorithm may not work work outside the plains region (although it did work in Florida on Thursday)

Other Satellite products:

  • the precipitable water was a nice utility.  Theta-E max on Tuesday showed that the storm was moving into an even more unstable environment.  Gave some additional lead time.  Chris S. commented that this was not the way the creators originally intended to use it, but is a nice fall-out from the research.
  • another forecaster commented that these products could be useful for off-shore significant weather.

pGLM:

  • Tuesday, looking start of El Reno storm, cell mergers, rapid increase in flash rate w/ big changes in updraft intensity.  Downstream increase in anvil activity seemed predictive of where the supercell was moving / regenerating.   We also saw that in the Sterling data on Thursday – rapid increase, led to a closer look and noticed that new cell generation was occurring.
  • 10-15 minute lead time over CG network.   Lots of potential uses, but need more research.
  • General consensus is the a ration of in-cloud to CG-lightning would be interesting.
  • The presence of persistent lightning over time may be related to flash flooding

OUN WRF:

  • it did really well on Tuesday.  Looked at it hour-after-hour.  Updraft Helicity, vorticity.  Probably an accident (jokingly), but was surprised how well it did.  Good groundwork for Warn-on-Forecast.  Very promising.
  • echo previous comment.  Could look at HRRR model for initial conditions.  May be a good boundary condition for OUN WRF in situations where you have less-than-stellar data.
  • Florida forecasters were impressed with HRRR in FL so much that they have started to use it as initial boundary condition.  Have you done any verification versus MR/MS products?
  • OUN would like to use the SPC methods for scoring output for this.
  • the displays are unviewable in some cases.  Too cluttered.
  • Flash Flood – would be nice to have accumulated precip.
  • could do Rotation Tracks, trend analysis.

Side discussion on mesoscale and storm-scale ensembles:

  • need a way to establish reliability of ensembles
  • challenge to consider options – need a statistical complement to the ensemble – statistical distribution of storm behavior.
  • Mark DeMaria paper on blending statistical and dynamic model ensembles to determine improve reliability
  • also reference independent study in the Miami Herald on Probability of Precipitation forecast.  Newspaper used a reliability diagram to show NWS PoP skill.

3DVAR :

  • liked updraft intensity a lot.  Could be used in the microburst environment to detect which cells may be severe.
  • Did an outstanding job on the Tuesday event
  • No doubt that this would be useful.  Need to get it into OSIP right away.

AWIPS thoughts:

  • need some default procedures in AWIPS.  Half the battle was that it was very inefficient to view them.   Lots of time wasted.
  • yes!  Had to recreate his procedures.   Much of his data was missing do to not having a full feed in AWIPS (note: this will be fixed in AWIPS2 next year).
  • most of these are just relational.  Want to evaluate as many procdures as possible in as little time as possible.    Synergistic across multiple projects.

Other forecaster thoughts:

  • Powerpoint training is not the best.  Would prefer “Articulates”
  • include data from previous real-time case to demonstrate.  Perhaps a Virtual Machine for AWIPS
  • forecasters should be required to do pre-work before arriving at the HWT.  This would allow Monday to be used for operations instead of training.

– Travis Smith, weekly coordinator

Tags: None

Week 2 Summary (May 16-20 2011)

Week two allowed us to “spread our wings” a little, in that we operated in the DC domain some, and we made use of the 19 May 2010 Displaced Real Time case.   Participants for this week were:

Kevin Brown (OUN), Kevin Donofrio (PQR), Bill Goodman (OKX), Steve Keighton (RNK), and Jessica Schultz (ROC)

We started off Monday as usual with training, however we opted to abbreviate the training and attempt to get our participants familiar with the data by having them jump into the DRT case Monday afternoon.  This appeared to have some positive affects in getting the forecasters familiar with the set up as well as getting a first look at the data.  Though I think we staved off the “death by powerpoint” issue somewhat, there still seemed to be less enthusiasm to this approach than I anticipated.

Another adjustment this week (compared to week 1) was to try and get the forecasters more involved with the EFP CI desk after getting their AFD completed for the EWP.  We tried to have the EWP forecasters inteact with the EFP CI group by considering a “second CI target”.  While this was a good idea, it is unclear quite how successfully the EWP personnel were in participating in the discussion and selection process.

On Tuesday, our AFD was initially focused on the central plains area, but shifted their guidance to the DEL-MAR-VA region.  Warning operations started off in that area on marginally severe storms.  With the remaining time, we switched to eastern CO to warn on tornadic supercells there.

Wednesday appeared to be a potentially active day for the OK domain if storms could fire.   The OUN WRF painted a really interesting scenario with a supercell very near Oklahoma City.  The DEL-MAR-VA area was again weakly severe, but we opted to use this day to monitor the CI products.  After waiting most of the day, and after a visit by NWS OS&T director Don Berchoff, we returned operations to Eastern CO again.

For Thursday’s activities, we focused again on the OK domain – and this time we had convection!  Storms fired early in SW OK.  We sectorized on these storms immediately (forgoing the EFP CI collaboration).  About a third of the way through the operations period, we shifted to the DDC/ICT/UEX domain as it appeared these storms would be more severe than the OK storms were at the time.  Before long, we switched back to the OUN storms and that’s how we finished.

The following are some highlights from the weekly wrap-up discussion:

CI

Forecasters seemed to like the non-binary CI products.  Though the UAH CI product was understood, users appreciated the level of uncertainty afforded by the CIMSS products.

UAH Sat Cast, looking for CI behind cirrus near dryline, never detected anything, which is good, no false alarms.  Positive null detection

Ice masking to aid in sanity check was useful and appreciated.

NEARCAST products seemed not much different that looking at a RUC theta-E output for a few hours, but with advantage that it is based on observations and advected where you might not have the observations later.

pGLM

There was more discussion/comments on the pGLM product throughout the week than on the last day.  Though the storms in the DEL-MAR-VA area weren’t terribly severe when we were observing them, the pGLM added some additional level of confidence in (non) severity.

The THU case was our best bet for looking at the pGLM, despite a LMA sensor/comms failure that adversely impacted the network for a period late in the operations period.

There was a request for to include what is known so far wrt to total lightning behavior.  Participants requested more WES style cases.  There was also a request for a CG/IC ratio product.

Lightning trend and jump information remains a hot topic, in that many are interested, but we want to make sure we don’t get the “cart before the horse” and verify any claims with solid research.

OUN WRF

On THU, in particular, OUN WRF gave good indication of storm morphology / mode.  Was the only modle that depicted te storms in SW OK and maintaining them.

There was a recommendation for improved/new product combination available to the forecasters.  The SimRef/Updraft Helicity/Vert. Int. Graupel is already being implemented after week 2.

Need to be wary about sharing outside the WFO (eg. EM community) for concerns of latching on to an incorrect solution.  Sometimes it “almost looks too real”.

Time ensemble output/display is desired (something that Sterling does).

3DVAR

Suggestion to break up Updraft/Downdraft composites like the vorticity layer composites (0-3,3-7, total).  Also consider Storm Relative Depth layers.

Request for a SRH product.

Placement of updraft seemed incorrect at times – especially with VA storms, but even with OK storms at times – even when compared to same-latency Sim Ref.

Think the 3DVAR products have a lot of potential to help with SA and add confidence, to help uncertainty with sampling at far ranges or over cone-of-silence.  Swaths (trends) also very helpful.

2D wind vectors would be great to have in AWIPS if possible.  Perhaps FSI, or using the “all-millibars” in the VB.

Logistics/Open Suggestions/MRMS

MRMS op system needs diagnostic tools, to show how many radars and elevation scans go into a grid point (or like CI ice-mask – not 100% optimal), and if it is less than 100% (radar outage), or radars running hot/cold.  Need diagnostic tools to determine if system is not running optimally.

Feels like, “do what you want to”, “look at everything”, “falling into comfort zone”.  Maybe the pairs of forecaster can do traditional warning, and other person looks at the experimental products.  At least one person is focused on that particular product.

We again hear the suggestion of a multi-week setup.  We are certainly not opposed to this, though NWS logistics would be a tough hurdle to overcome.

Hearing greater support (as well as from Week 3) for requiring future participants to complete training prior to arriving.  (powerpoints, articulate, WES cases).  This would help us gain “Monday” as an operational day.

Respectfully Submitted:

-kevin manross :: 2011 EWP Week 2 Weekly Coordinator

Tags: None

Week 1 Summary: 9 May – 13 May 2011

As is typically the case with any first week, this week dealt with a combination of tech problems (raid, awips integration, and server failures). However, these difficulties did not keep our forecasters [Jerilyn Billings (ICT), Scott Blair (TOP), Brian Curran (MAF), Andy Taylor (OUN), Brandon Vincent (RAH)] from providing valuable feedback. This feedback will lead to significant changes to our forecaster schedule and the experimental products as early as week 2.

The first significant change will be to incorporate the WES case developed by Darrel Kingfield (WDTB) into the training on Monday afternoons.  Multiple forecasters felt that getting their ‘hands dirty’ early on would allow them to better integrate the experimental products real-time as the week continues…

The second major change will be to the morning shifts.  The focus of the first half of these shifts have been modified such that the forecasters will be first developing an Area Forecast Discussion (to be posted on this blog) that determines the region of interest for possible severe operations later that afternoon.  After lunch these forecasters will be join the Convection Initiation Desk from the EFP; these forecasters will be narrowing down the region of focus for the CI desk as well.

Multiple products received detailed feedback at our weekly debrief.  A few of these are highlighted below:

OUN-WRF:

*Either a web-based or AWIPS-based dProg/dT type product was desired for the OUN-WRF to help the forecasters view the changes with each successive run.

*Access should be provided WFO’s within the forecast domain.

GOES-R Nearcast:

*Useful for short 1-2 hr forecasters, seems to deteriorate after that.

*Showed areas of convective instability, forecasters could compare to values determined through other methods  (e.g., SPC mesoanalysis)

GOES-R UAH-CI/Satcast:

*Yes/No instant solution not useful to forecasters.  Throughout the week the ‘yes’ caused many false alarms.  Temporal statistics or confidence interval may be more useful.

GOES-R pGLM:

*Good situational awareness tool. Provided 30 min + lead time to CG detections during the week.

*Would like to see an IC/CG ratio product.

NSSL 3D-VAR:

*Saw some correlation between updraft products and radar indicators of severe storms, or MRMS products

*FSI or 3D display would be useful for visualization of some of these products.

*Good situational awareness tool & for matching with warning polygons.

*Vorticity products seemed the most useful during the week.

-Kristin Kuhlman (Week 1 Coordinator)

Tags: None

Week 9 EWP Summary: 14-18 June 2010

SUMMARY:

Week #9 of EWP2010 concluded the 2010 spring experiment, and wrapped up with continued MRMS and GOES-R experimentation.  The 2010 experiment ended with probably our most prolific severe weather outbreak in our four-year history with the MN-ND record tornado outbreak.  During this week, NSSL and the GOES-R program hosted the following National Weather Service participants:  Angela Lese (WFO Louisville, KY), Melissa Kreller (Southern Region HQ, Fort Worth, TX), Marcus Austin (WFO Tallahassee, FL), and Dave Sharp (Melbourne, FL).

REAL-TIME EVENT OVERVIEW:

14 June: “Practice” IOP for some severe storms over Oklahoma and Texas.

15 June: All-day IOP focusing on an Ohio Valley MCS wind event, with some isolated non-tornadic supercells ahead of the MCS.  Many experimental warnings were issued.

16 June: Early afternoon IOP over the DC domain netted only marginally severe storms.  Evening IOP focused on western SD, including a prolific nearly stationary multiple-tornado supercell near Dupree.

17 June: Record tornado outbreak for Minnesota and North Dakota.  We issued 230 experimental severe weather warnings and statements through a 6 hour IOP, a daily record for the EWP.

MRMS:

As was the case from the previous 3 weeks of EWP2010, the forecasters became increasingly more comfortable with the MRMS products as the week moved along.  As if carefully choreographed, the weather events for each successive day became increasingly more severe and widespread, to prepare our forecasters the the following day’s activities!  In general, the forecasters used the MRMS products to their extent by the final day of activities, finding them to be very useful.  However, we did find one forecaster who gravitated back to a comfort level of using more traditional techniques nearing the final few hours of the 17 June outbreak, when a cluster of tornadic supercells was affecting southern MN.

In addition, as seems to be the case each spring, the experimental infrastructure seems to finally come to a nearly bug-free condition in the final few days of the experiment.  The HWT AWIPS system had very few issues on the last few days of the week, although some of the experimental MRMS grids still took a little long to load up for the first time.  If we plan to use AWIPS1 for one more year, this is a top priority to find a solution – speed up the loading of these products.  One of the developer/researchers did happen to note that he was amazed at the complexity of the procedures that were used by some of the forecasters, with multiple 4-panel panes with image combinations, etc., and at how our visiting forecasters could keep up with that.

Some of the comments received during the end-of-week debriefing were echoed from previous week’s forecasters.  For example, it was again noted that the tracks products (hail and rotation) were very helpful in double-checking the orientation of the storm-based polygons, and also helped to fine tune the width of the polygons to cover narrower severe weather threats.  However, it was noted that in the final few hours of the MN-SD outbreak, because there was so much severe weather, some the polygons started getting “wide” again since there was not enough time to keep up with the widespread coverage of the severe storms.  Knowing this, we could consider this event a good archive practice case, one which could be performed by the forecasters at the end of the week once familiarity of the MRMS products is at its peak.

It was again noted that some of the MRMS products, such as the Height of the 50 dBZ over the -20 degree C altitude were very useful to provide a simple quick-look heads up as to which storms were worthy of closer inspection or warning.  These products are somewhat sparse grids, and only show the most severe storms (so not many at once).  Since they are from the MRMS grid, there is no need to explore each storm from each radar using all-tilts or 4-panels with height sampling, or have to choose the appropriate radar – the “answer” is right there on one simple rapidly-refreshing grid.

And again, comments were made regarding developing MRMS products to help with wind-based warnings, such as those which could exploit the LLSD Radial Shear computations for a Mid-Altitude Radial Convergence (MARC) signature detection.

Other comments included:  The “thickness” products, such as H50_Above_H253 should include negative values so that we can know when storms are approaching severe limits. since the grids are so sparse they are sometimes hard to see; MESH appears to do better than MESHb at low elevations, and the reverse at high elevations (NOTE:  The gridded-MESH does not do an elevation correction like the cell-based ORPG version – this needs to be fixed); 30-min tracks worked better for training storms.

GOES-R:

As with other weeks, the GOES-R products were not used nearly as much as the MRMS products, but then again that is somewhat by design.  A convective initiation product is more useful at the onset of storms, and many of our shifts had begun after CI.  The forecasters did not that although the Overshooting Tops and Thermal Couplet products were sparse, they usually happened on storms that were already obviously severe from the radar data.  They did give a little more confidence however, but they had a tendency to stop looking at the products during the heat of the warning events.

Other useful comments included:  The products are on very sparse grids, so larger icons and alerts would be useful; they wouldn’t mind that the CI product was more liberal in its detection with higher FAR, but adding probabilistic info might help parse the more important signatures; would like a good Western U.S. example where there is a lack of multi-radar coverage (but unfortunately, also a lack of severe storms); have earlier starting shifts to concentrate on the CI products.

The PGLM data exposure was mainly through the 24 May 2008 Oklahoma archive case.  A couple of forecasters noted that they would have to acquire more understanding of what the relative values mean to severe weather before becoming more comfortable with it.  They also hoped that in future EWPs, there could be more emphasis placed on events outside traditional Oklahoma tornadic storms.  Unfortunately, time did not permit us to make additional archive events, and there were only and handful of real-time events that coincided with our domains (and the networks being active).  In fact, we didn’t have a single Central Florida severe event to test.

There are more details on the GOES-R HWT Blog Weekly Summary.

OVERALL COMMENTS:

Several commented that a simple 20-min Articulate primer on each of the experiments would have been very useful to have prior to arriving in Norman.  In addition, a 20-min Articulate on existing ways to get the MRMS data (Google Earth KML, and On-Demand) should be developed as soon as possible, to continue to expand the word out on these very useful applications.  Also suggested that regional teleconference meetings and workshops would be a good way to get the spread the word.

The forecasters prefer that we “hand-hold” on the first day a little better.  Perhaps an archive case on the first day and then throw them into warnings.  Also, default procedures need to be developed to avoid having to set them up the first day, which takes a long time [NOTE:  This was also suggested last year, but as I’ve learned, forecasters are very unique on their procedures, combining the experimental data with their own, that I felt it was better served to allow the forecasters to build their own.  I will have to re-visit this decision for next year.]

There were comments about the fact that the products still took some time to initially load, and that there was a lot of maintenance required of the AWIPS system.  [NOTE:  A full-time HWT IT person could really help here!]

A LOOK AHEAD:

We are finished for the spring.  The next operation could occur as early as this fall.  Details will be announced as they arrive.

Greg Stumpf, EWP2010 Operations Coordinator

Week 9 EWP Summary: 14-18 June 2010

SUMMARY:

Week #9 of EWP2010 concluded the 2010 spring epxeriment, and wrapped up with continued MRMS and GOES-R

experimentation.  The 2010 experiment ended with probably our most prolific severe weather outbreak in our

four-year history with the MN-ND record tornado outbreak.  During this week, NSSL and the GOES-R program

hosted the following National Weather Service participants:  Angela Lese (WFO Louisville, KY), Melissa Kreller

(Southern Region HQ, Fort Worth, TX), Marcus Austin (WFO Tallahassee, FL), and Dave Sharp (Melbourne, FL).

REAL-TIME EVENTS:

14 June:  “Practice” IOP for some severe storms over Oklahoma and Texas.

15 June:  All-day IOP focusing on an Ohio Valley MCS wind event, with some isolated non-tornadic supercells

ahead of the MCS.  Many experimental warnings were issued.

16 June:  Early afternoon IOP over the DC domain netted only marginally severe storms.  Evening IOP focused on

western SD, including a prolific nearly stationary multiple-tornado supercell near Dupree.

17 June:  Record tornado outbreak for Minnesota and North Dakota.  We issued 230 experimental severe weather

warnings and statements through a 6 hour IOP, a daily record for the EWP.

A summary of each experiment follows:

MRMS:

As was the case from the previous 3 weeks of EWP2010, the forecasters became increasingly more comfortable

with the MRMS products as the week moved along.  As if carefully choreographed, the weather events for each

successive day became increasingly more severe and widespread, to prepare our forecasters the the following

day’s activities!  Actually, on the final day, we did find one forecaster who gravitated back to a comfort

level of using more traditional techniques nearing the final few hours of the event, when the a cluster of

tornadic supercells was affecting southern MN.  However, the other forecasters used the MRMS products to their

extent on the last day.

In addition, as seems to be the case each spring, the experimental infrastructure seems to finally come to a

nearly bug-free condition in the final few days of the experiment.  The HWT AWIPS system had very few issues

on the last few days of the week, although some of the experimental MRMS grids still took a little long to

load up for the first time.  If we plan to use AWIPS1 for one more year, this is a top priority to find a

solution – speed up the loading of these products.  One of the developer/researchers did happen to note that

he was amazed at the complexity of the procedures that were used by some of the forecasters, with multiple

4-panel panes with image combinations, etc., and at how our visiting forecasters could keep up with that.

Some of the comments received during the end-of-week debriefing were echoed from previous week’s forecasters.

For example, it was again noted that the tracks products (hail and rotation) were very helpful in

double-checking the orientation of the storm-based polygons, and also helped to fine tune the width of the

polygons to cover narrower severe eather threats.  However, it was noted that in the final few hours of the

MN-SD outbreak, because there was so much severe weather, some the polygons started getting “wide” again since

there was not enough time to keep up with the widespread coverage of the severe storms.  Knowing this, we

could consider this event a good archive practice case, one which could be performed by the forecasters at the

end of the week once familiarity of the MRMS products is at its peak.

It was again noted that some of the MRMS products, such as the Height of the 50 dBZ over the -20 degree C

alitutude were very useful to provide a simple quick-look heads up as to which storms were worthy of closer

inspection or warning.  These products are somewhat sparse grids, and only show the most severe storms (so not

many at once).  Since they are from the MRMS grid, there is no need to explore each storm from each radar

using all-tilts or 4-panels with height sampling, or have to choose the appropriate radar – the “answer” is

right there on one simple rapidly-refreshing grid.

And again, comments were made regarding developing MRMS products to help with wind-based warnings, such as

those which could exploit the LLSD Radial Shear computations for a Mid-Altitude Radial Convergence (MARC)

signature detection.

Other comments included:  The “thickness” products, such as H50_Above_H253 should include negative values so

that we can know when storms are approaching severe limits. since the grids are so sparse they are sometimes

hard to see; MESH appears to do better than MESHb at low elevations, and the reverse at high elevations (NOTE:

The gridded-MESH does not do an elevation correction like the cell-based ORPG version – this needs to be

fixed); 30-min tracks worked better for training storms.

GOES-R:

As with other weeks, the GOES-R products were not used nearly as much as the MRMS products, but then again

that is somewhat by design.  A convective initiation product is more useful at the onset of storms, and many

of our shifts had begun after CI.  The forecasters did not that although the Overshooting Tops and Thermal

Couplet products were sparse, they usually happened on storms that were already obviously severe from the

radar data.  They did give a little more confidence however, but they had a tendency to stop looking at the

products during the heat of the warning events.

Other useful comments included:  The products are on very sparse grids, so largericons and alerts would be

useful; they wouldn’t mind that the CI product was more liberal in its detection with higher FAR, but adding

probabilistic info might help parse the more imporant signatures; would like a good Western U.S. example where

there is a lack of multi-radar coverage (but unfortunately, also a lack of severe storms); have earlier

starting shifts to concentrate on the CI products.

The PGLM data exposure was mainly through the 24 May 2008 Oklahoma archive case.  A couple of forecasters

noted that they would have to aqcuire more understanding ofwhat the relative values mean to severe weather

before becoming more comfortable with it.  They also hoped that in future EWPs, there could be more emphasis

placed on events outside traditional Oklahoma tornadic storms.  Unfortunately, time did not permit us to make

additional archive events, and there were only and handful of real-time events that coincided with our domains

(and the networks being active).  In fact, we didn’t have a single Central Florida severe event to test.

There are more details on the GOES-R HWT Blog

(http://goesrhwt.blogspot.com/2010/06/ewp-weekly-debrief_18.html).

OVERALL COMMENTS:

Several commented that a simple 20-min Articulate primer on each of the exeriments would have been very useful

to have prior to arriving in Norman.  In addition, a 20-min Articulate on existing ways to get the MRMS data

(Google Earth KML, and On-Demand) should be developed as soon aspossible, to continue to expand the word out

on these very useful applications.  Also suggested that regional teleconference meetings and workshops would

be a good way to get the spread the word.

The forecasters prefer that we “hand-hold” on the first day a little better.  Perhaps an archive case on the

first day and then throw them into warnings.  Also, default procedures need to be developed to avoid having to

set them up the first day, which takes a long time [NOTE:  This was also suggested last year, but as I’ve

learned, forecasters are very unique on their procedures, combining the experimental data with their own, that

I felt it was better served to allow the forecasters to build their own.  I will have to re-visit this

decision for next year.]

There were comments about the fact that the products still took some time to initially load, and that there

was a lot of maintenance required of the AWIPS system.  [NOTE:  A full-time HWT IT person could really help

here!]

A LOOK AHEAD:

We are finished for the spring.  The next operation could occur as early as this fall.  Details will be

announced as they arrive.

Greg Stumpf, EWP2010 Operations Coordinator

Tags: None

Week 8 EWP Summary: 7-11 June 2010

SUMMARY:

Week #8 of EWP2010 wrapped up the first week of MRMS and GOES-R experimentation.  We spent a lot of time in the High Plains this week, however we were able to get one event over the Alabama Lightning Mapping Array.  During this week, NSSL and the GOES-R program hosted the following National Weather Service participants:  Frank Alsheimer (WFO Charleston, SC), Dan Darbe (WFO Atlanta/Peachtree City, GA), Daniel Nietfeld (WFO Omaha, NE), Pat Spoden (WFO Paducah, KY), and Andy Taylor (Norman, OK).

REAL-TIME EVENT OVERVIEW:

7 June: Evening “practice” IOP for southeast Wyoming and western Nebraska, including Scottsbluff tornado that V2 was on.

8 June: All day IOP over Kansas.

9 June: IOP for the Northern Alabama Lightning Mapping Array area today.

10 June: Front Range IOP today, including a tornadic supercell near Deer Trail Colorado that V2 was on.

MRMS:

One forecaster felt that the MRMS products helped add confidence to his decision making, but there was not enough time during the one week period to warm up to them.  However, another forecaster felt the rapid updates and multi-radar nature helped with quick identification of the severe storms, and then sparse grid products made the big cores really stand out from the rest.

As the week wore on, they became more comfortable with the MRMS products, and started to hone in on the specific products that worked best for their decision making.  They wanted to note that on the first few days, they weren’t as concerned about getting the warnings out sooner than the official warnings, knowing that there was no risk in a late warning.  [NOTE:  We’ll need to take that into account, hence why we’re doing some of the day-of-the-week composites in our analysis.]

They noted that there were big benefits that these were multiple-radar products.  They spent less time having to do an all-tilts analysis on all storms from each radar sensing the storm, or choosing the “correct” radar.

One forecaster commented that he was a firm believer in using MESH or another sparse grid designed for hail diagnosis to really narrow down the hail threat and make the polygons slimmer to avoid overwarning.

The rotation tracks really helped hone in on which storms to watch for tornado warnings.

Suggested improvements:  Add height information to the isothermal reflectivity products (could do multi-parameter sampling); an on-demand MRMS system where forecasters could create their own products (e.g., Reflectivity at -12 degC for winter precip) would be very beneficial.

GOES-R:

All agreed that cirrus presents major problems for the Convective Initiation (CI) product.  They also mentioned that the CI products do best in the first 10-15 minutes of an event.  Once warnings are starting to be issued, it was rarely looked at again.  CI would be useful on pre-dawn low-level jet warm advection situations to determine location of first convection, but that there needs to be some kind of alarm/trigger to notify the forecasters who might not be paying close attention.  A nighttime WES archive case was suggested for future experiments.  These forecasters also commented that there are too few CI detections, and wouldn’t mind lowering thresholds and adding uncertainty to get more detections.  There were concerns that CI, OT, and TC are too sparse sometimes to see, and better alerting/icons would help.  But some others abhor the bells and whistles of SCAN and GUARDIAN, and would want another way to alert.  Also, there might be need for separate day and night CI products.

Forecasters felt that the OT products were not needed when you can see them in the visible data, but it certainly adds more confidence about the storm being severe.

Regarding the PGLM products, suggestions included a cell table concept to plot trends, adding a lightning jump algorithm, a wintertime total lightning app, combining lightning data with other sensors, and rate of change products.  A discussion also ensued regarding short-term lightning threat products, or advisories for frequent cloud-to-ground lightning.

There are more details on the GOES-R HWT Blog Weekly Summary.

OVERALL COMMENTS:

Some comments echoed by former participants, including pre-made default AWIPS procedures (don’t like using others’ procedures), and fixing the MRMS loading issues with better hardware.  It was noted that the recommended hotel (Country Garden Inns & Suites) has taken a major turn for the worse this year and should no longer be used.  Not only did our software have bugs….

A LOOK AHEAD:

Next week will wrap up the 2010 spring experiment.  The pattern looks favorable for continued severe weather, mainly shifting into the Northern Plains by the end of the week.

Greg Stumpf, EWP2010 Operations Coordinator

Tags: None

Week 7 EWP Summary: 24-28 May 2010

SUMMARY:

Week #7 of EWP2010 wrapped up the first week of MRMS and GOES-R experimentation.  We were all over the CONUS this week, including a perfectly timed event over the Washington DC area for our Headquarters visitors.  During this week, NSSL and the GOES-R program hosted the following National Weather Service participants:  Rod Donavon (Des Moines, IA), John Murray (New York, NY), James Sieveking (St. Louis, MO), and David Zaff (Buffalo, NY).

REAL-TIME EVENT OVERVIEW:

24 May: “Practice” IOP, first looking at CI products for AMA and DDC, then MRMS products for OUN.

25 May: 6-hour IOP, working High Plains storms, working AMA, PUB, and DDC CWAs.

26 May: Early IOP over Oklahoma (no severe reports), later IOP for the Front Range, DEN and CYS.

27 May: 6-hour IOP over the Northeast U.S., PHI, CTP, and the LMA network near Washington DC.

MRMS:

With Rod Donavon here this week as one of our participants, we were able to get an idea of how his hail diagnosis technique adapted to the MRMS data.  The Donavon Technique uses the Thickness between the 50dBZ Echo Top and the height of the melting level (0degC), but diagnosed using traditional D2D methods (all tilts or 4-panels with data sampling) using single radar data and an estimate of the melting level height from either nearby sounding or model data.  A suggestion included taking his severe hail probability values based on the technique and gridding them as an additional MRMS product.  But his new technique, adapted for the new 1″ hail criteria, also looks at the height of the 65 dBZ Echo over the melting level height, a possible new product we could add to the suite.

A lot of the forecasters liked the Reflectivity at the -20C level, and Jim Sieveking added his unique “red-white-blue” colormap to our system.  He and other forecasters create this product locally using the Volume Browser and RUC temperature profiles to sample as you go up in elevation, but that version is single-radar based.  The biggest advantage is that the MRMS product is already in a gridded form.

Some of the “sparse grid” MRMS products are good for situational awareness – they show the few storms that “stand out” against the rest, those storms that are obviously severe.  These included the 50 dBZ Echo Top and the H50_above_H253.

One forecaster was curious as to what Azimuthal Shear values correlated best with tornadoes.  However, as with MDA and TDA, there are distributions of tornadic and non-tornadic storms at all strengths, with a higher probability of tornadoes at higher values.  But there was a definite advantage of using the Rotation Tracks to help with polygon orientation and determining intensity trends.

The forecasters felt more comfortable using the MRMS products as the week went along.  But they commented that they needed more information about how the 3D reflectivity cube was created, and what went into each product.  We re-tooled the training for the following weeks to include more of that information, and eventually will include this in a 20-min Articulate presentation for the Google Earth KML-wrapped PNG image users.

All forecaster mentioned that it would be nice to have more MRMS applications to help with the severe wind decision making.  We’ve got enough for hail, lightning, and tornadoes.

GOES-R:

The Convective Initiation (CI) product once again suffered from cirrus obscuration, and very few detections.  Some suggestions were to somehow include audible or Guardian alerts for CI detections, and the ability to display contours cloud-top-cooling rates over satellite or radar imagery.

Overshooting Tops and Thermal Couplet detections were rare this week.

We had an opportunity to view real-time pseudo-GLM (PGLM) products over the Washington DC LMA data this week, but the highest flash rates seen (37) were no where near the values seen during the Oklahoma archive case (100+).  Some forecasters commented that they still were unsure of what the value meant relative to storm severity that that more experience would be needed to know.  They did like to compare the PGLM data with the MRMS data or just the height of the 50 dBZ Echo Tops determined manually.  Noted trending up with storm severity, and even a drop right before the tornado in the archive case.  Others would like to see a winter convective archive case used.  Some also felt that total lightning was a good discriminator of convective initiation.

There are more details on the GOES-R HWT Blog Weekly Summary.

OVERALL COMMENTS:

We had a good discussion on how the AWIPS environment is set up in the HWT.  There was a debate over using WES archive cases for all events, in which we could control the diversity of cases looked at, versus real-time events where there is the element of surprise.  Noted was the fact that during real-time events, the storm reports are usually delayed, and the reporting time is rarely recorded so it would be difficult to recreate this in an archive situation (unless we guessed at a delay time).

The forecasters were hoping for some default AWIPS procedures to get them started.  This was also noted in other weeks, as well as last year, so we’ll have to strongly consider this for 2011.

Greg said he was struggling with the decision to “nudge” the forecasters to look at certain products, or to just let them go on their own to discover them.  It was suggested that perhaps next time, to make a checklist of what products should be looked at.  [NOTE:  Now that the project has ended, I’m realizing that perhaps we needed to include some MRMS “best warning practices” information, for examples:  1) be sure to use the track products to orient the warning polygons at all times, 2) make sure all polygons are “storm-based” – i.e., only one polygon per storm, and 3) separate hail/wind threat from tornadoes with separate polygons.]

Finally, there was a suggestion that we start Monday at a normal shift time of 9am for training, and then leave the option to stay for an overtime shift past 5pm for a real-time event.  One issue is that the researchers/developers live local and may not have the flexibility with family schedules to pull a 12-hour shift.

A LOOK AHEAD:

We are taking next week off due to the Memorial Day holiday and a short week.  The next operational week is two weeks away, too far into the future for any reasonable prediction.

Greg Stumpf, EWP2010 Operations Coordinator

Tags: None

Week 6 EWP Summary: 17-21 May 2010

SUMMARY:

Week #6 of EWP2010 wrapped up the first week of MRMS and GOES-R experimentation.  This week included another Central Oklahoma High Risk adventure, however our Lightning Mapping Array was down for repairs.  During this week, NSSL and the GOES-R program hosted the following National Weather Service participants:  David Blanchard (Flagstaff, AZ), Matt Kramar (Sterling, VA), Ken Pomeroy (Western Region HQ, Salt Lake City, UT), and Darren Van Cleave (Rapid City, SD) .

REAL-TIME EVENT OVERVIEW:

17 May: “Practice” IOP for some severe storms in Midland’s CWA.

18 May: Isolated TX Panhandle tornadic supercell that V2 followed, plus other supercells in Pueblo’s CWA.

19 May: First full day (6 hour) IOP, with Central OK High Risk tornadic supercells.

20 May: Early IOP in Fort Worth’s area, later IOP exploiting the Alabama LMA.

MRMS:

Forecasters felt that it was more efficient to issue the warnings using the MRMS data versus having to check storms out for three different radars.  Was easier to follow estimated hail size in SVSs.  And the tracks products were very good at aligning the polygons.

However, we learned early on this week that the initial load time for the experimental MRMS products was excruciatingly slow.  Turned out to be a product of many issues on the system, including a bad network connection on the motherboard, which was replaced with a 1 Gbit network PCI card.  But the issues intermittently persisted.  We also moved the location of the MRMS data storage to the main server, and that helped but didn’t completely solve the problem.  Looking beyond this issue, once the products were initially loaded via procedures or otherwise, they usually updated automatically with no delays.  [NOTE: It turned out that we weren’t able to find one of the major sources of the problem until the final week of EWP2010.]

One of the advantages of a MRMS system is to better diagnose storms that go directly over a single radar, into their cone-of-silence.  This happened several times during the week.  For the hail diagnosis parameters, the MRMS system did a great job of filling in the cones-of-silence from adjacent radars.  However, for the rotation tracks/azimuthal shear products, it was more problematic.  The reason was that the az shear products have a limitation close to radars due to the extreme elevation angle of some of the cuts within the 0-2 km layer, and the detection of the vertical component of the shear.  NSSL will work on this issue after the experiment.

By the end of the week, some of the forecasters commented that their familiarity with some of the MRMS products was enough to start trusting them and be more comfortable using them.

Some suggestions for new products were to 1) take care of the change in severe hail size threshold from 3/4″ to 1″ (e.g, 60 dBZ Echo Top), and 2) to deal with severe wind.  Both of these issues will be considered after the experiment.

GOES-R:

The convective initiation (CI) products were hampered by cirrus several times.  In addition, they were not very sensitive – in other words, there were usually detections after radar indicated new convection, so there wasn’t much heads up.  It was noted that their greatest value was on the very first storm of the day.

The Overshooting Tops (OT) and Thermal Couplet (TC) algorithm didn’t seem quite useful.  Storms were already known to be severe, based on radar, when an OT detection was had.  The signatures were also seen using visible satellite, and an algorithm wasn’t too useful.  However, the forecasters suggested that it might be more useful where there is a lack of radar coverage or at night when visible satellite coverage is nil.  The developers also mentioned that the increased temporal and spatial resolution of GOES-R would make for better detections.  There is also work underway to attach OT and TC info to storm cluster detections (NSSL work) in order to provide time trends of these attributes.

The 8 km resolution Pseudo Geostationary Lightning Mapper (PGLM) data were viewed during the 24 May 2008 archive event as well as the real-time Alabama event.  In both cases, the data resolution was greatly smoothed by the AWIPS volume browser.  It turns out that 1) the WDSSII grids were not being resampled to 1 km resolution as they were last year, and 2) the AWIPS volume browser had grid objective analysis (smoothing) turned on.  Both of these issues were fixed after this week.

There are more details on the GOES-R HWT Blog Weekly Summary.

OVERALL COMMENTS:

This is the first year we tried “double IOPs”, lasting more than 3 hours (more like 6-7 hours).  The forecasters were fine with this, commenting that it was more like real WFO operations.  One of our veteran forecasters once again suggested that participants really need to be here for two weeks instead of one to get more out of the experiment, and be most spun up with the new products.  Another veteran thought that having the data already in AWIPS makes the transition much easier on the forecasters.  Finally, they suggested that the training be developed prior to the start of the experiment, perhaps as 20-min Articulate presentations made in collaboration with WDTB.

A LOOK AHEAD:

Next week looks good in terms of potential for severe weather nearly anywhere in the central or eastern U. S. on each day.

Greg Stumpf, EWP2010 Operations Coordinator

17 May: “Practice” IOP for some severe storms in Midland’s CWA.

18 May: Isolated TX Panhandle tornadic supercell that V2 followed, plus other supercells in Pueblo’s CWA.

19 May: First full day (6 hour) IOP, with Central OK High Risk tornadic supercells.

20 May: Early IOP in Fort Worth’s area, later IOP exploiting the Alabama LMA.

Tags: None