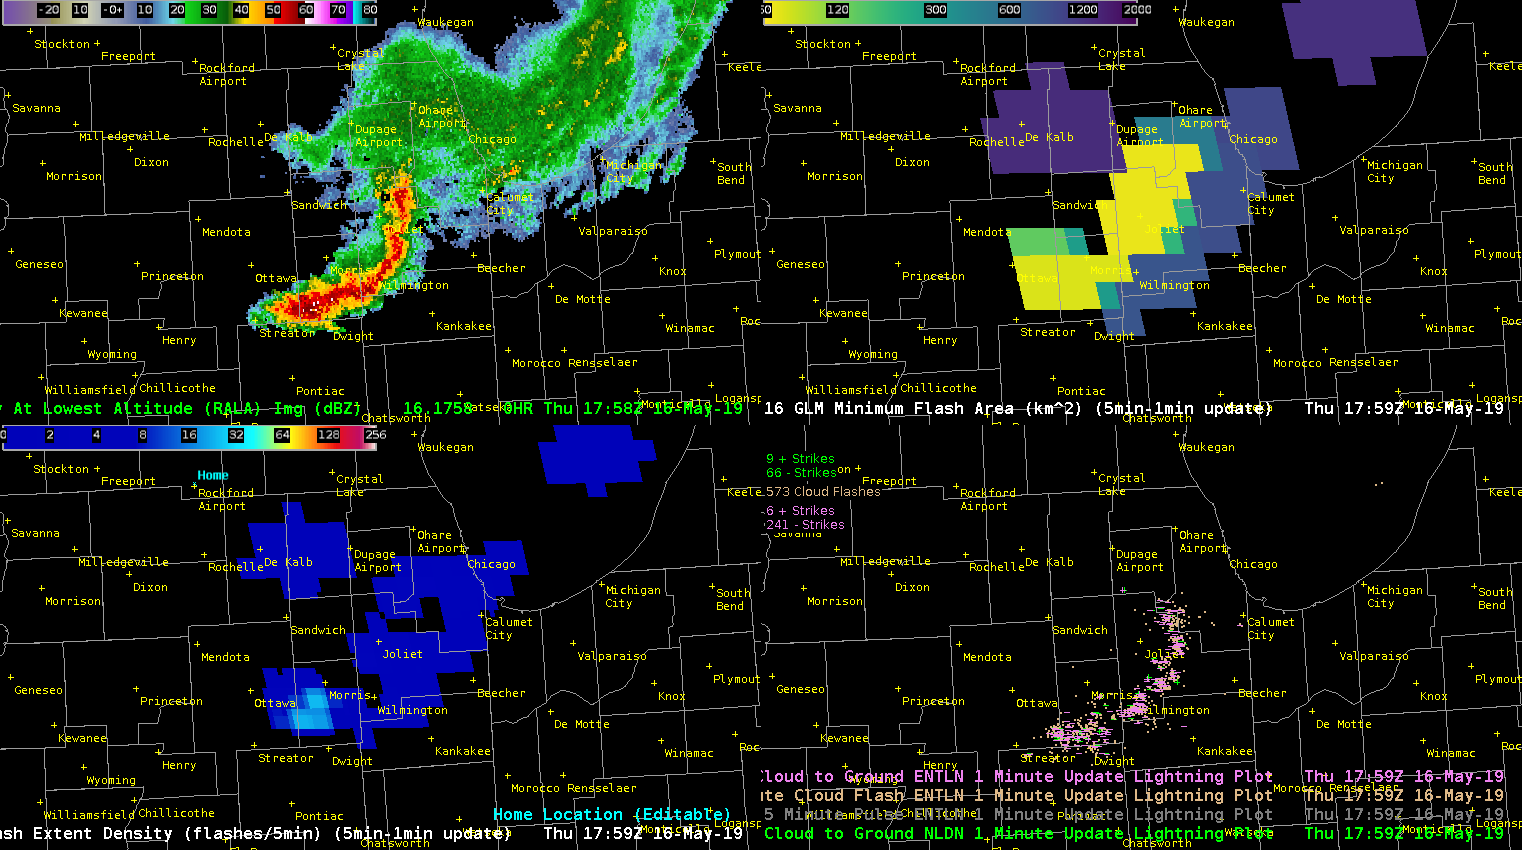
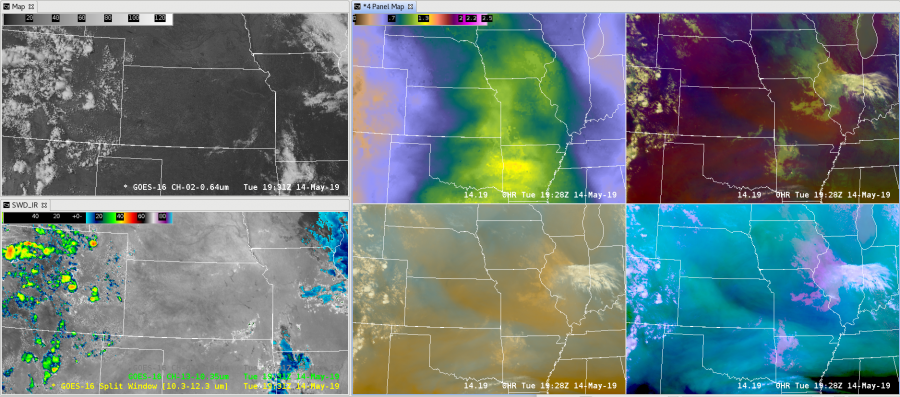
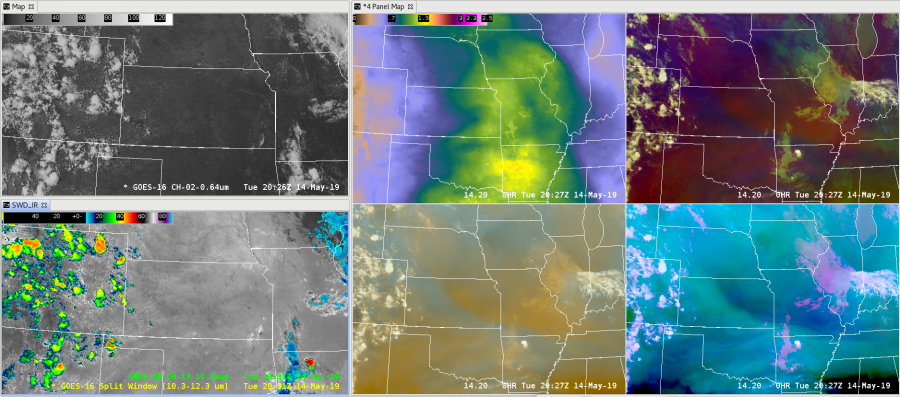
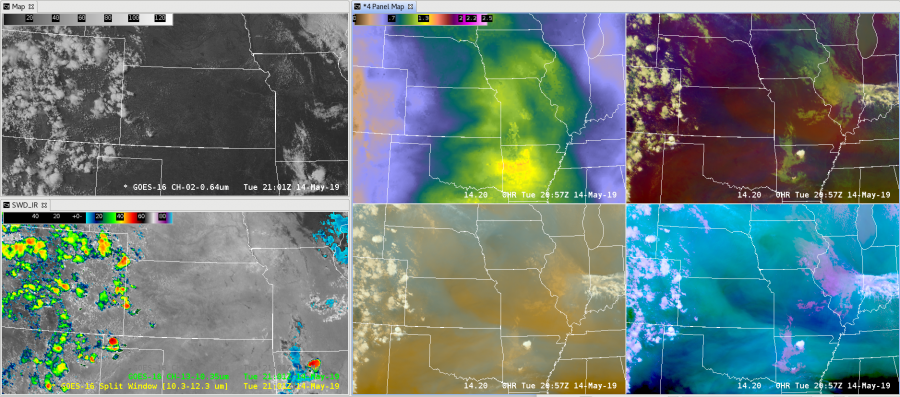
This post will ask more questions than make assertions 🙂 We currently see evidence of a weak above anvil cirrus plume (AACP) based on the GOES-16 Sandwich RGB (upper left) and CH02 visible (upper right). Total Optical Energy from GOES-16 (GOES-17) is plotted on the lower left (right). For reference, three of the four frames have 5 minute ENTLN data.
I’ve wondered if an AACP could extinguish a significant amount of Total Optical Energy (TOE) if lightning was occurring underneath. There are too many caveats here to draw any conclusions, such as:
- Extreme viewing angle for both GOES satellites resulting in significant parallax.
- A large viewing component of the sides (instead of just the tops) of the storms, resulting in possibly large and highly variable reflectances that might be harder to calibrate TOE against.
- Uncertainty regarding ENTLN efficiency and accuracy this far at the fringe of the ground network.
So, with all of that being said, what we see here is interesting. ENTLN does show two areas of lightning. GOES-16 picks up on the western area but not the area under the plume (at least not at first). GOES-17, on the other hand, has a better grasp on there being two areas throughout.
I hypothesize that GOES-16 is struggling more in this particular scene because of the large reflectance and possible forward scattering issues that GOES-17 is not as susceptible to at this particular time of day.
Again, this is not a great setting to test any hypothesis about how much an AACP is able to throw a blanket over GLM detections. However, I’m confident that next week will provide many opportunities to test this with extremely stout AACPs at far more optimal latitudes.
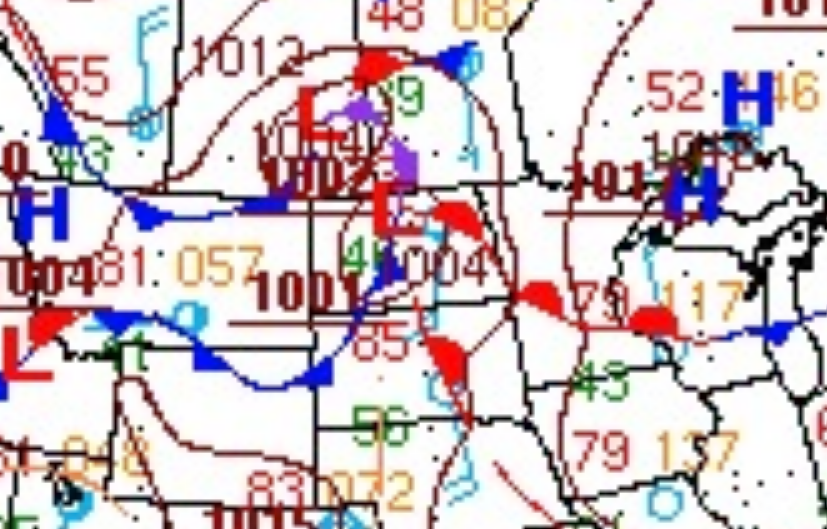
#MarfaFront


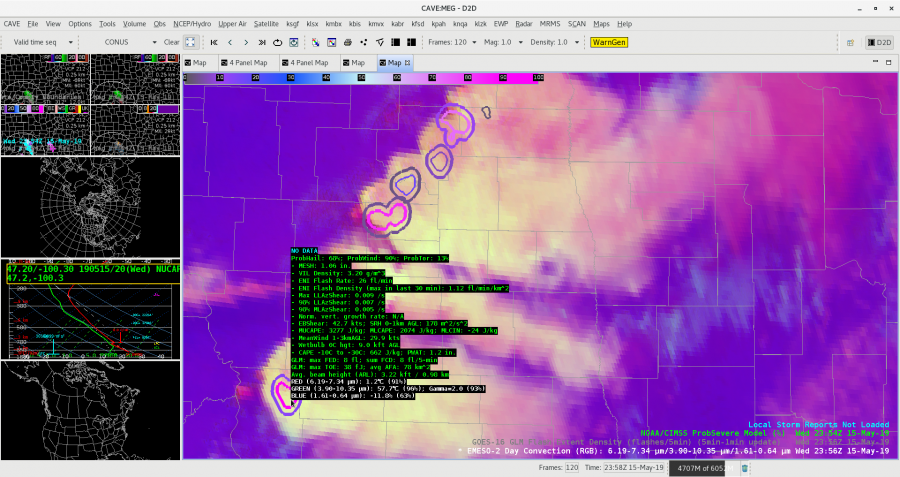
 The tornado component of Probsevere jumped significantly before the tornado touchdown. At 1944Z the probability was at 7%, then quickly increased to 46% by 1948Z and peaked at 54% at 1952Z.
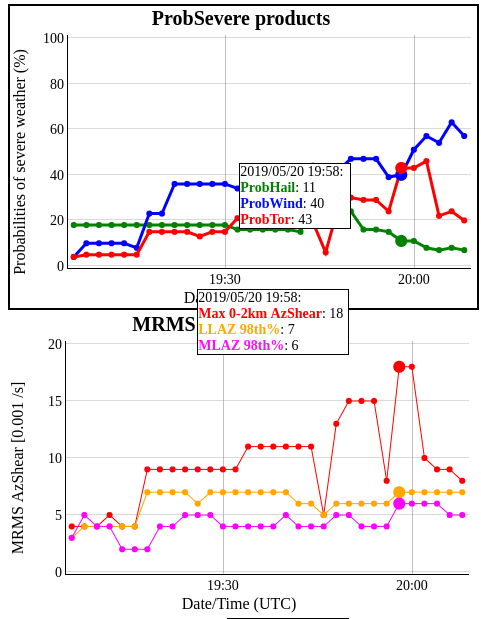
 Thru the period the SVRProb and SVRtor seemed to regularly over warn during this outbreak, BUT SVRHail was spot on, a little False Alarm-y, but it sure didn’t miss the Large Hail reports, with %s >90 both instances. The RGB Day Convection GOES product seemed to respond pretty well with the hail instances as well.