
It’s becoming increasingly evident that 3D-VAR’s maximum composite updraft and max divergence above 8km can be utilized as a good “head’s up” display of the largest storms on the scope. This can be seen in the image below.

Official websites use .gov
A
.gov website belongs to an official government
organization in the United States.
Secure .gov websites use HTTPS
A
lock (
) or https:// means you’ve safely connected to
the .gov website. Share sensitive information only on official,
secure websites.

Real-time posts made during testbed nowcast and warning operations.
It’s becoming increasingly evident that 3D-VAR’s maximum composite updraft and max divergence above 8km can be utilized as a good “head’s up” display of the largest storms on the scope. This can be seen in the image below.
As described in this blog a few hours ago, storms developed S of Pecos due to ongoing diabatic heating in an environment modestly supportive for strong/isolated severe pulsating storms. Thunderstorms rapidly grouped in a loosley organized convective cluster, which gradually approached the NM boarder during the following hours. At 2300 Z, both IR showed the peak of activity/organization of that cluster with a constant weakening trend thereafter. However, the synthetic one caused a rapid decay of that cluster until 0100Z, whereas real time IR data still indicated a large cluster with cloud top temperatures of below -50 degree celsius at that time. Also, lightning activity was still present at 0100Z with that cluster although a rapid decline was also noticed until 0130 Z. So peak strength was captured well with a too fast decline of the cluster’s strength thereafter.
The synthetic IR did also an outstanding job in highlighting the area of initiation (both timing and the region…not shown).
 Helge
Helge
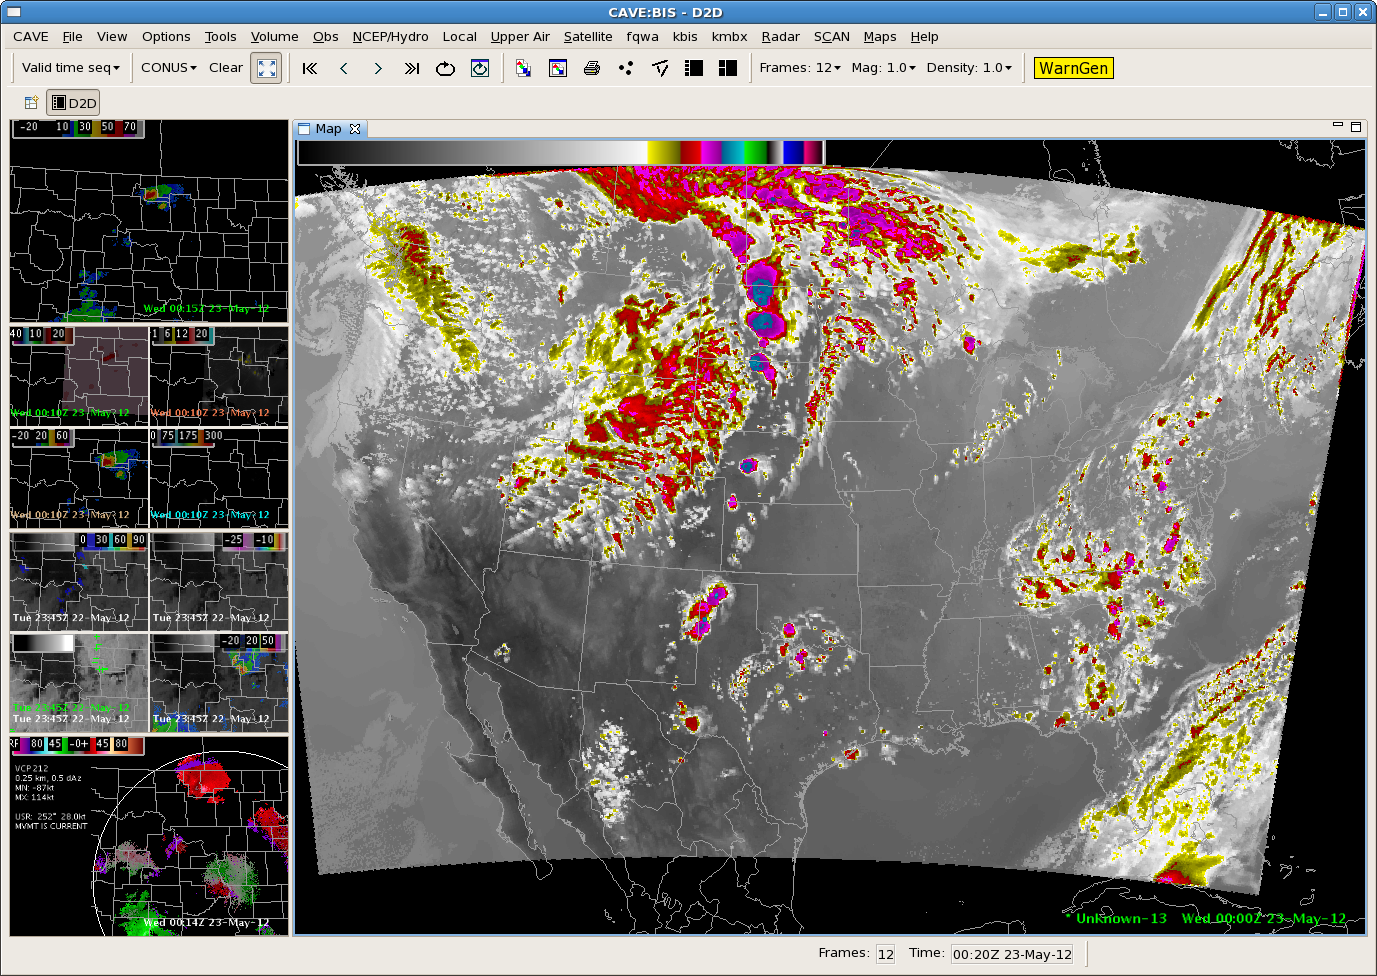
Refer to the northern-most storm in the below images. Between 0045 and 0100 UTC, explosive thunderstorm growth occurred southwest of BIS, rapidly becoming severe as evidenced by 50-60+ dbz well above the -20 and -30C heights and mid-level rotation per BIS SRM. 3D-VAR products such as maximum composite updraft speed and max divergence above 8km picked up on this explosive thunderstorm growth, as shown in the 4 images below.


 MR/MS MESH showed up to 2.76 inches with the stronger of these two cells. The cell to the southeast produced golf-ball sized hail, per spotter reports. This would lead me to believe that the stronger cell is no doubt producing large hail and I would feel confident issuing a strongly-worded SVR.
HIRSCH
Broad upper low, situated over the far NW US, pushed eastwards during the afternoon hours and onwards. A sharp 100-120 kt high-level jet also translated to the east over the N-C Rockies with the favorable left exit region approaching our area of interest over NW Dakota at 19Z onwards. The airmass composite image was helpful in pinpointing the position of the jet max as a sharp moisture gradient evolved (roughly extending from Oregon to Wyoming). Initiation over far NW Dakota also awaited the approach of the “ozone-rich” airmass (purple) as it overtook the eastward progressing dryline between 19-22Z, fostered by reports of surface dewpoints in the mid 50s beneath rapidly drying mid/upper levels.
The first image captured at 1900Z:

and the second one at 2200 Z with initiation already underway/building SE-wards:
 Helge
Helge
As would be expected, 3D-VAR struggles at greater distances from the radar. A fairly large supercell thunderstorm that had a history of producing brief tornadoes was at 12-15kft AGL on BIS 88-D’s lowest slice. It could be implied from base radar products that this storm had a powerful updraft, modest to strong mid-level rotation and strong storm-top divergence. However, since the storm was too far from the radar, 3D-VAR products such as max updraft composite, updraft helicity, updraft vorticity and max convergence above 8km appeared much weaker than what was likely reality.

CIRA/CIMMS NSSL-WRF Simulated IR Satellite suggested convection would develop across central portions of ND and further south towards the border of SD.
Actual Real-time IR is below. Placement of the cells is off somewhat. Biggest discrepancy is across central portions of ND, where convection still hasn’t initiated.

HIRSCH
Several severe hail-producing supercells formed early this evening across northern South Dakota. Reports of up to golfball size hail were received. Here, we will focus on some 3DVAR products.

We want to draw your attention to the lower panels (the image was at 00Z). The panel on the left clearly shows three distinct updrafts associated with each of the supercells. The panel on the right shows the magnitude of the vorticity associated with each updraft very distinctly. Let’s look at the next image, 0015Z:

Look at the bottom panels again. You can clearly see the middle and southern storms have merged into one homogenous cell, especially in the updraft image on the left.–Gordon Strassberg for WFO ABR.
From WFO ABR…recall our previous post about the NSSL-WRF SimSat development of thunderstorms just south of the North Dakota border by around 00Z. We have verification!

There has been little action so far along the dryline across South Dakota so far this afternoon, despite MLCAPE peaking at 2500-3000J/kg and good convergence along the dryline and a possible dryline bulge per the SPC Mesoscale Analysis at 22Z:

Last night’s 00Z NSSL-WRF SimSat product indeed shows some isolated development along the dryline across northern South Dakota close to 00Z:

As of 23Z, a few showers have developed across central South Dakota, near the small dryline bulge, but no lightning has been observed yet.
