An official website of the United States government
Here’s how you know
Official websites use .gov A
.gov website belongs to an official government
organization in the United States.
Secure .gov websites use HTTPS A
lock (
) or https:// means you’ve safely connected to
the .gov website. Share sensitive information only on official,
secure websites.
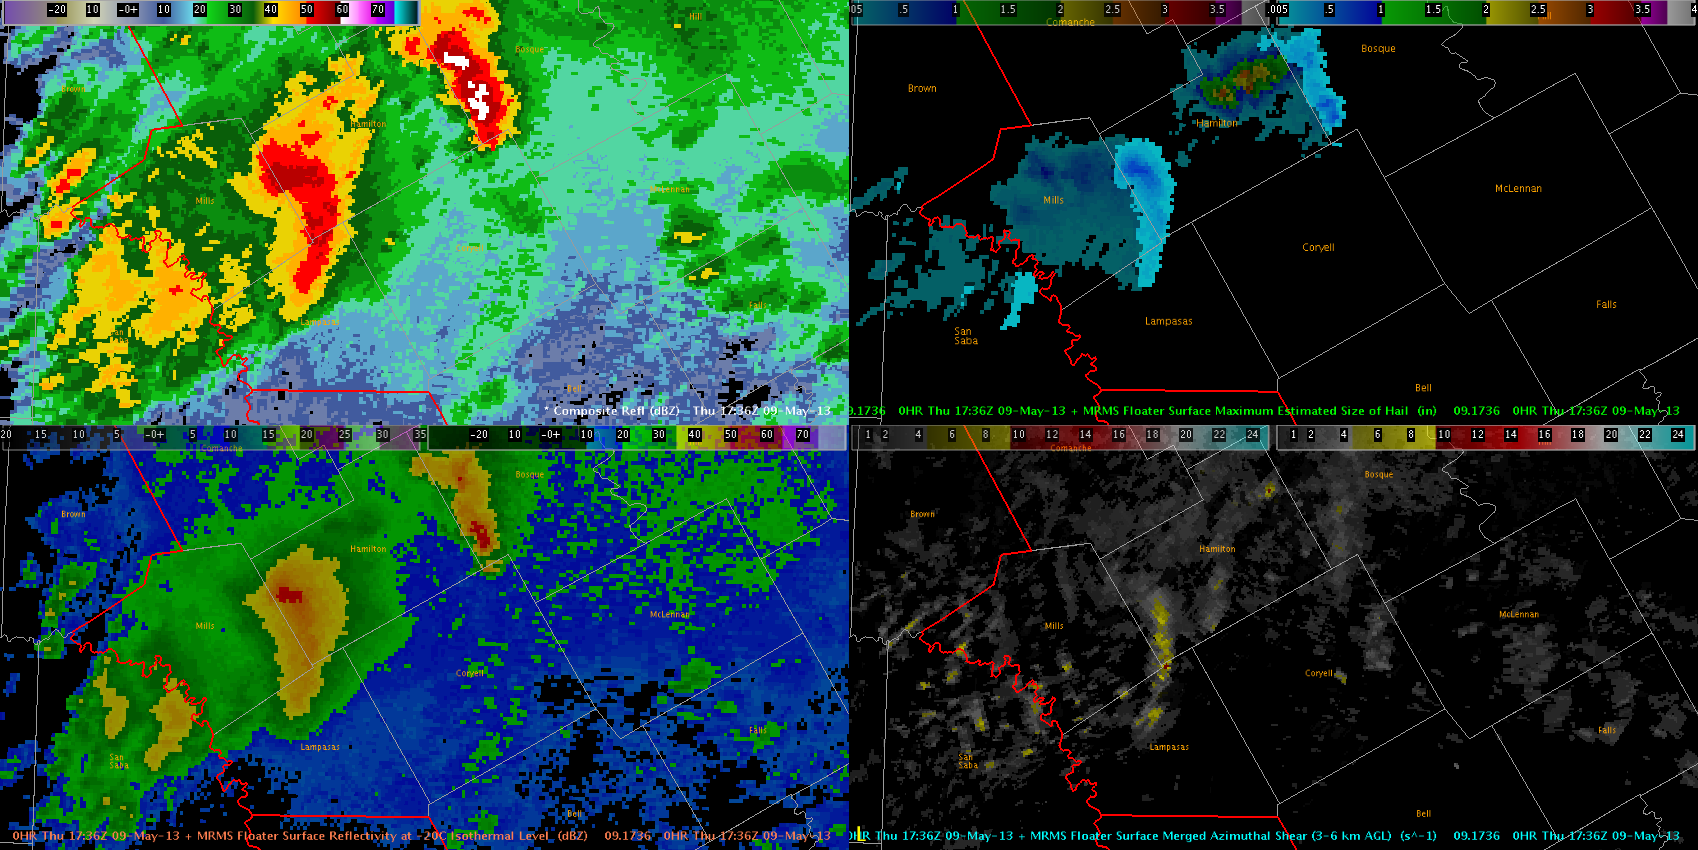
The four panel image below shows composite reflectivity (upper left), MRMS MESH (upper right), reflectivity at -20C (lower left), and merged azimuthal shear (lower right). One can quickly compare the bowing segment on radar and quickly relate that to the azimuthal shear image. With somewhat high values along the leading edge of suspected winds, this may be useful in monitoring areas of damaging winds in bow echoes and squall lines.
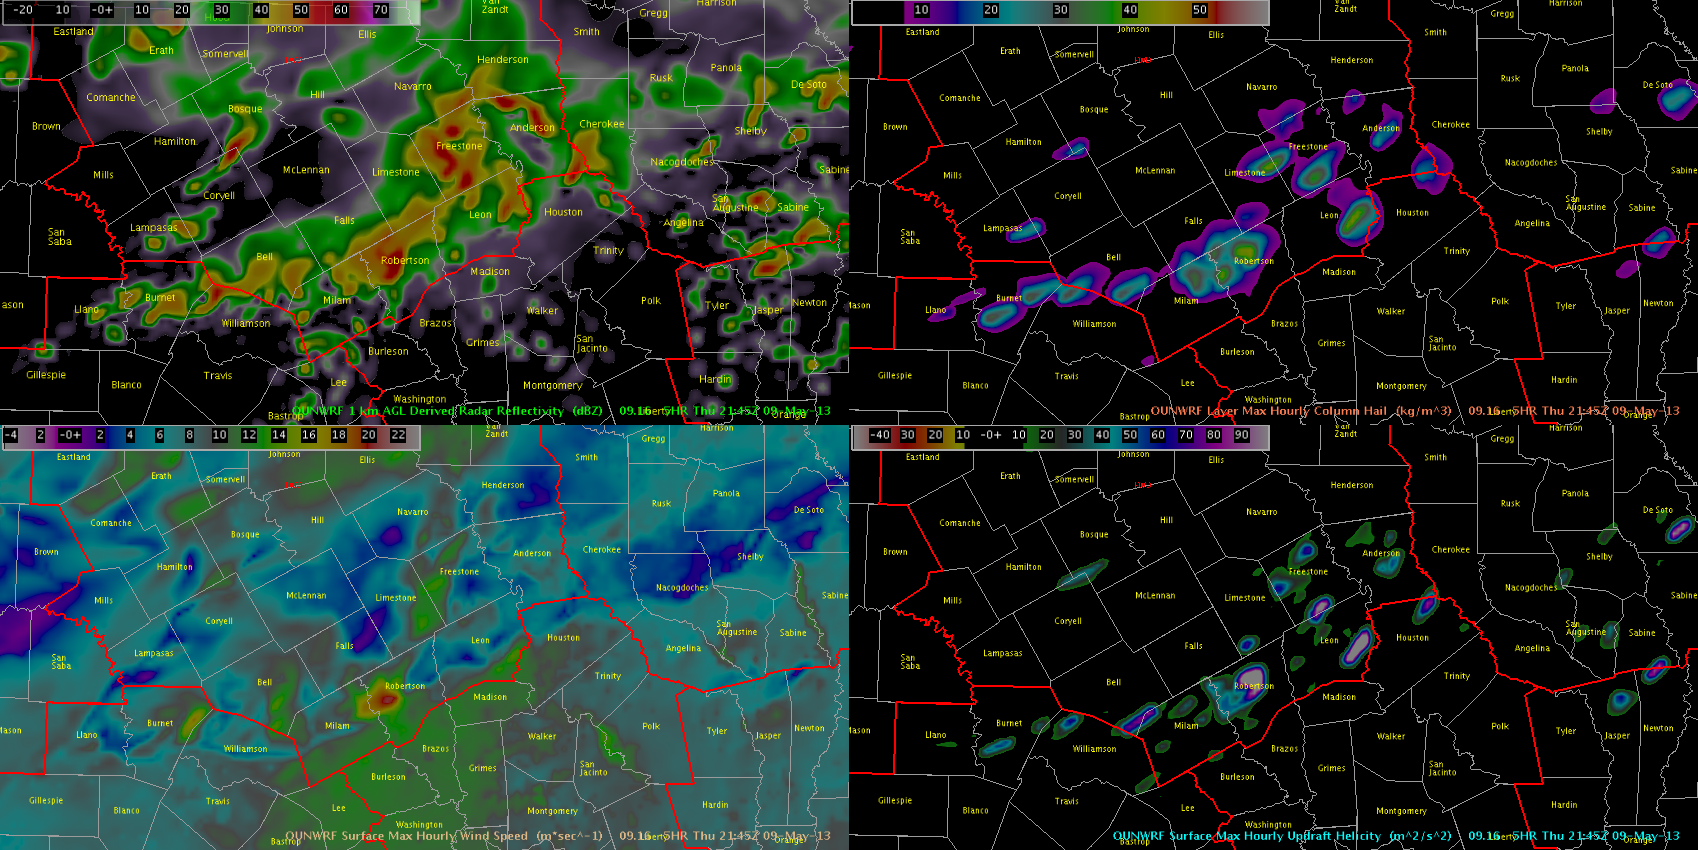
The 4-panel image below shows 1km refl (upper left), Max column hail (upper right), Hourly max wind speed (lower left), and Max hourly updraft helicity (lower right). This run of the OUNWRF (16z) shows a high concentration of training supercells over far southern parts of the FWD CWA. This can be denoted via the updraft helicity and hail fields. Values of updraft helicity exceeding 80 would suggest at least some tornado potential with these cells. We will wait and see what unfolds later today across this area.
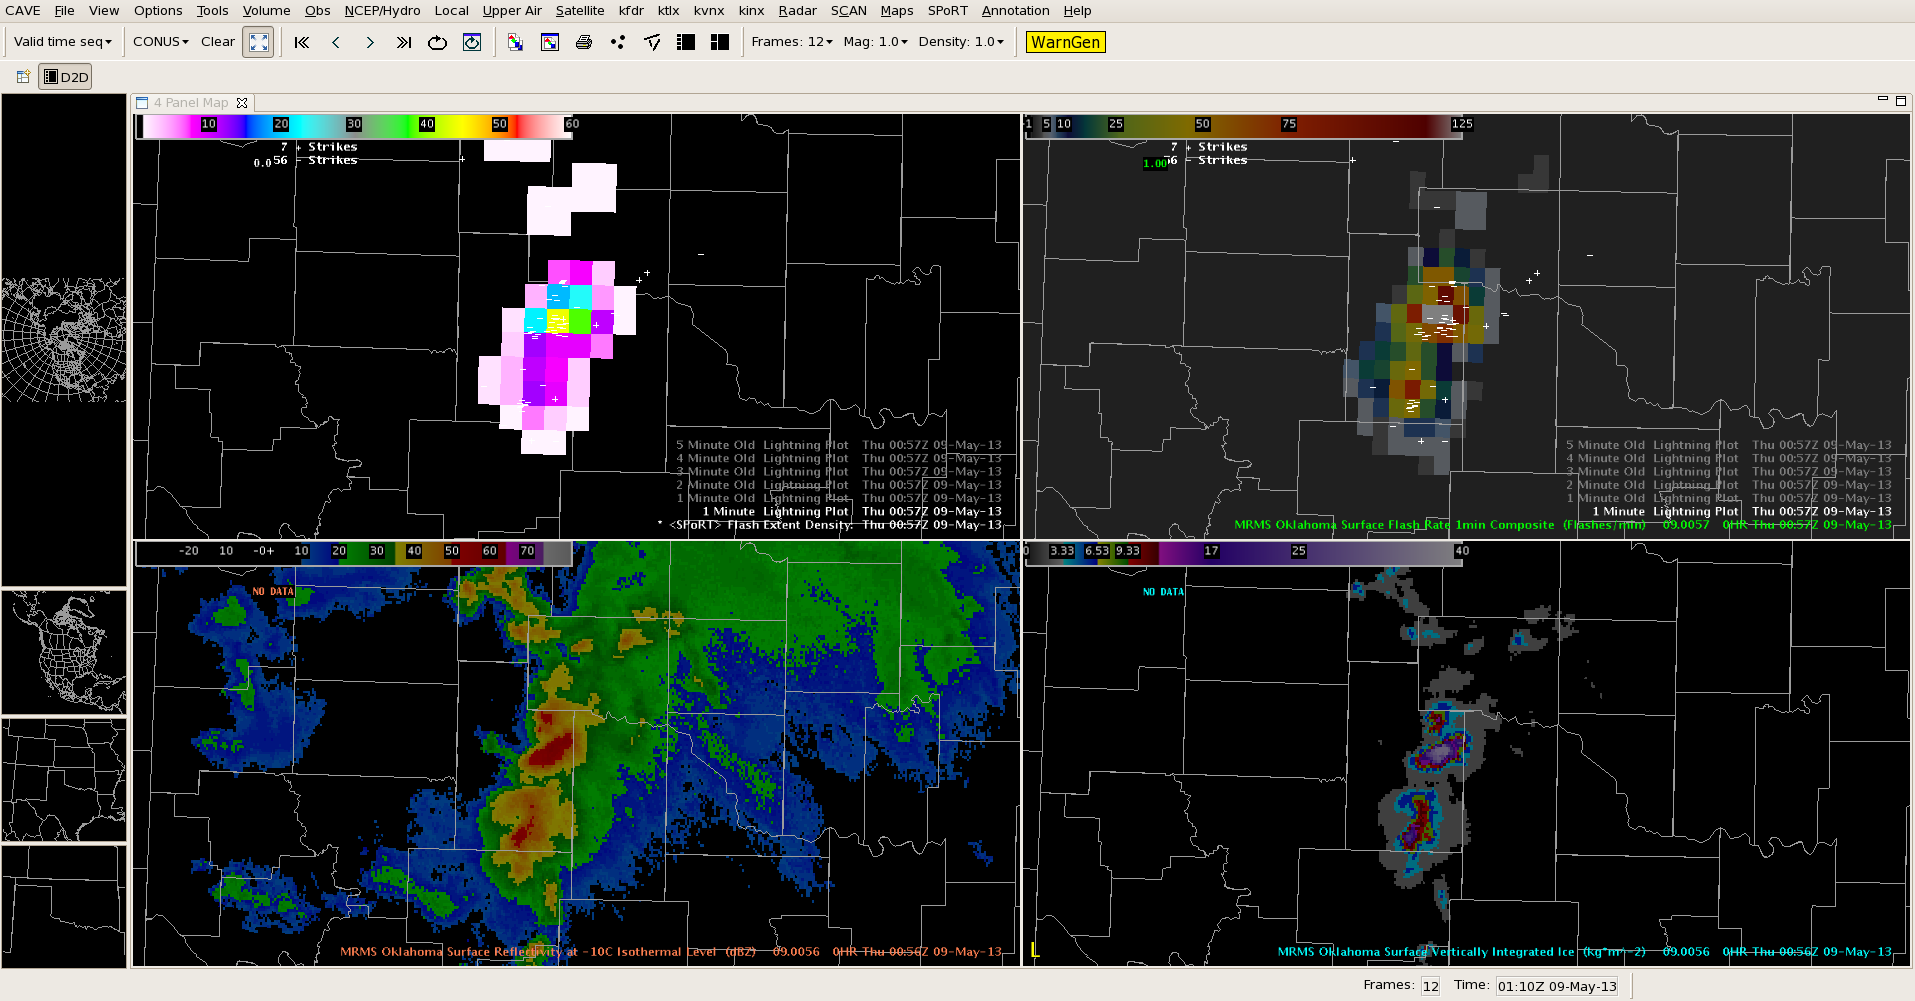
The 2013 Experimental Warning Program (EWP) has offered a great opportunity to test the NASA SPoRT / MDL total lightning tracking tool. Part of EWP’s efforts are to demonstrate future GOES-R capabilities, such as the Geostationary Lightning Mapper. This is being done with the pseudo-geostationary lightning mapper products being produced by NASA SPoRT in collaboration with seven ground-based total lightning networks. With total lightning observations (intra-cloud and cloud-to-ground) forecasters are looking for lightning jumps, or very rapid increases in total lightning activity ahead of severe weather. In the past, this has been done by visually inspecting the PGLM data. From previous evaluations by both SPoRT and the EWP, the number one request was for a way to visualize the time series trend of total lightning in real-time. With AWIPS II and the ability to create custom plug-ins, the first effort for this has been developed and is now here in operations at the EWP. One design feature was to make this a manual tool. In other words, it is the forecaster who selects the cell track and not an automated tracker, which traditionally has difficulty with merging and splitting cells or not activating at the proper time. Once the forecaster places two points, the tracker activates and will create a track based on these points. Each point can be moved individually to adjust the track and the tracker will attempt to maintain the track as new data are ingested. We wanted to evaluate the utility of the total lightning tracking tool as well as its impact on operations. In only a couple days, the feedback has been great. First, here is an example of the PGLM with the total lightning tracking tool this evening.
The PGLM flash extent density observing a maximum of 49 flashes with the total lightning tracking tool time series (pop-up to left). The lightning jump can be seen early in the time series as it goes from 20 to 49 flashes in two minutes.
Overall, feedback has been very positive as forecasters have appreciated being able to visualize the time series instead of creating a mental picture. Also, the time series plot is pinned to always be on top, which prevents it from being lost behind the D2D display. Also, the feedback has been very constructive to help improve the look and provide ways to minimize the time impact. Some of the commentary has focused on modest improvements to the layout and look.
Add a minimize button to the time series display pop-up.
Have the time series trend color match the active cell point color for the track.
Have a way to change the default size of the cell point radius of influence (which determine how much lightning data to query).
The feedback also has included very interesting options to save time in implementation.
The tracker initiates after two points are plotted. However, it attempts to extrapolate the cell track after placing one point. This results in the cell points being very spread out. Suggest waiting to extrapolate the track until after two points placed.
Also, when the storms are more discrete, instead of using individual cell points created a small “domain” around the storm cell of interest. The forecaster selects a “polygon” of where the storm will be and the tracker selects the PGLM value within this domain at each time step. This may be able to be done by using the tools similar to how forecasters plot a warning polygon as well as how that can be edited. Furthermore, the storm motion could be added to further aid the plot. The big advantage here is that this polygon may be much quicker to place than several individual cell points.
All of these are very good suggestions and this feedback will be taken back to see what can be implemented. The polygon suggesting is very interesting to consider, while the current cell point method would be most viable in a multi-cellular environment. Additionally, this feedback has been very useful in that it helps refine the total lightning tracking tool ahead of its next evaluation as part of the Operations Proving Ground later this summer.
Tomorrow should be another good day to gather additional feedback.
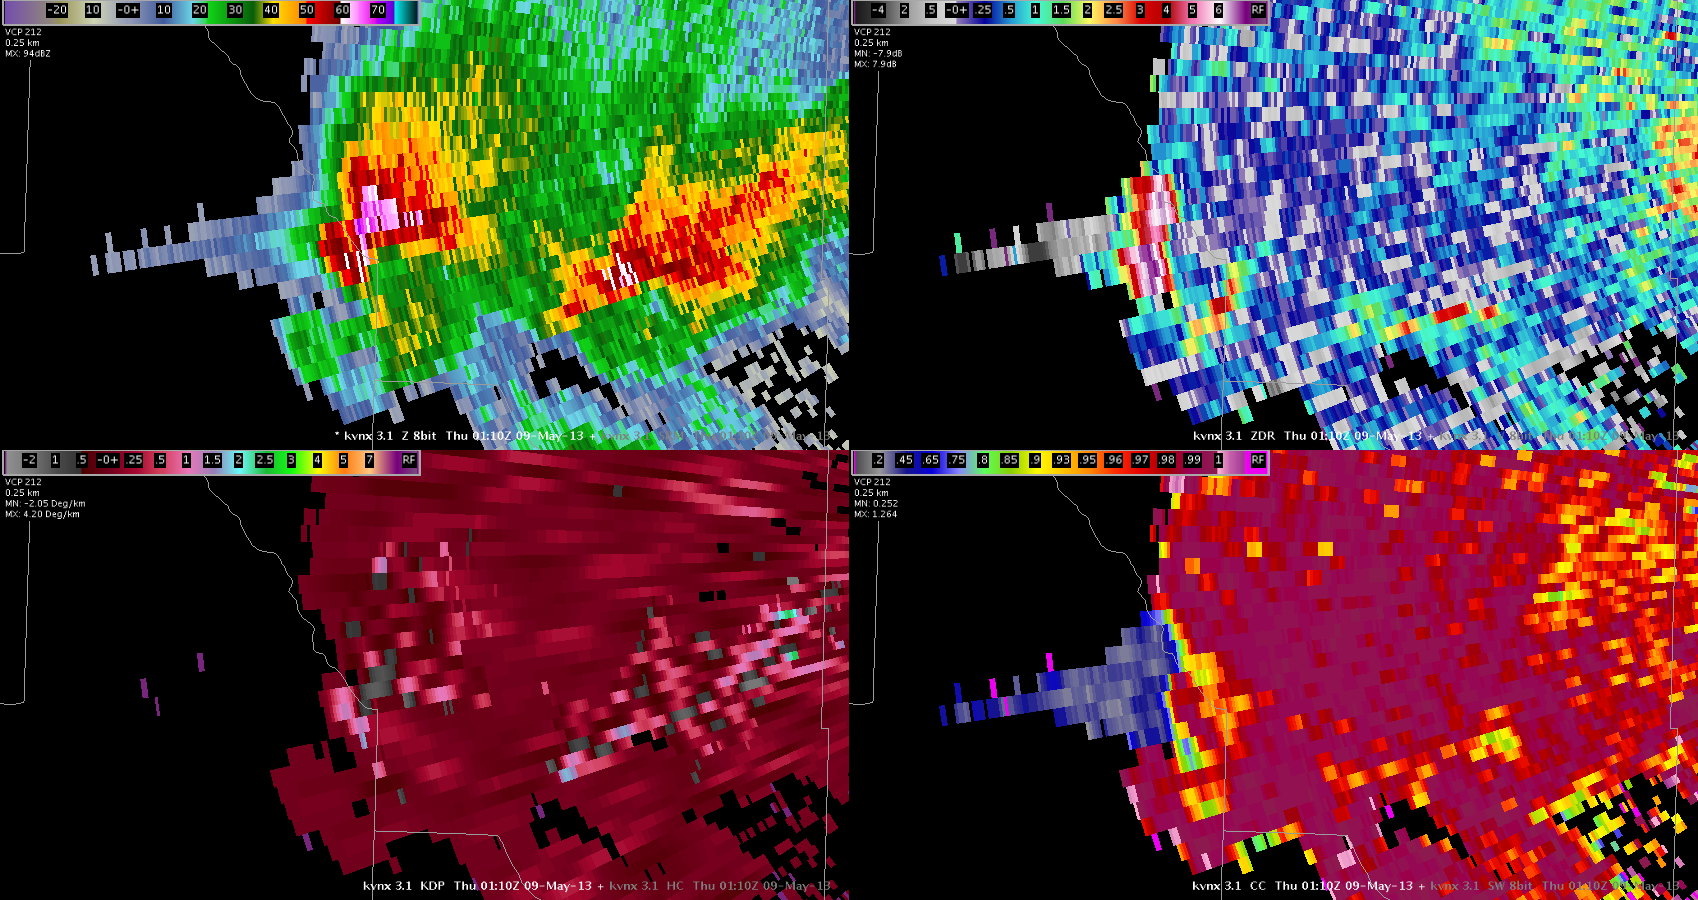
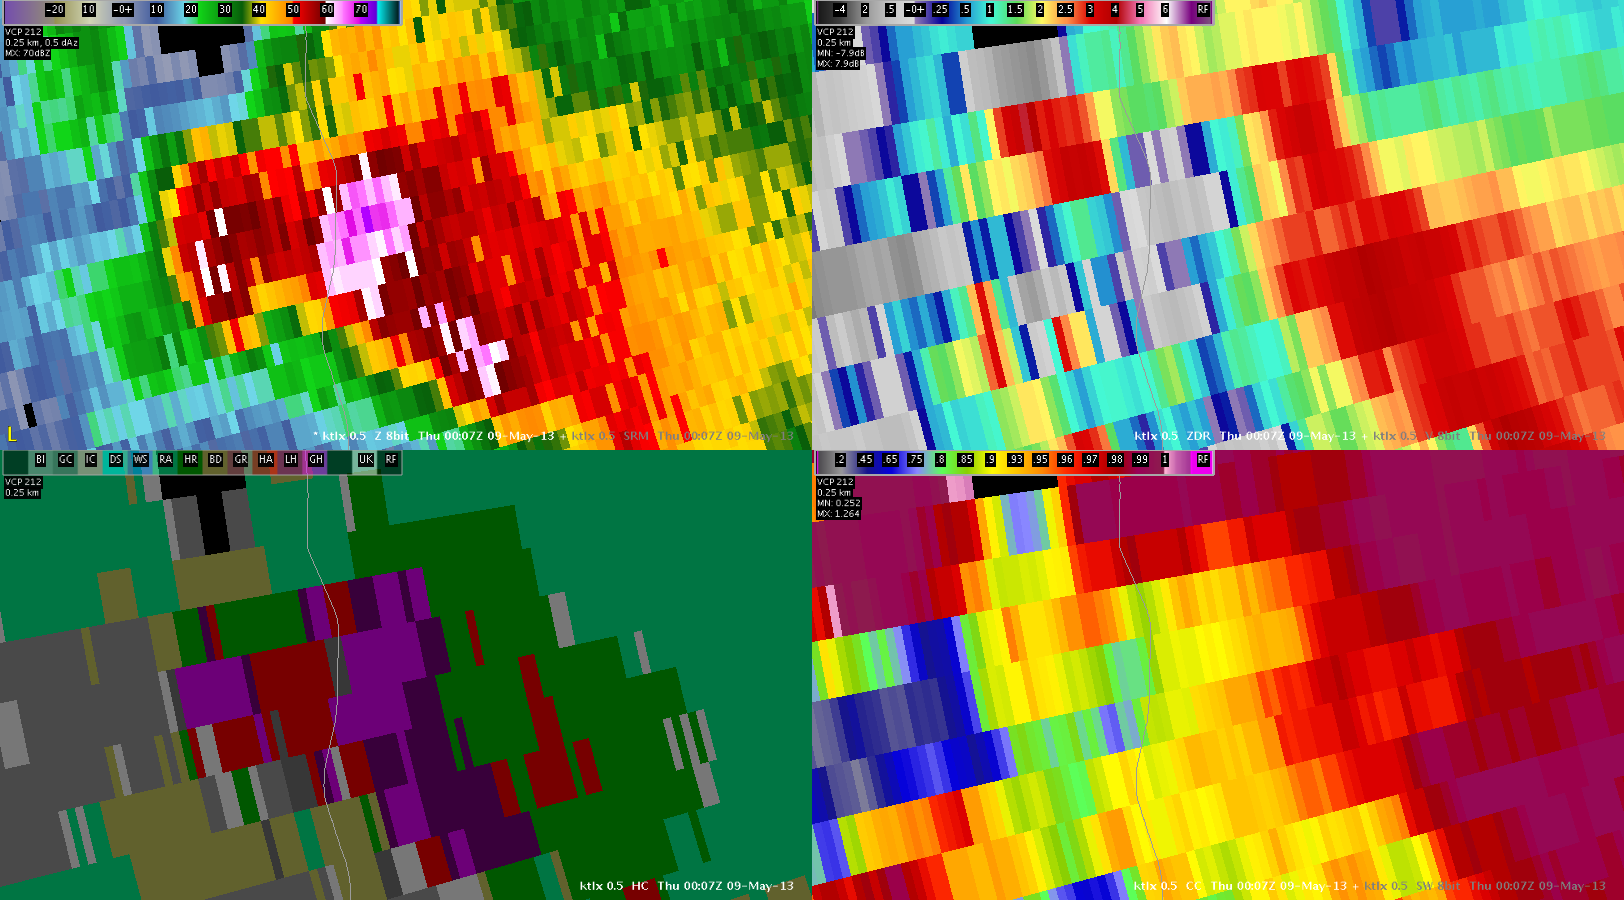
A 3 body scatter spike depicted by reflectivity, differential reflectivity, correlation coefficient, and specific differential phase correlated well with experimental products. MESH in excess of 2 inches corresponded with HSDA depicted giant hail.
4 panel showing a 3 body scatter spike in reflectivity and dual-polarization data.MESH values over 2 inches agreeing with the location of a 3 body scatter spike.Corresponding HSDA depiction of giant size hail.
Forecasters have a couple of different options to view the pGLM data. The recommended way (and for use with the moving trace / lightning trend tool) is to load via the Obs menu. This Flash Extent Density product is created via NASA / SPORT and uses a higher threshold of points per flash (>25 LMA points) than previous calculations based on comparisons of the LMA with the Lightning Imaging Sensor (LIS) from the TRMM satellite. The second (which was used in previous years of HWT activity) is created at NOAA / NSSL using the same raw Lightning Mapping Area data as the NASA SPORT feed, but uses a minimum threshold of 10 pts per flash (a common threshold in the published literature for LMA systems). Each are valid displays, but for obviously different reasons.
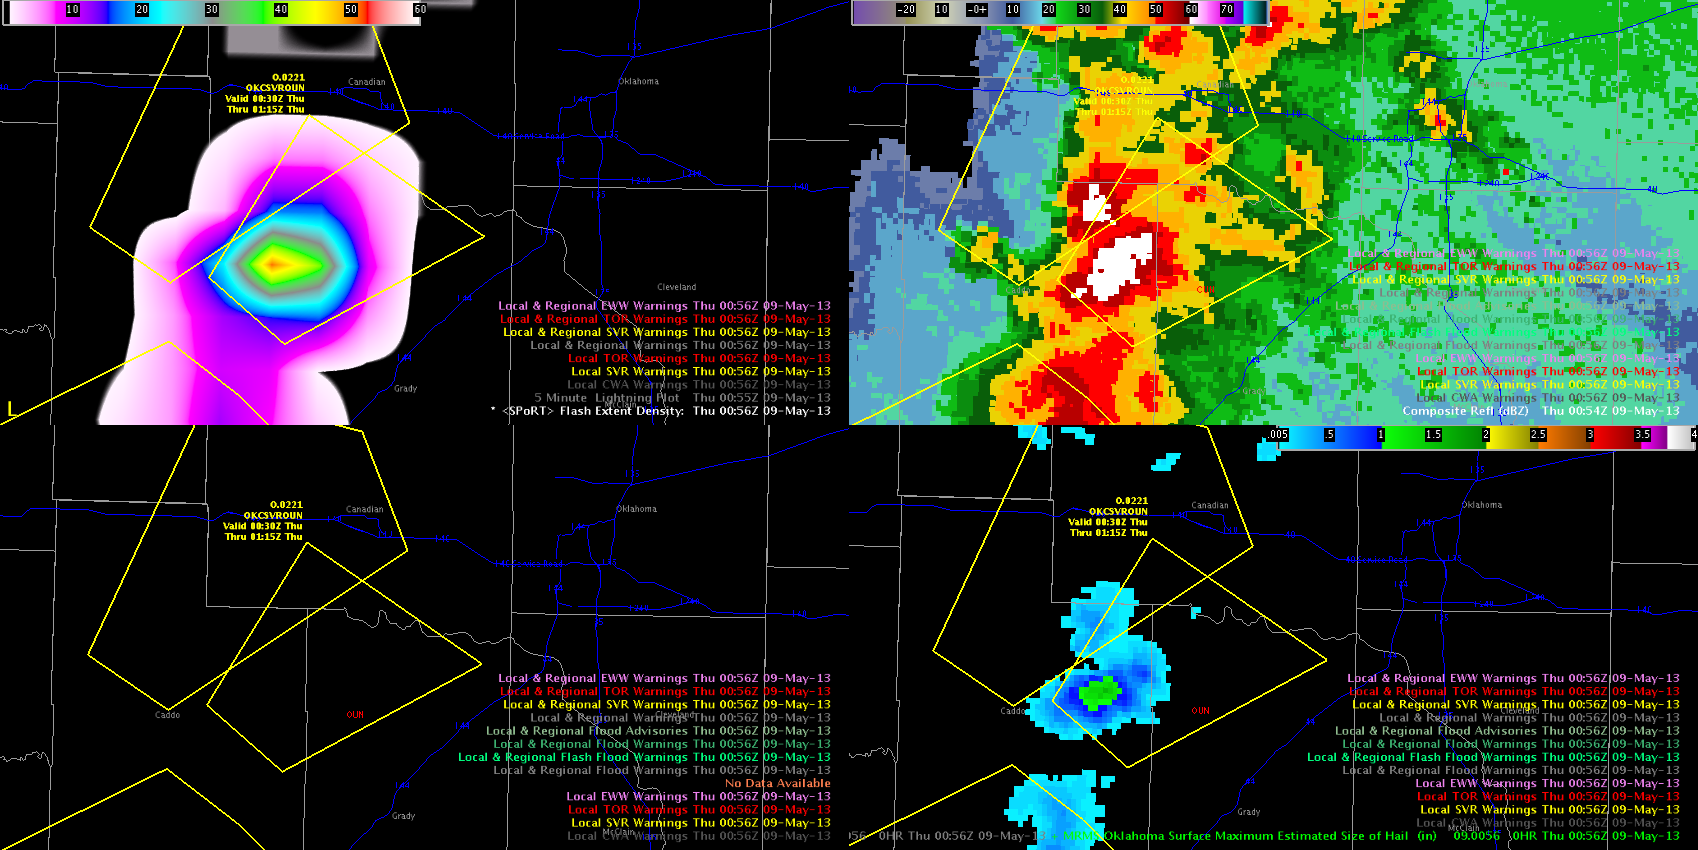
Below is a four panel image of the two pGLM products: NASA/SPORT (left) and NOAA/NSSL (right). The bottom two panels contain multi-radar products: reflectivity at -10C and Vertically Integrated Ice.
pGLM Flash Extent with 1-min NLDN overlaid (top) and MRMS reflectivity at -10C (bottom left) and Vertically Integrated Ice (bottom right) at 0057 UTC on 9 May 2013
peak values on both pGLM plots correspond nicely with max values of the vertically integrated ice (VII) and higher reflectivity at -10C. However, the actual values on the peaks vary greatly, due primarily to the dependance on the minimum number of points per flash. The NASA / Sport system had values as high as 47 flashes per grid box while the NOAA / NSSL (using a much more relaxed minimum) had as high as 125 flashes per grid box.
More research is needed to fully understand what the ground based LMA systems detect (including leader extent, particularly for the real-time, decimated data) compared to the on-board satellite systems such as the GLM.
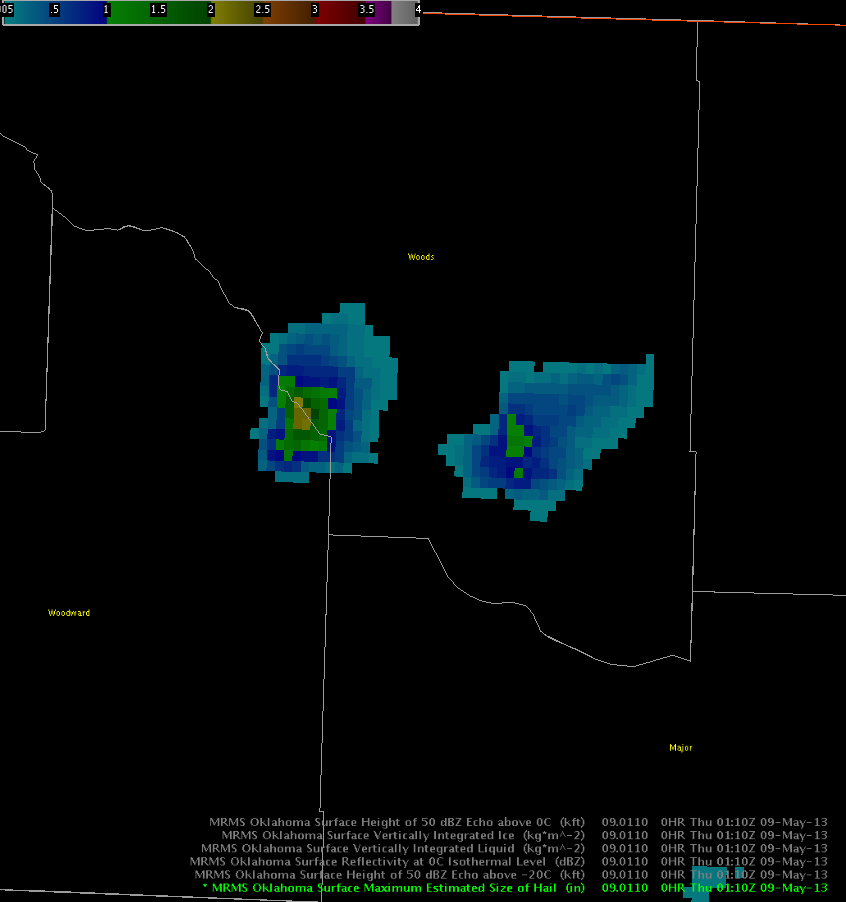
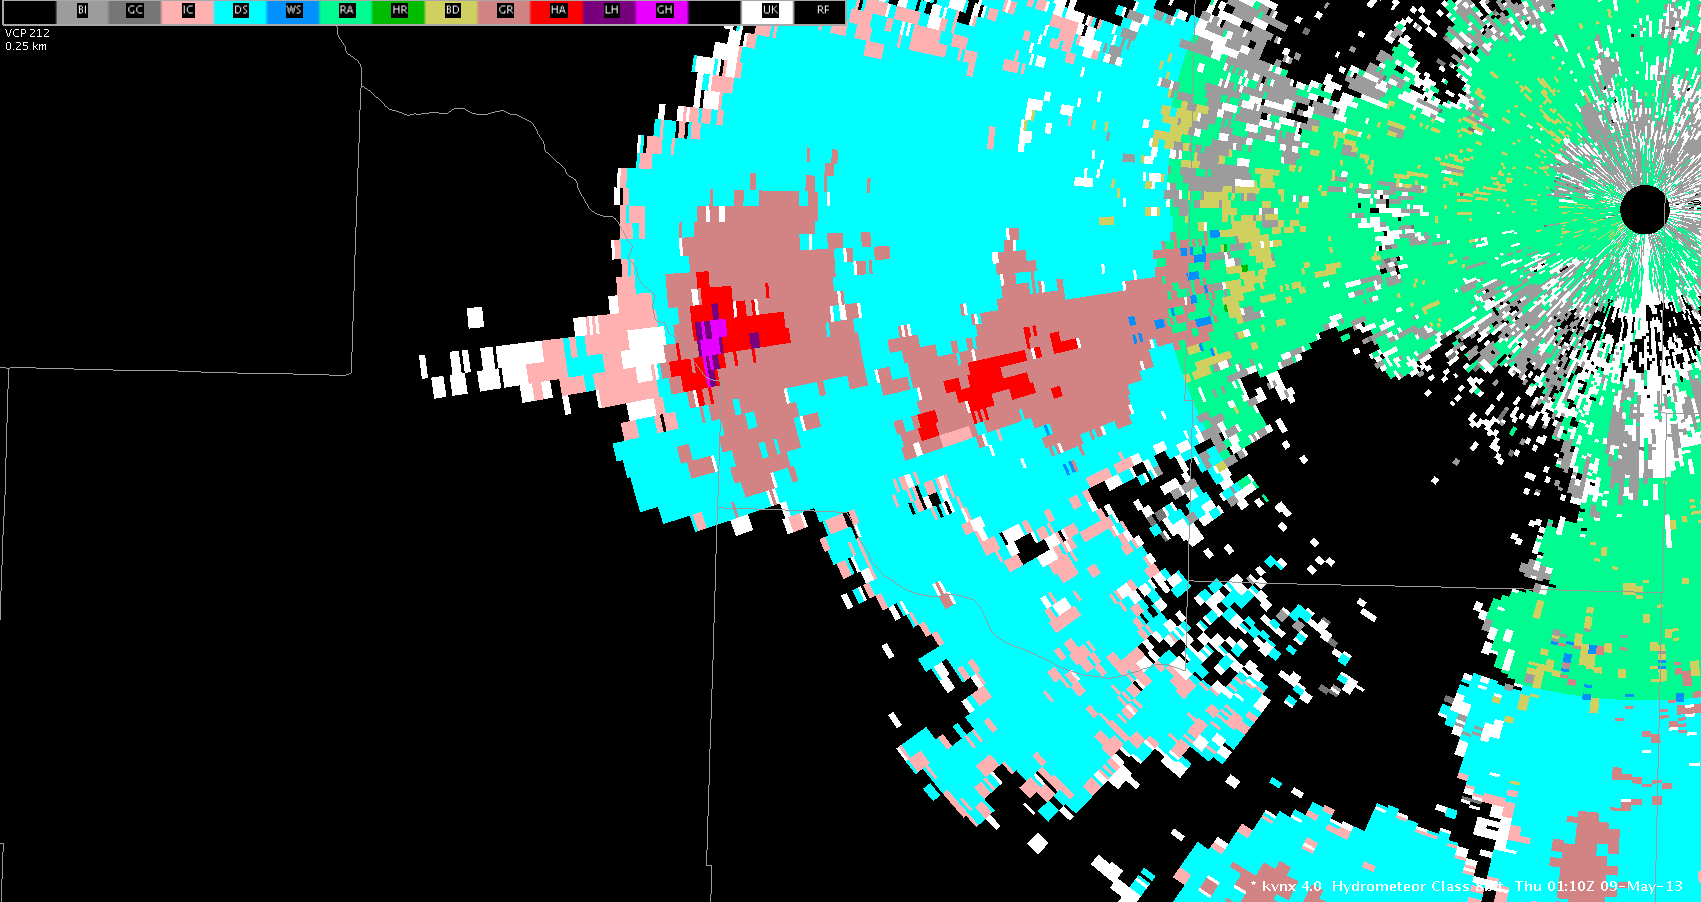
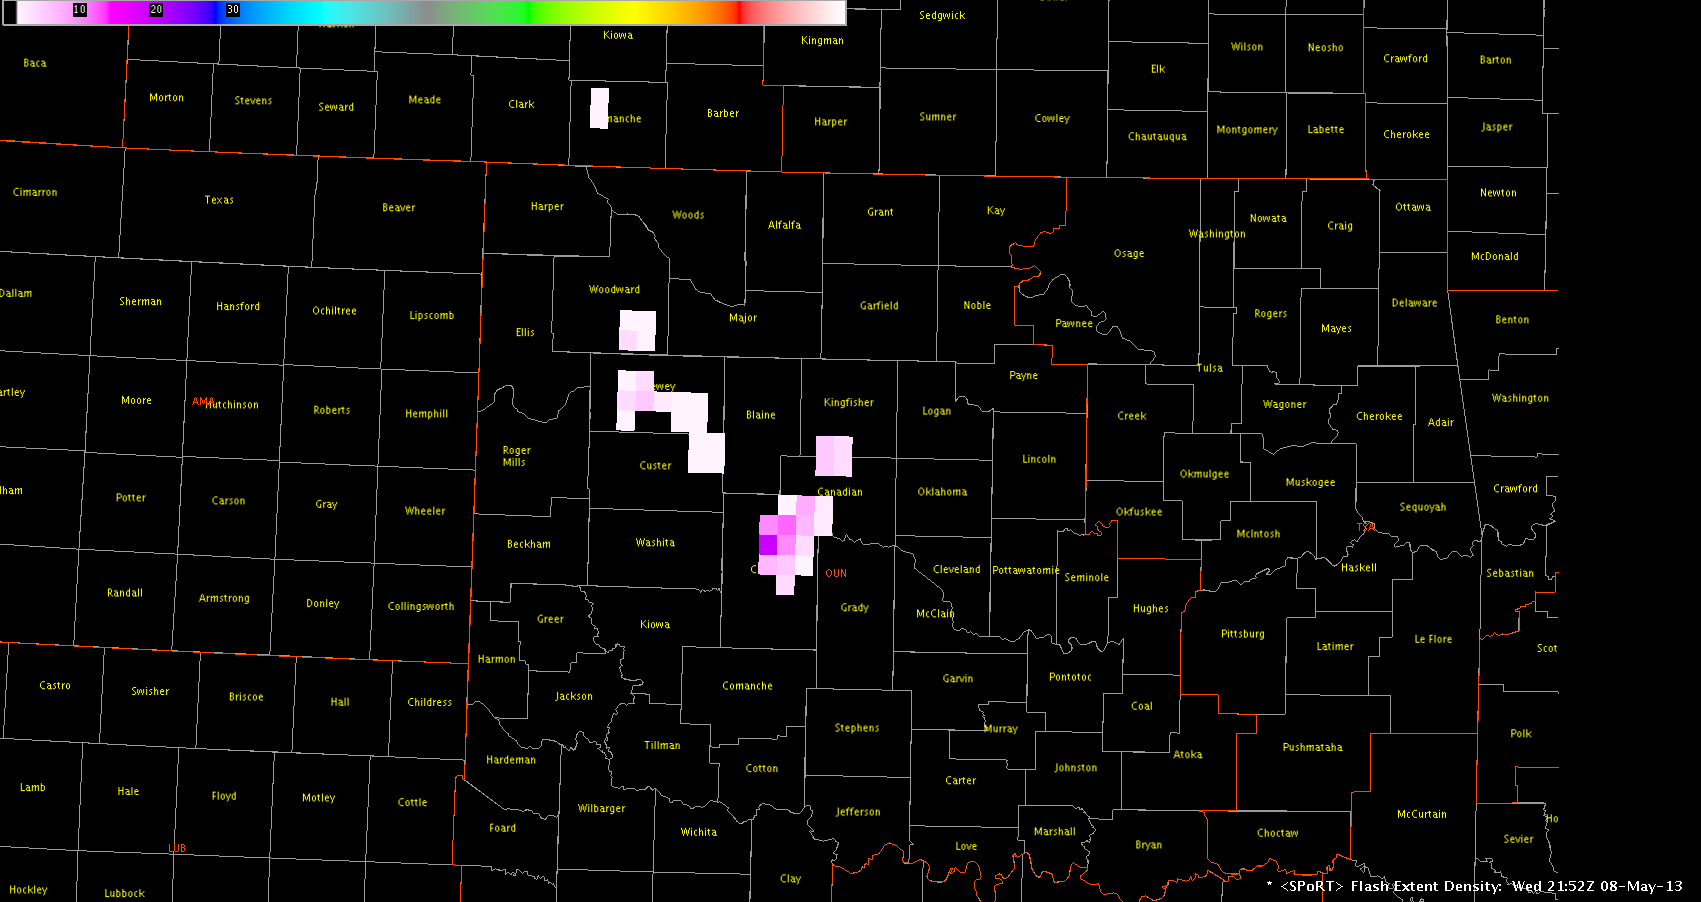
One cluster of storms over southwest Oklahoma produced the most impressive FED signal of the day. While we’ve had a warning out for this storm for some time, no reports have been received, and MESH has kept values generally at or below one inch.
**Update**
One rapidly intensifying cell has shown a lightning jump with up to ~50 flashes/min and is likely producing severe hail per MESH.
While the HSDA has shown many false giant hail signals, it did perform especially well with one of the storms today. This GH signal also corresponded to a MESH value of over 2 inches. Shortly after these signals appeared, a report of 2 inch hail was received, this was after some melting, so the hail may have actually been larger. It appears that the HSDA performs more accurately when close to the RDA and especially with persistent supercellular storm modes. The four panel below displays Z, ZDR, HSDA, and CC. Areas of GH were well correlated with low ZDR and CC. The second image shows MESH from the same time.
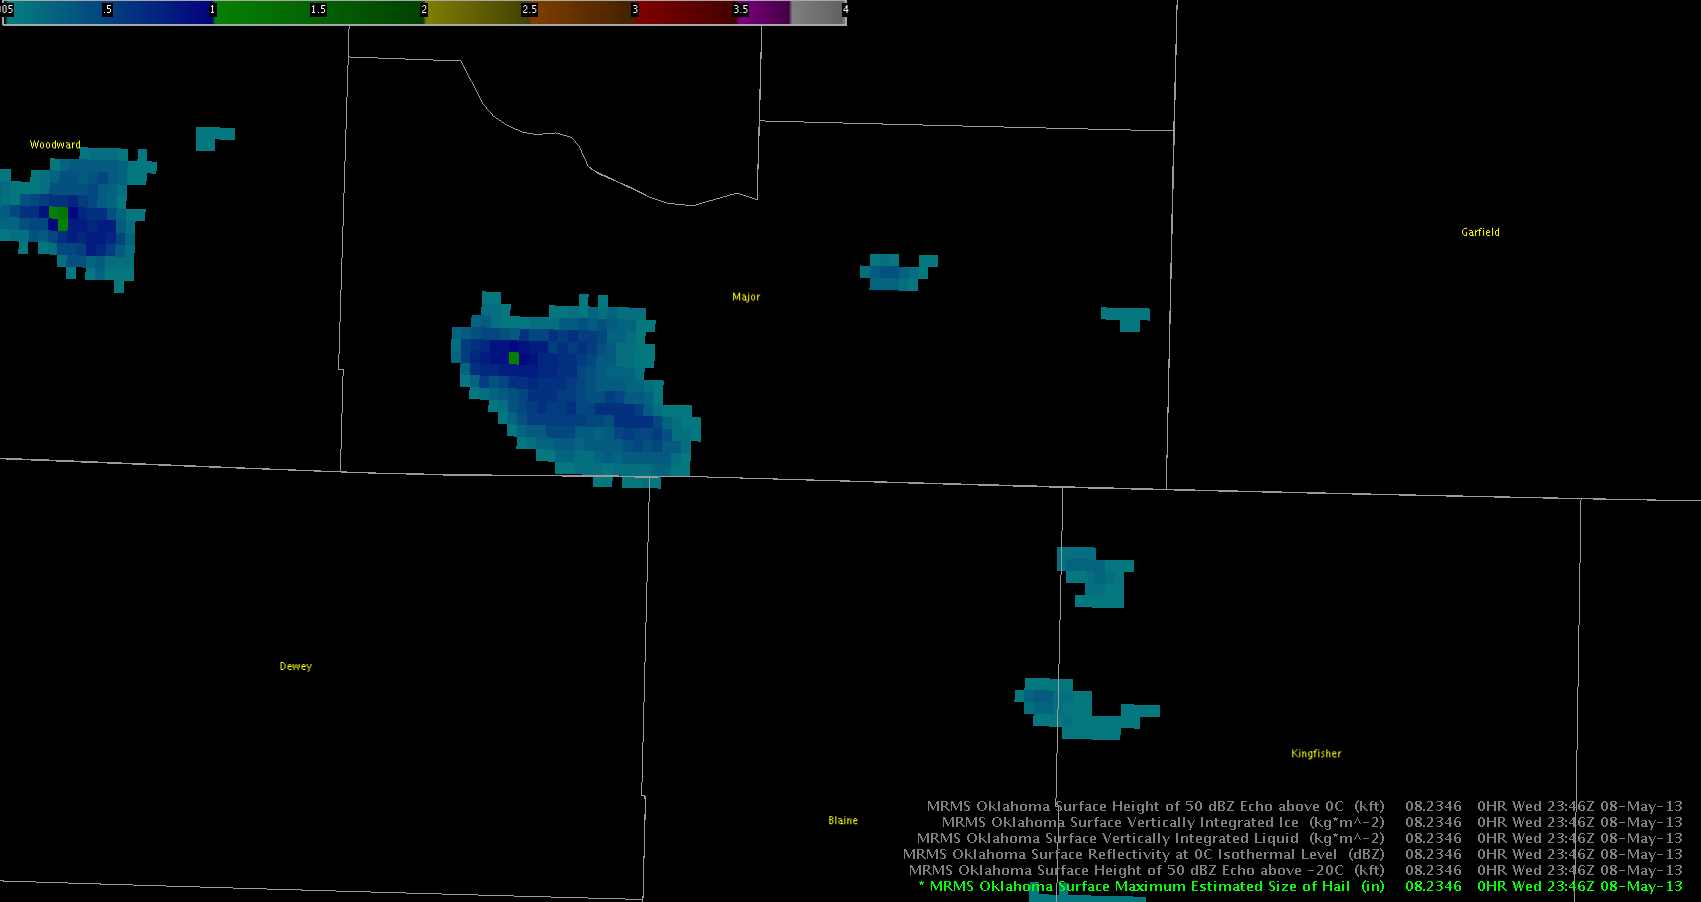
A storm producing reported 2.75 inch hail was estimated by the MRMS MESH product to be dropping only 1 inch hail. This storm was moving right as it continued to develop.
MESH product underestimating hail size by 1.75 inches this evening.
The HSDA algorithm did a good job of keeping a large to giant hail tag on this storm as it became severe and maintained its intensity.
HSDA algorithm diagnosing large to giant size hail for a storm reporting 2.75 inch hail.
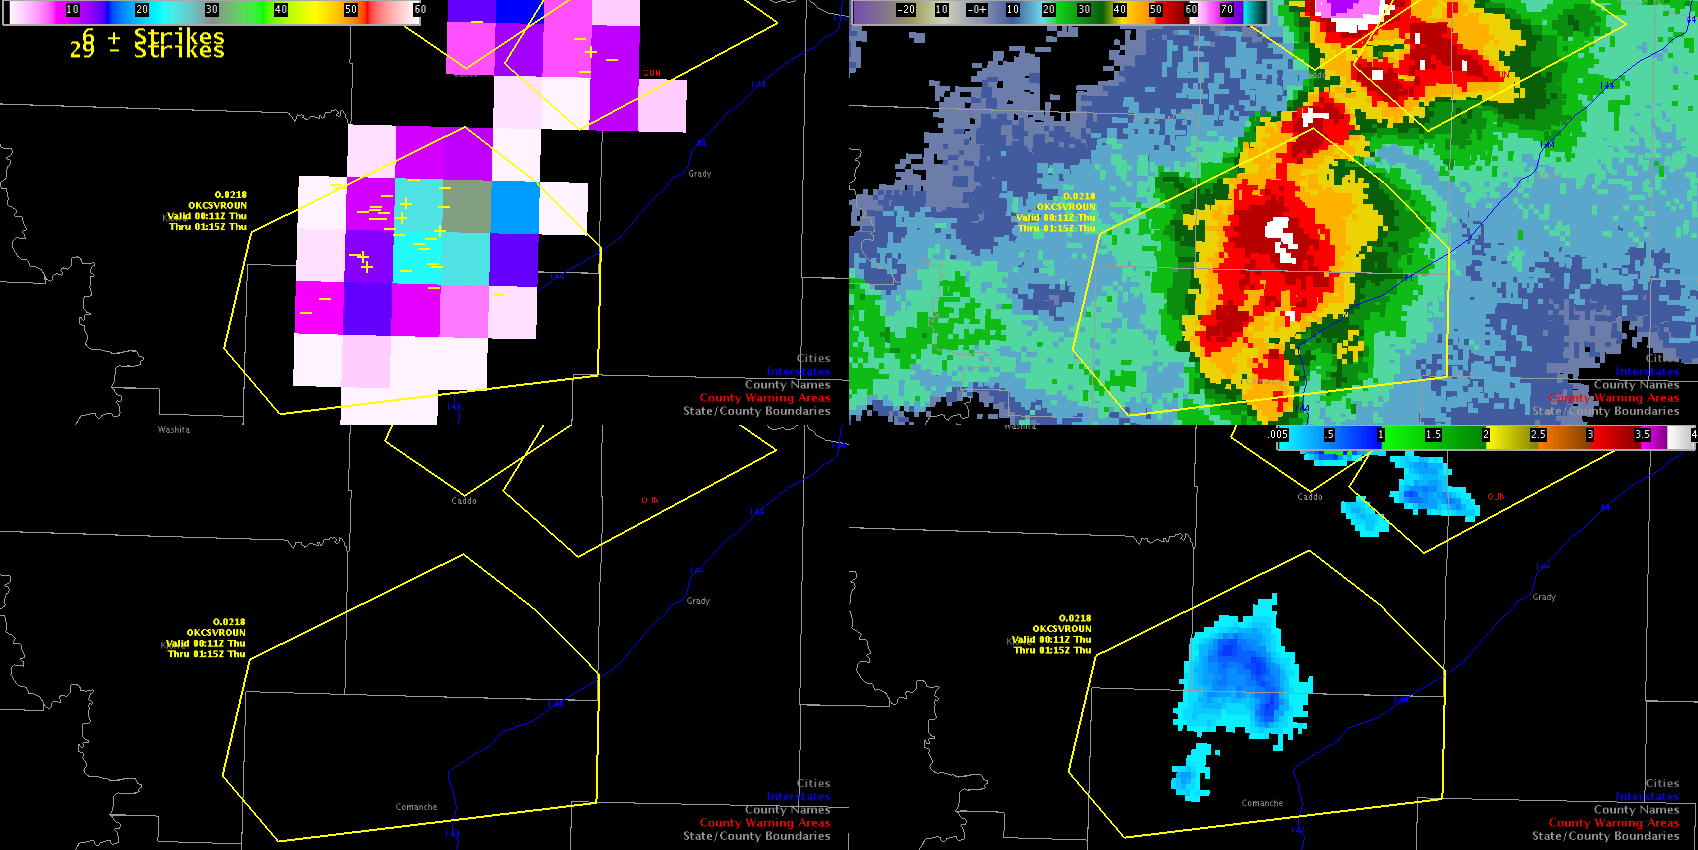
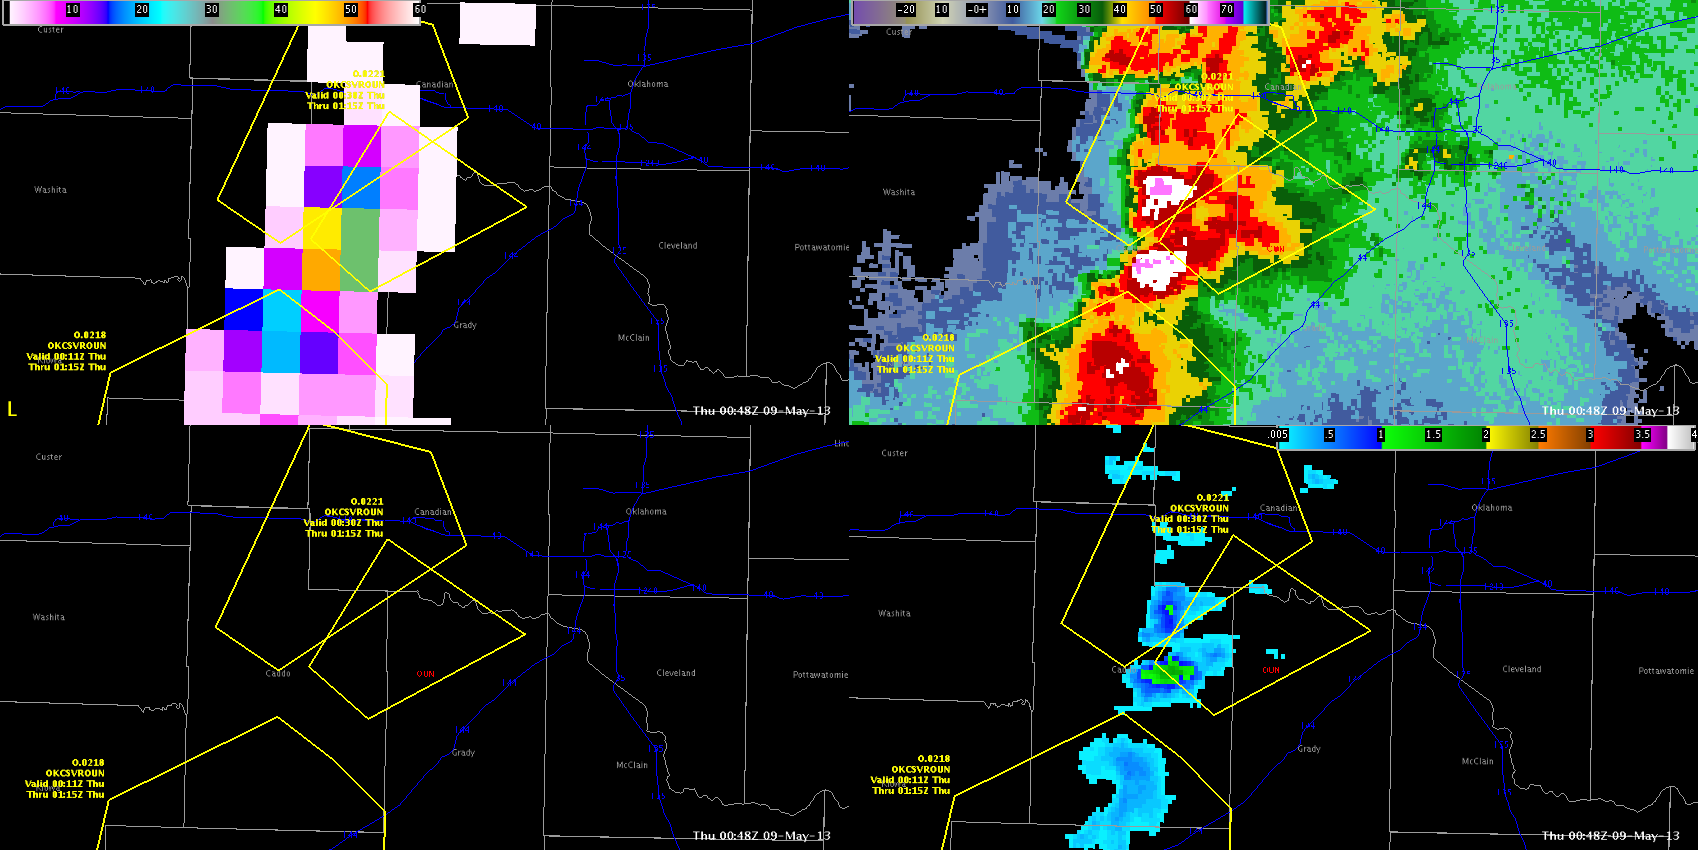
A rapid ramp up in total lightning data led to increased lead time for a Severe Thunderstorm Warning this afternoon. The Flash Extent Density product increased to 19 flashes per minute prior to warning issuance.
Flash Extent Density product showing an increase to 19 flashes per minute prior to warning issuance.
Flash Extent Density further increased following the warning as severe hail was reported.
Flash Extent Density product increased to 32 flashes per minute as severe hail was reported.
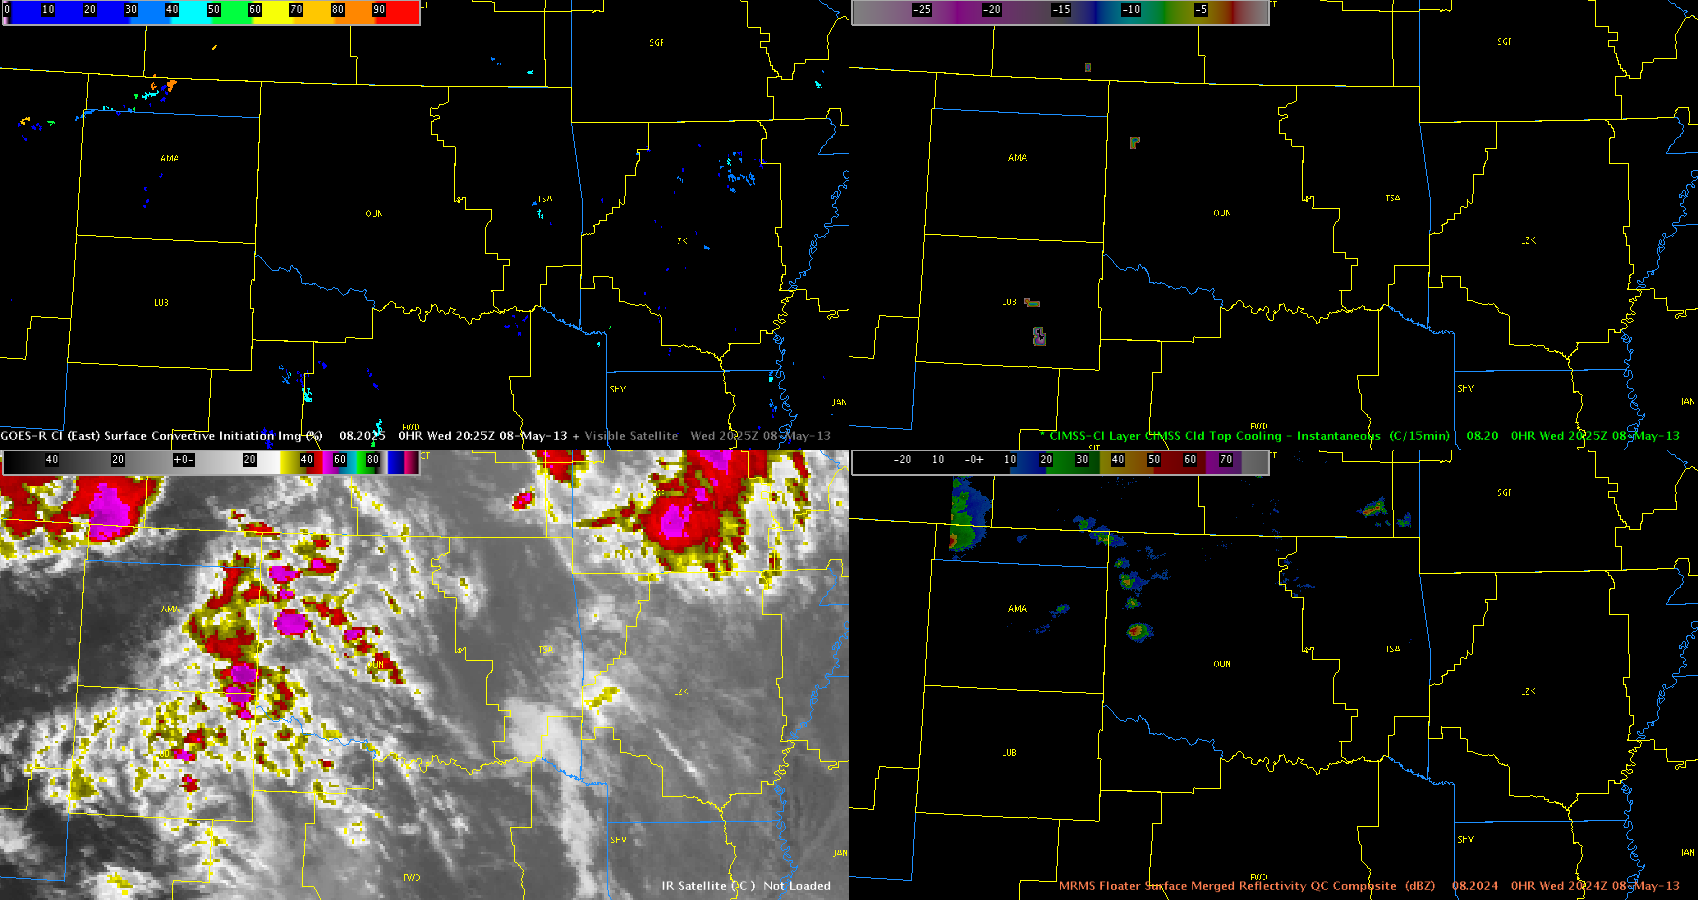
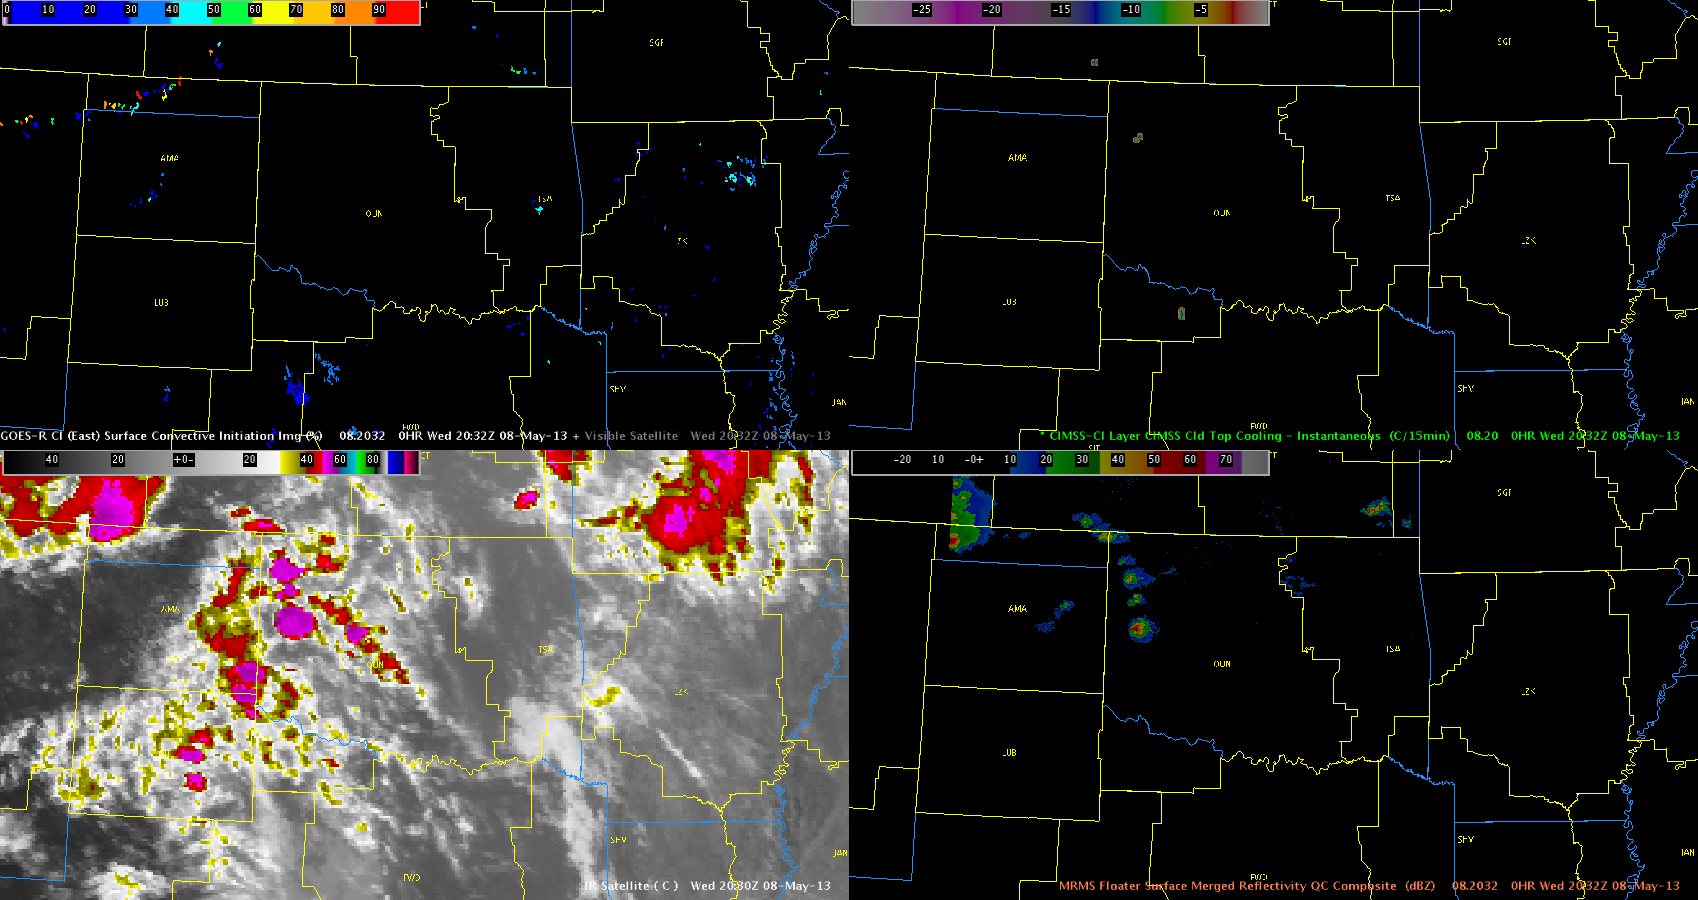
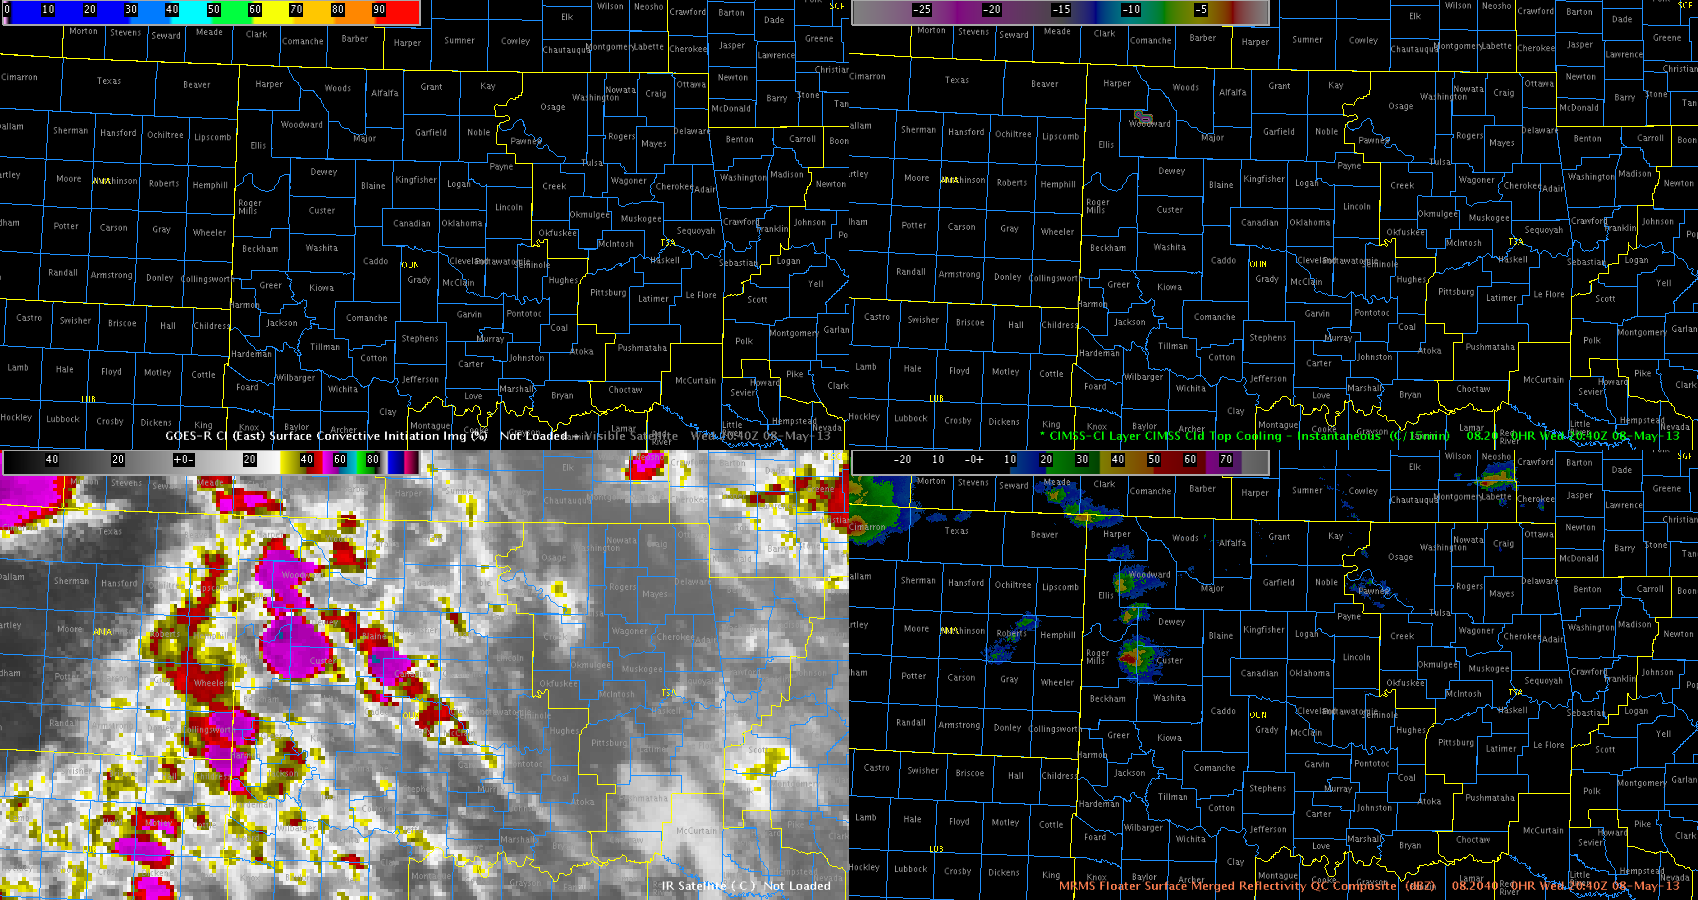
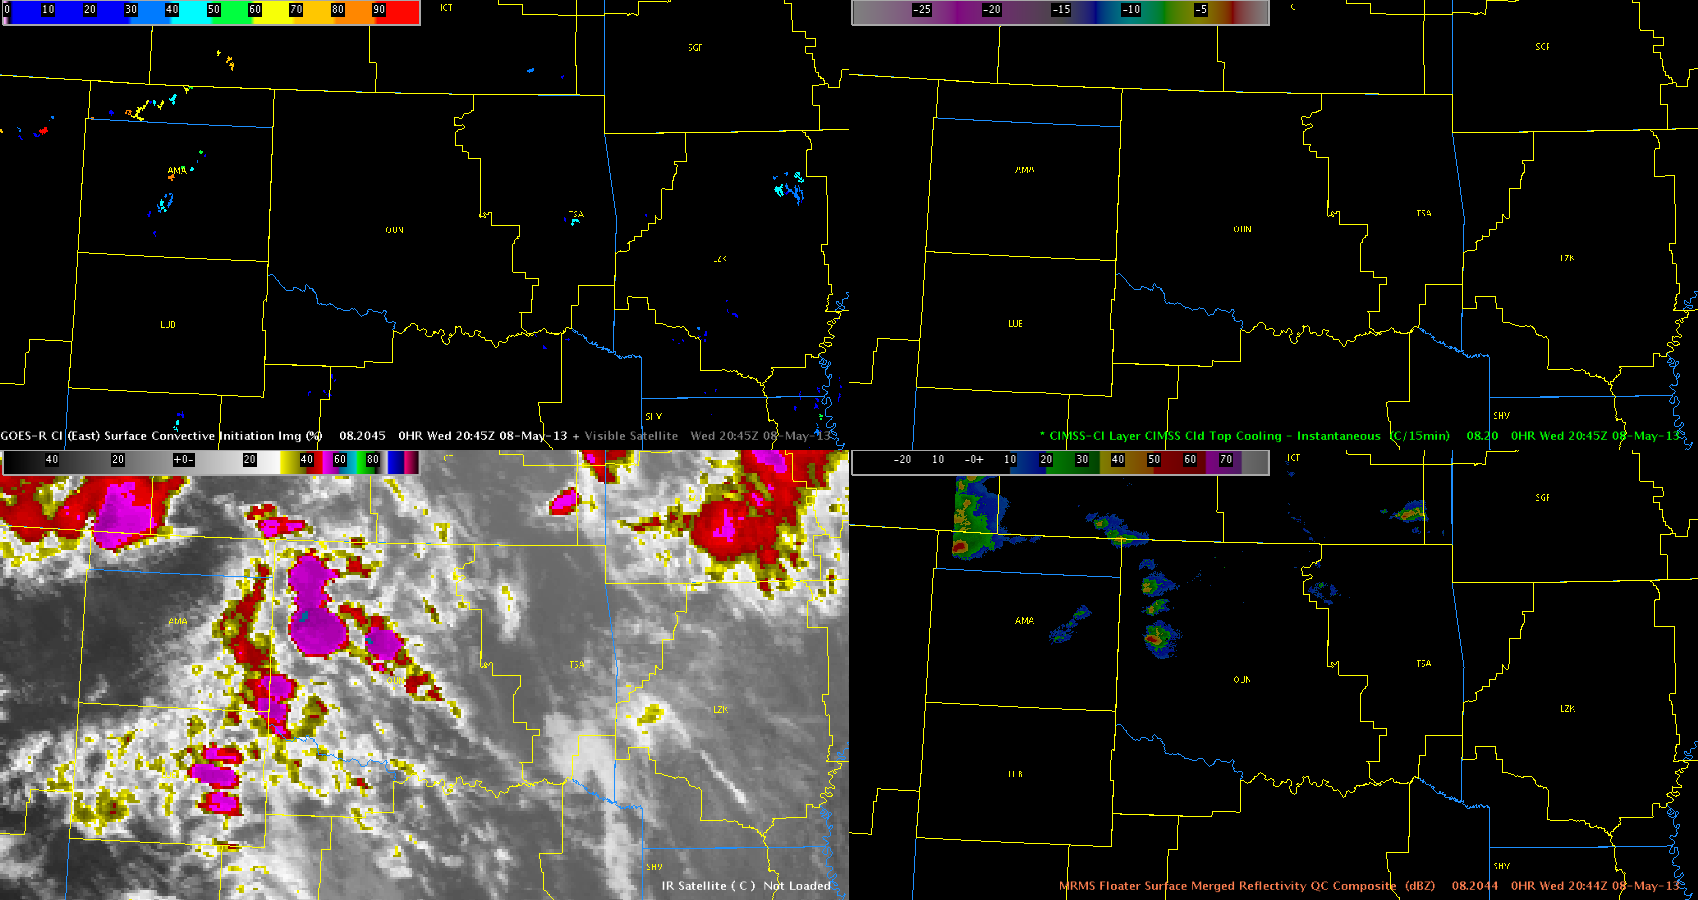
Early high and mid cloud contamination from an approaching upper-level jet limited use of both the UAH CI and UW CTC products across northwestern Oklahoma this afternoon. Storms initiated around 3 pm with the first Severe Thunderstorm Warning issued around 345 pm. The UAH CI product never showed any signs of CI due to this cloud contamination, but the UW CTC product did briefly show some signs of severe storm development as it provided an approximate 20 minute lead time on the first warning issuance. Previous shifts had found longer lead times utilizing the CTC product, but the extent of upper and middle cloud contamination was not as pronounced during those cases.
4 panel imagery showing nothing from the CI product. The CTC product did briefly pick up on cooling rates near 15 C/15 min at 2025Z.Same as above at 2032Z, with CTC showing cloud top cooling rates greater than 20 C/15 min.CTC product continued increasing to greater than 25 C/15 min with storm motion toward the northeast at 2040Z.Both the UAH CI and UW CTC products show nothing as mid and high clouds continue streaming in with mature storms at 2045Z.