With an afternoon pass of NOAA 20 there are now NUCAPS soundings over our active area of MAF and SJT. Looking at the non-modified and modified soundings there are several different things to note. On the image below the raw NUCAPS sounding is on the left and the Modified is on the Right. From this view it may be hard to see the differences, but a few are listed below.
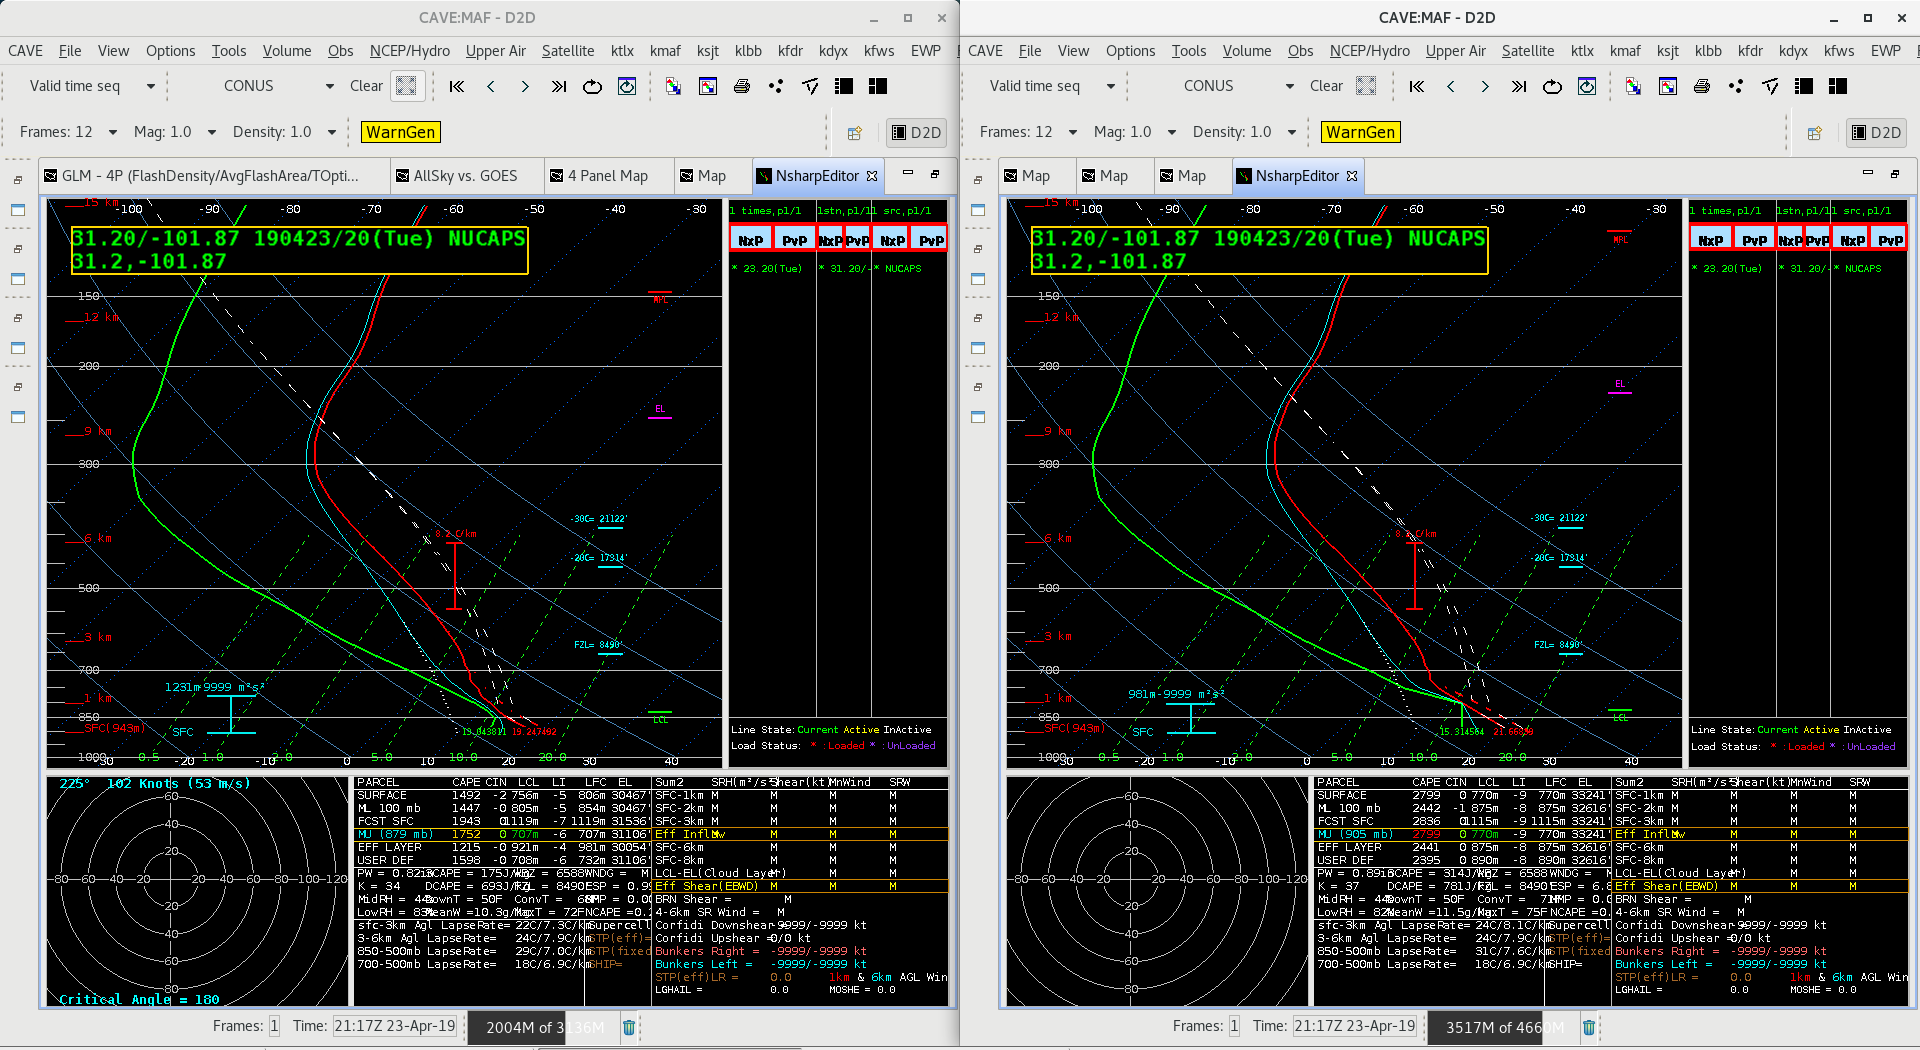
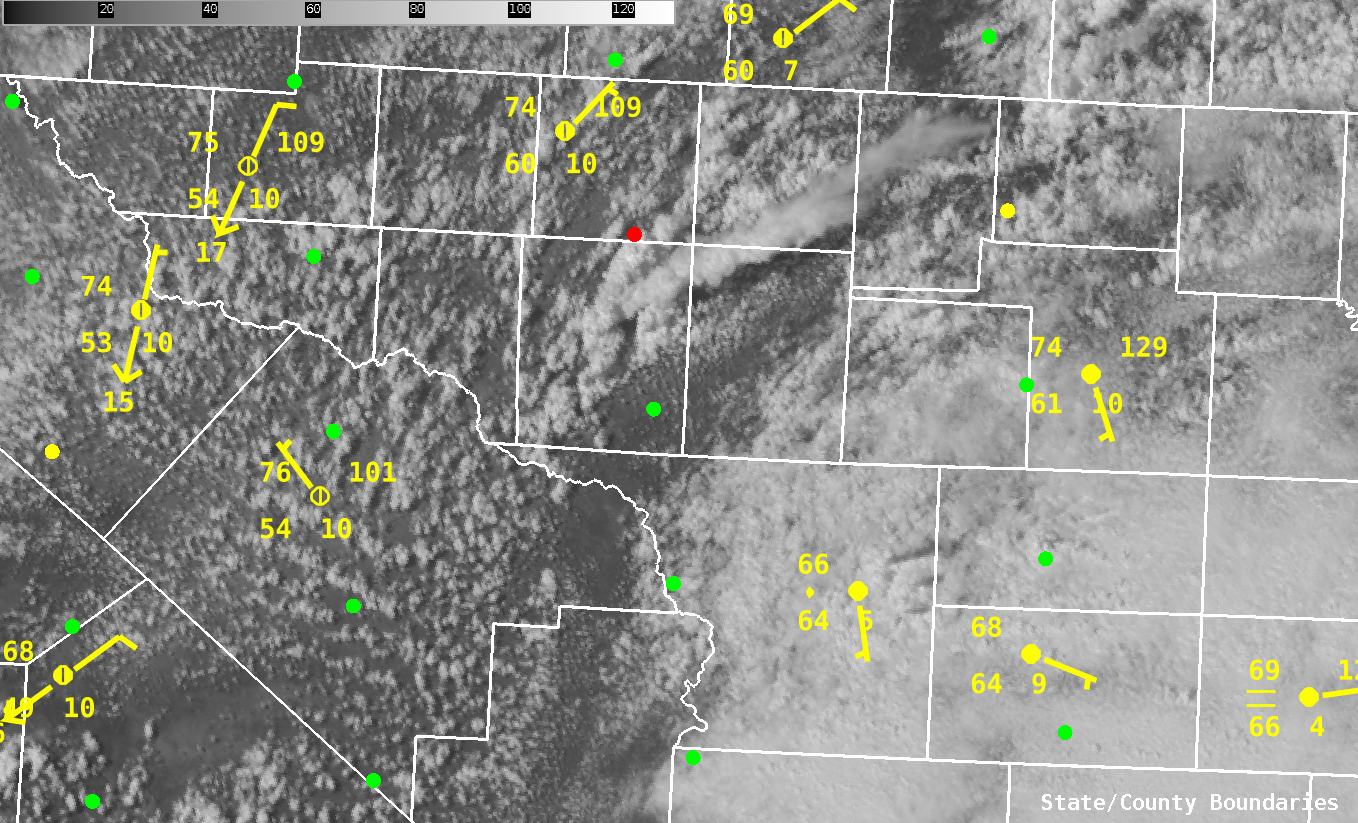
- Based on the location of the sounding and the surface observations (the location is the green dot just south of the red dot in the image below) the modified sounding DOES DO A GOOD JOB at the surface. The Modified Sounding has T=71 and Td=60. The non-modified sounding shows T=67 and Td=55. Looking at the surface observations below the modified sounding is more reasonable with Td around 60 and temps in the upper 60s and lower 70s.
- Just above the surface though there is some questionable signatures. First it appears the modified sounding assumes that there was a cloud deck around 1km (T and Td almost the same). This is questionable as the visible satellite below does show more clear skies around the point. As that point is right along the front there has been mostly clear skies near that point. How it handles these parts of the mixed layer are more questionable.
- These differences to make a BIG difference in the severe weather environment. Most notably CAPE. If you look at the surface CAPE it goes from 1492 in the non-modified to 2799 in the modified. That is significant, especially when these supercells are producing hail. There has been a 2.5 inch hail report to the east of this dot location, which does lend itself to pointing towards larger hail.
-Alexander T.
 Sandor Clegane
 Sandor Clegane
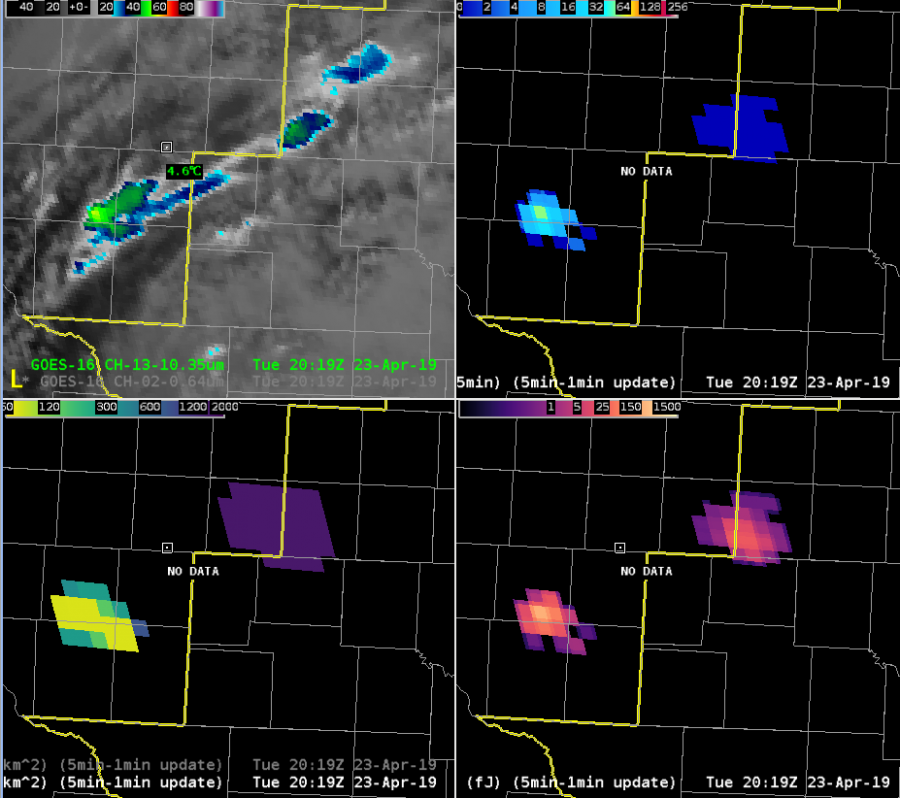
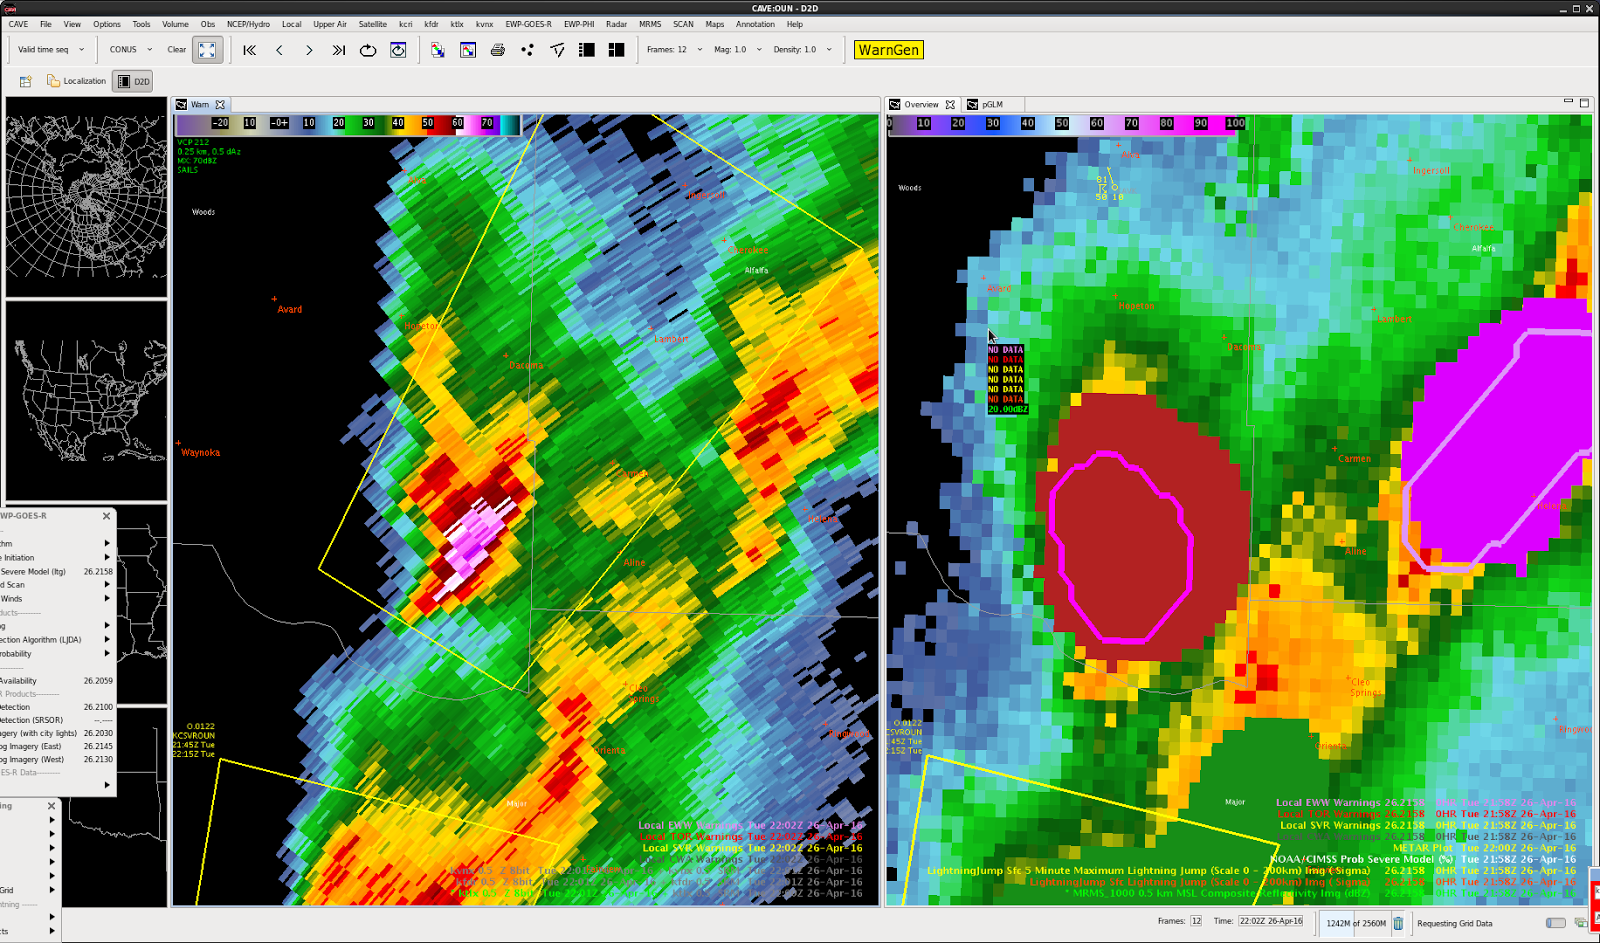
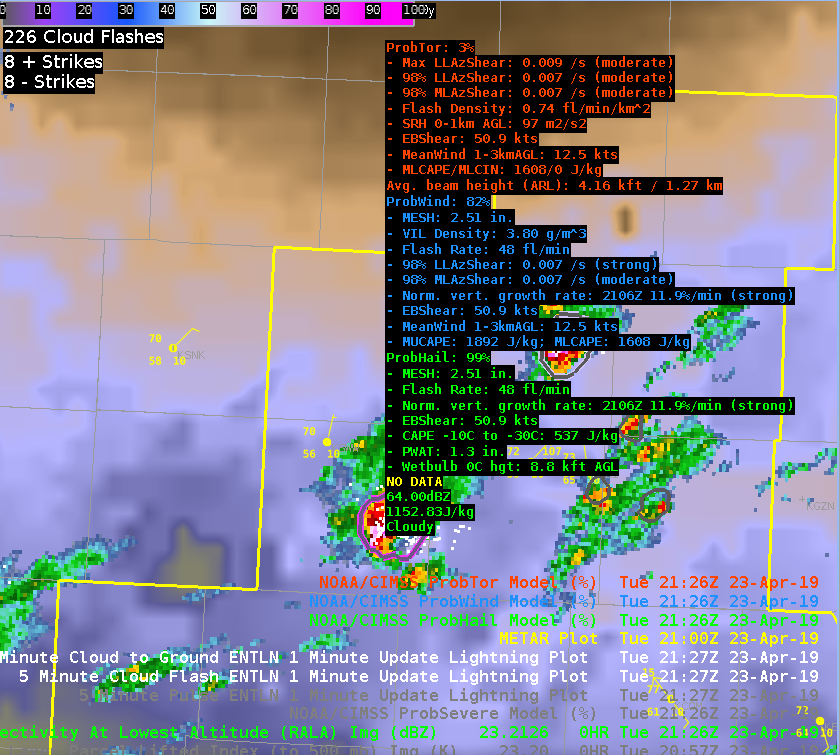
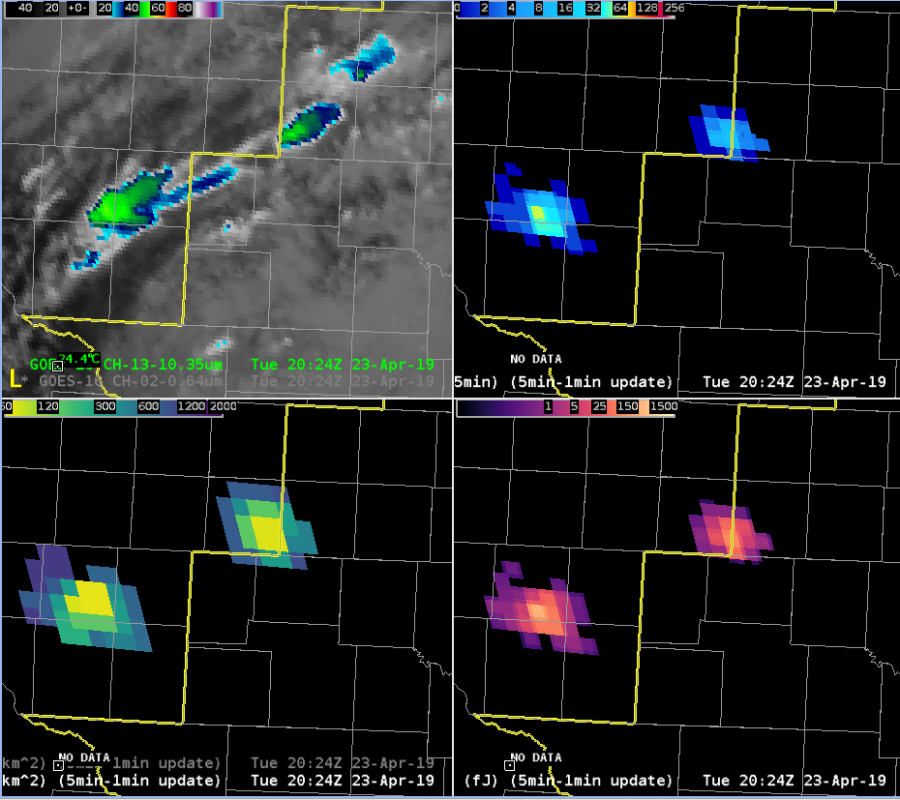 5 minutes later, this storm began displaying classic hail signatures in all-tilts base radar data, prompting a severe thunderstorm warning. I will note that several other storms displayed similar minimum flash area decreases without so quickly turning severe, but the rapid decrease was the first thing that brought attention to this storm.
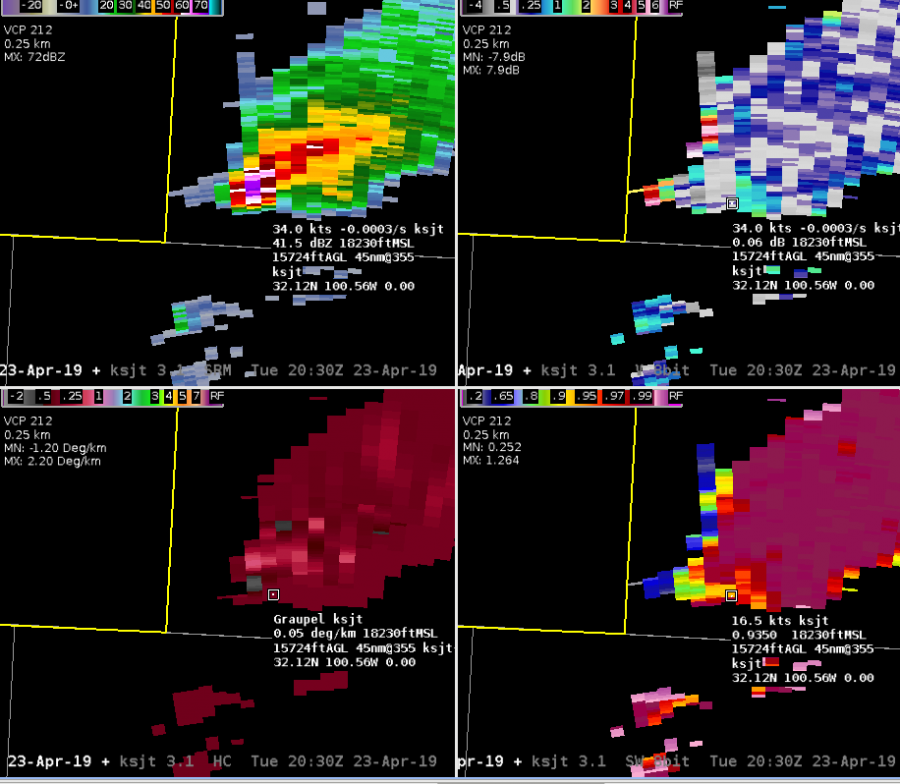
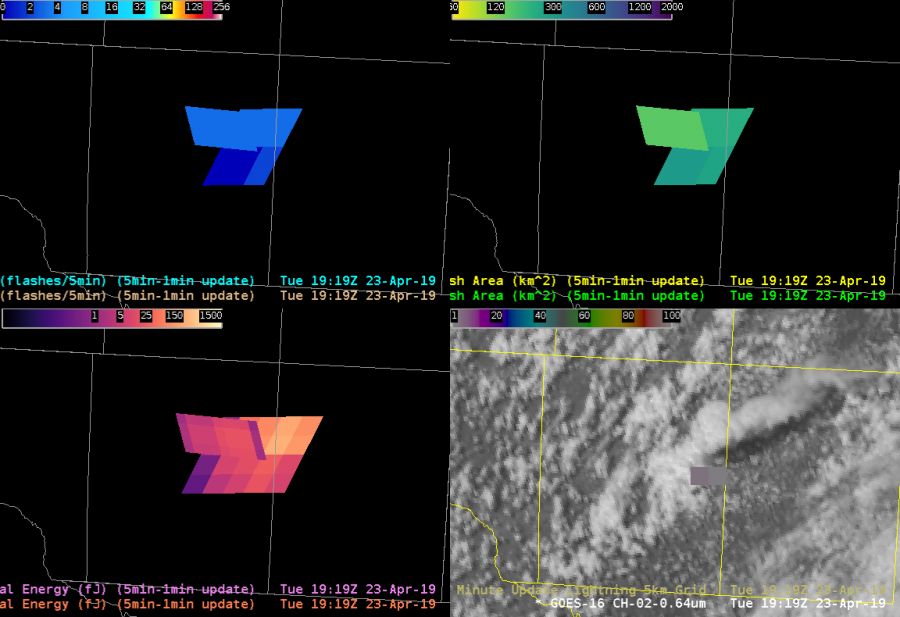
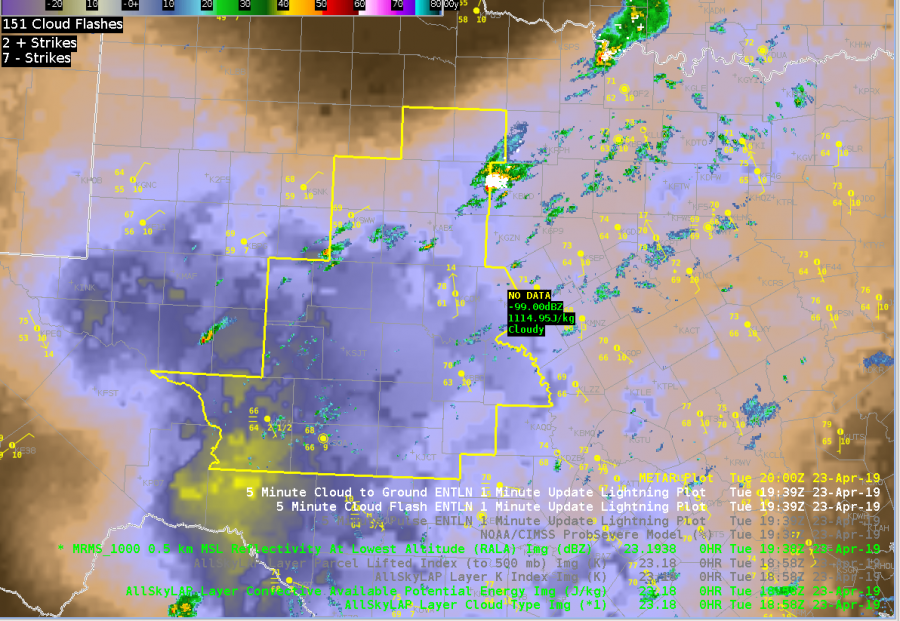
 Laps All Sky retrievals show a relatively sharp instability gradient along warm front where our convection initiated. Storm motion is likely to be parallel to the front, so convection that does will likely be relatively long lived. (Below)
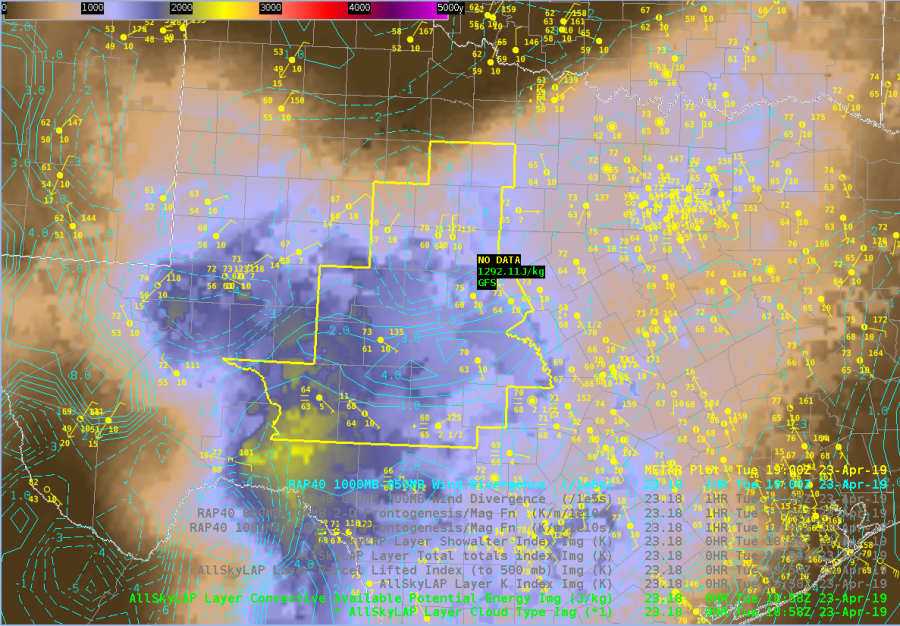 Laps All Sky LI further indicates that the airmass is relatively unstable and there will be little convective inhibition at least in the midlevels. (Below)
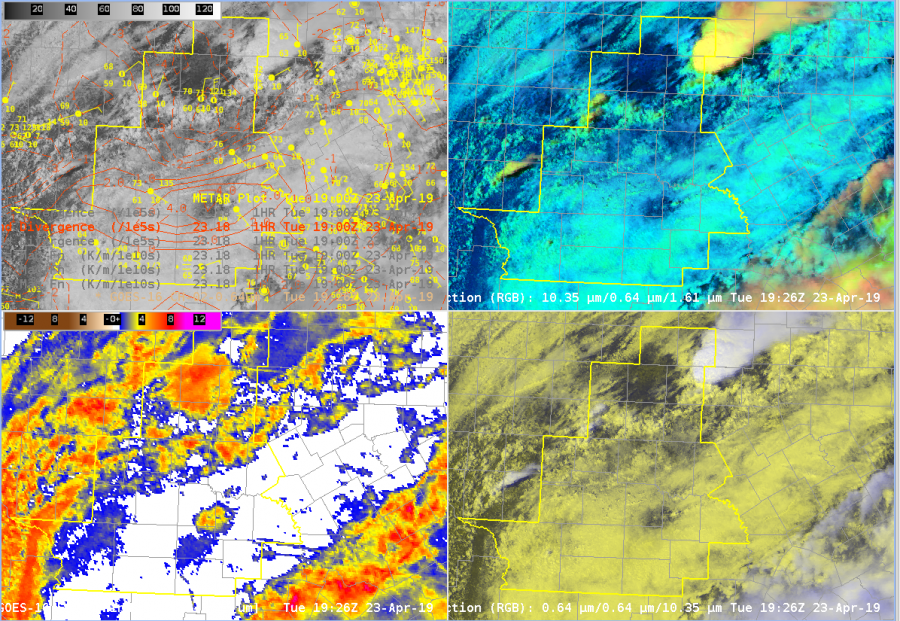
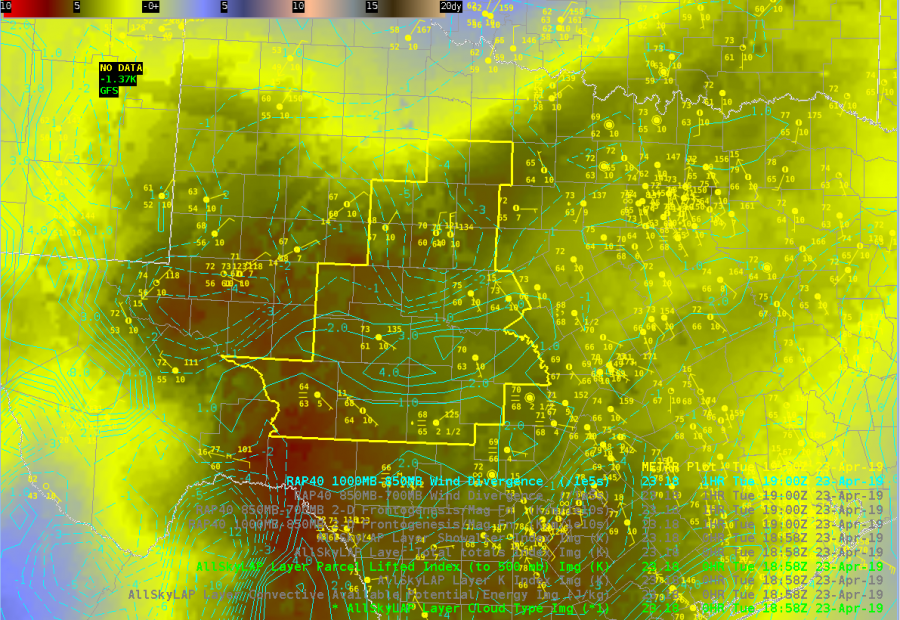 All Sky TPW indicates a relative moist airmass across the CWA with PWs above 1″ for most of the CWA. This matches the 12z sounding from MAF relatively well, and is well above the 90% threshold of the sounding climatology for that location and date. It’s interesting that the mid-level moisture (bottom left) is higher than the low level moisture (bottom right). Not quite sure what to make of that at this point. (Below)
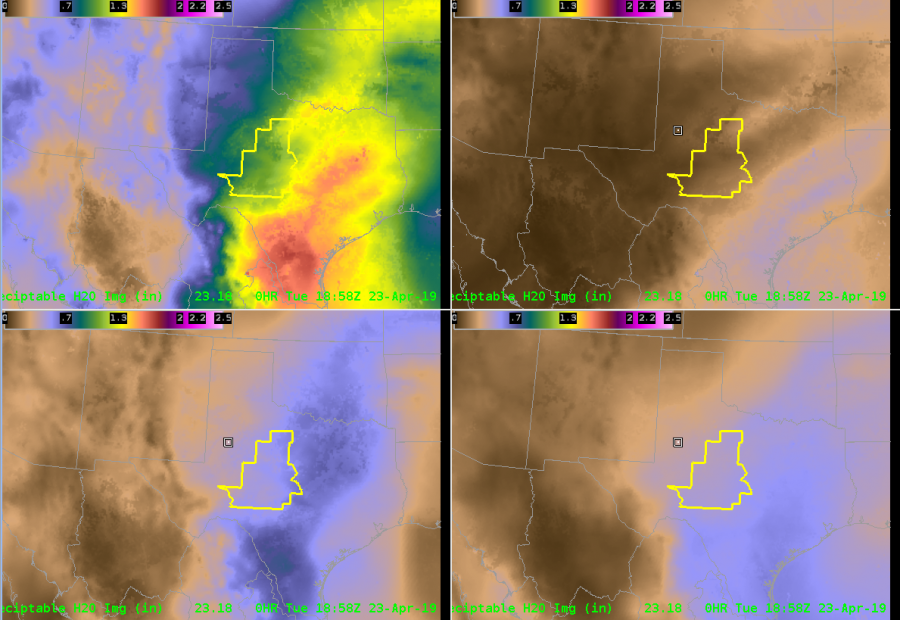 Finally, MRMS RALA indeed shows that showers and storms have developed along the front. When animated (not shown), you can see that the storms are tracking along the front, heightening my concern for flooding.