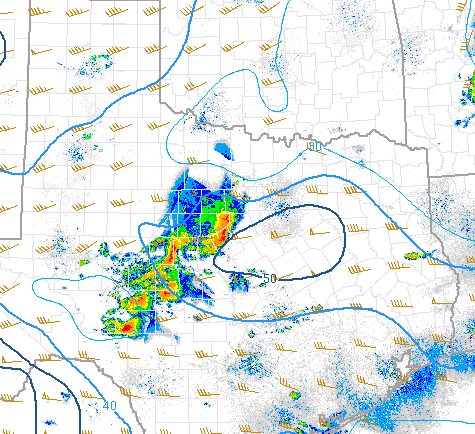
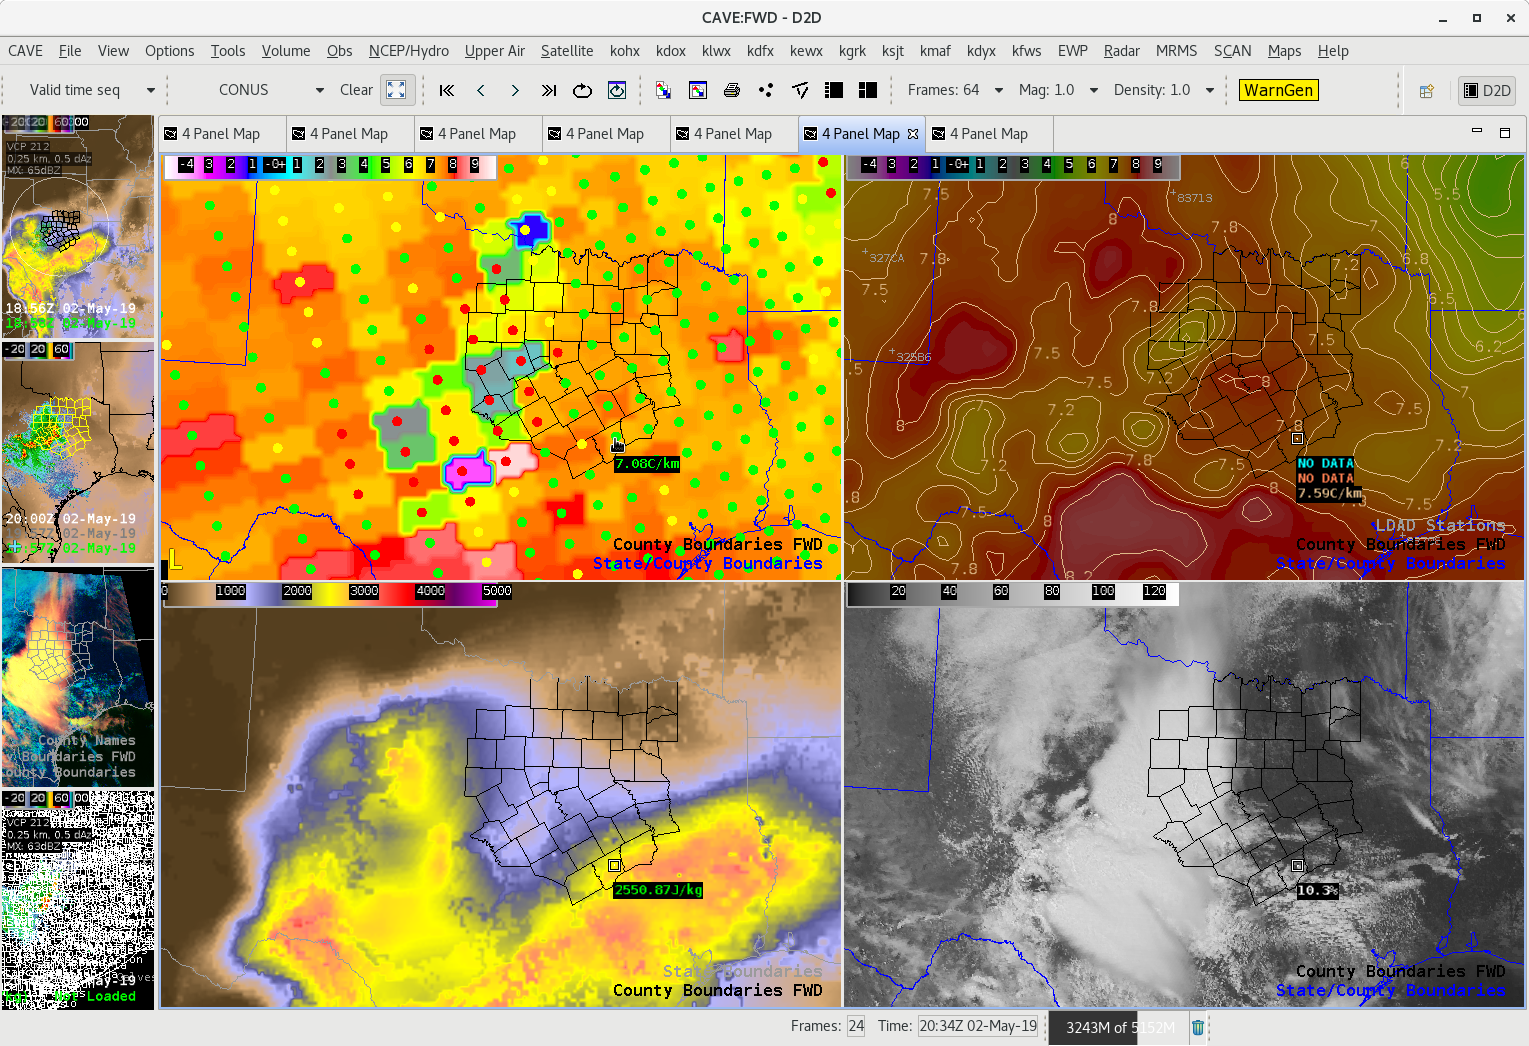
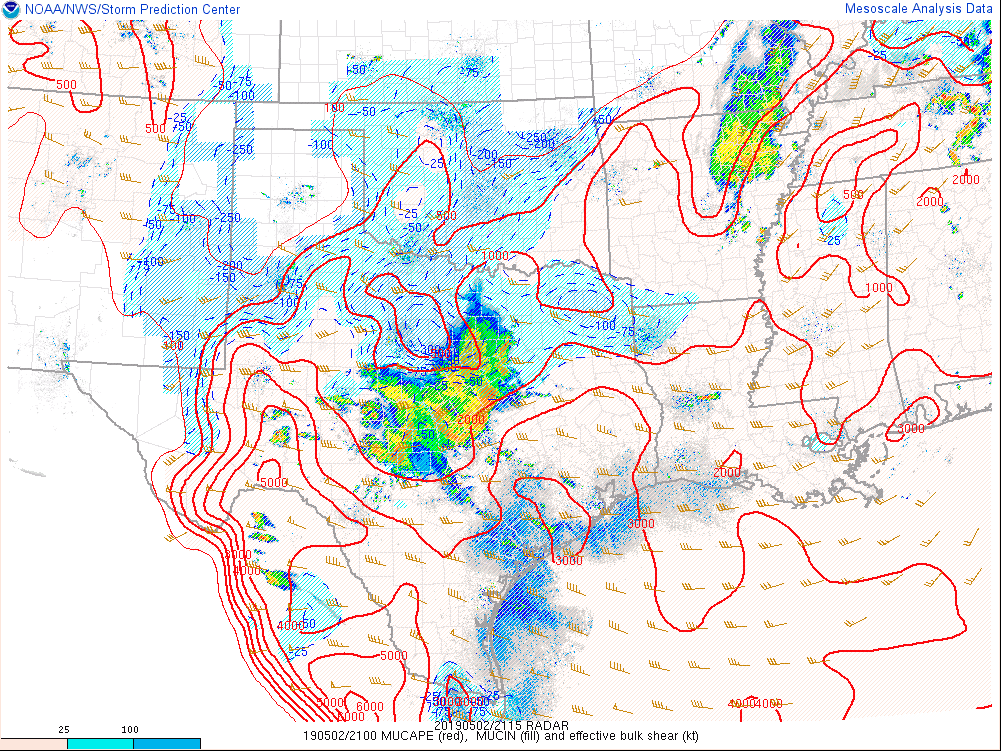
Favorable 0-6km shear aloft from SPC Mesoanalysis page above across FWS CWA
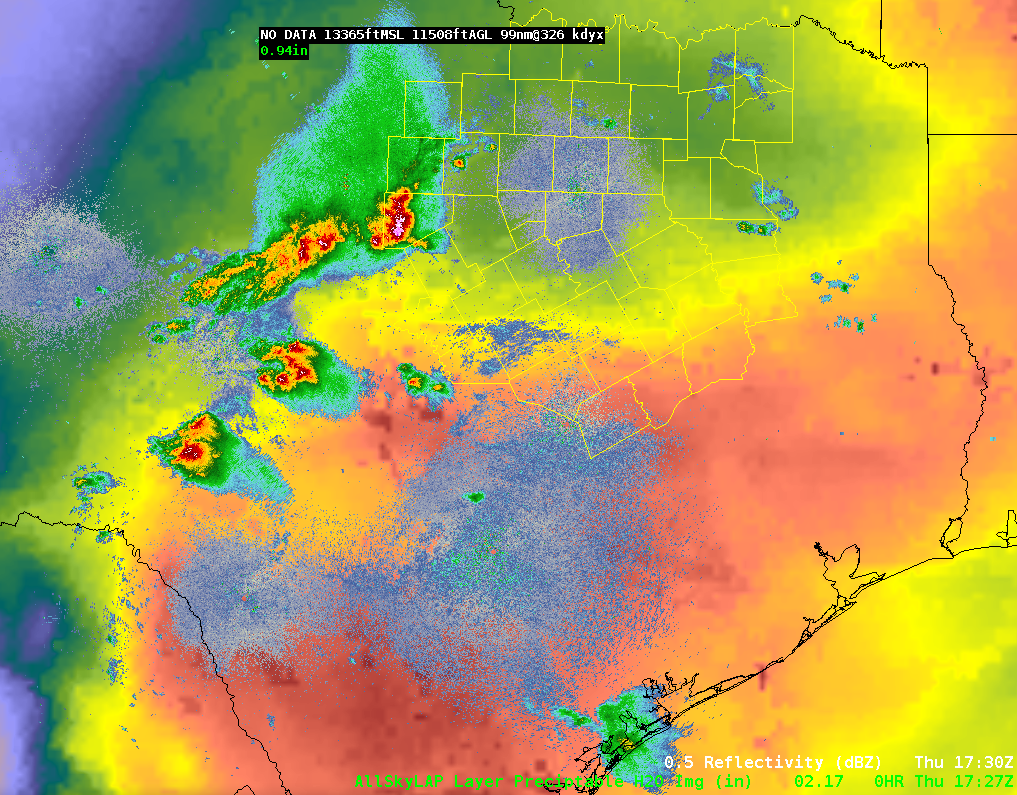
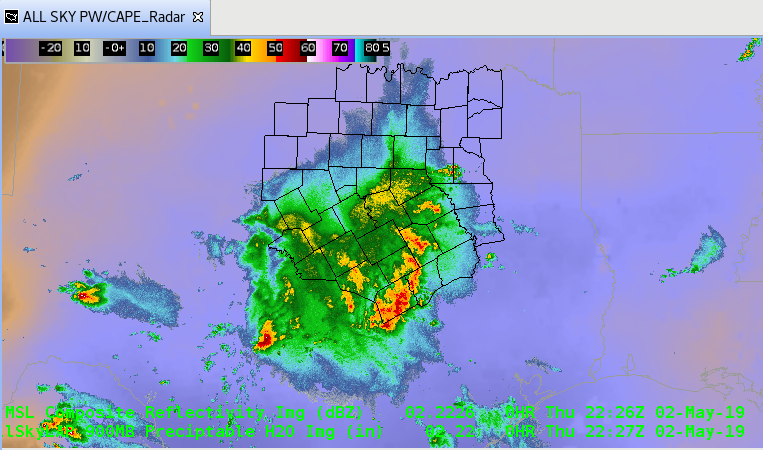
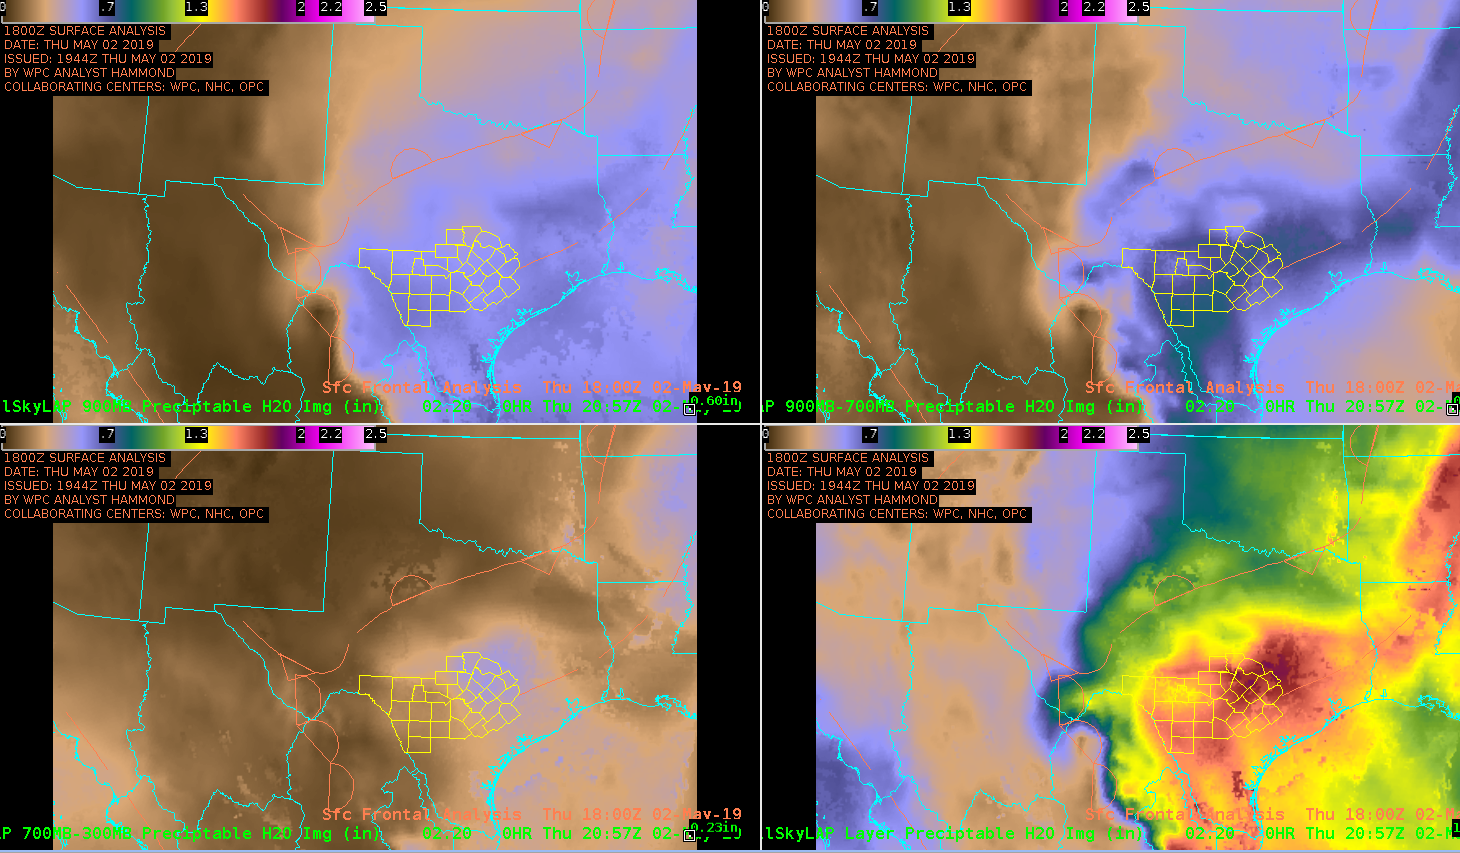
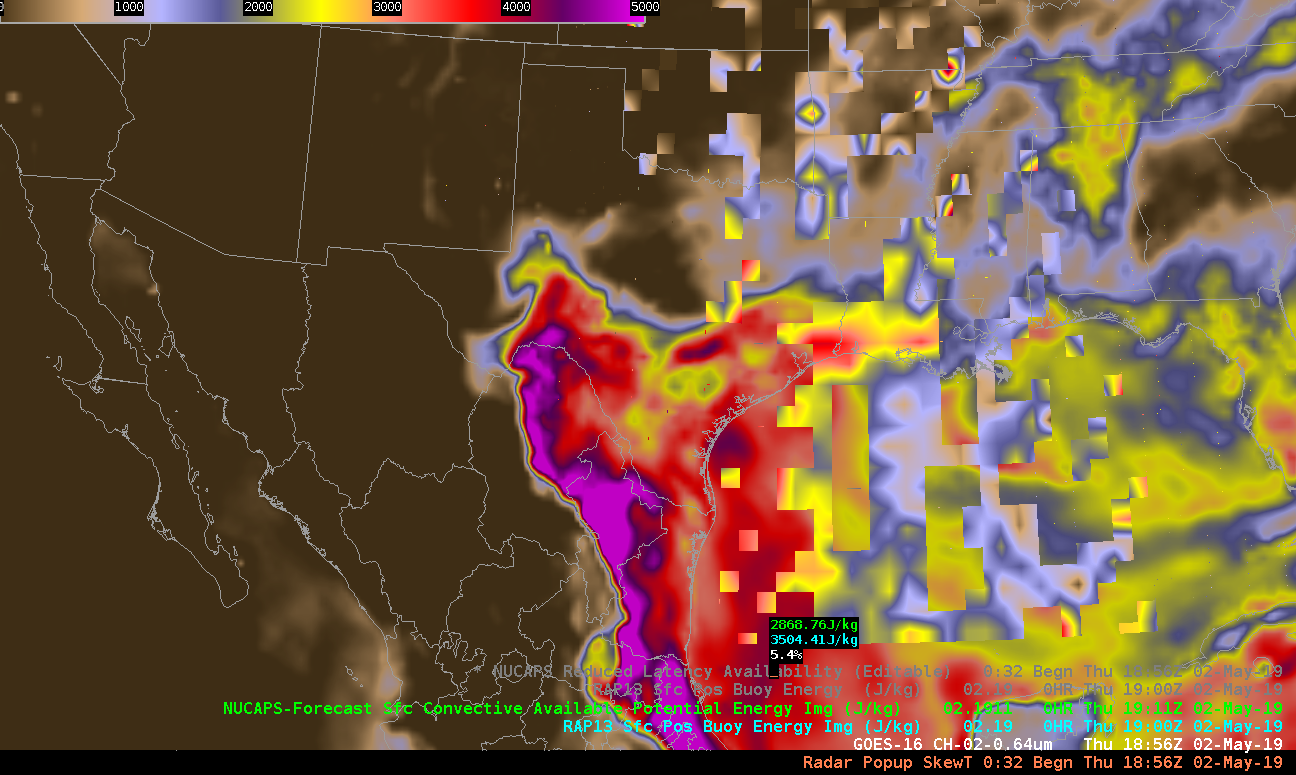
All Sky Total PW above shows deeper moisture in southern FWS CWA.
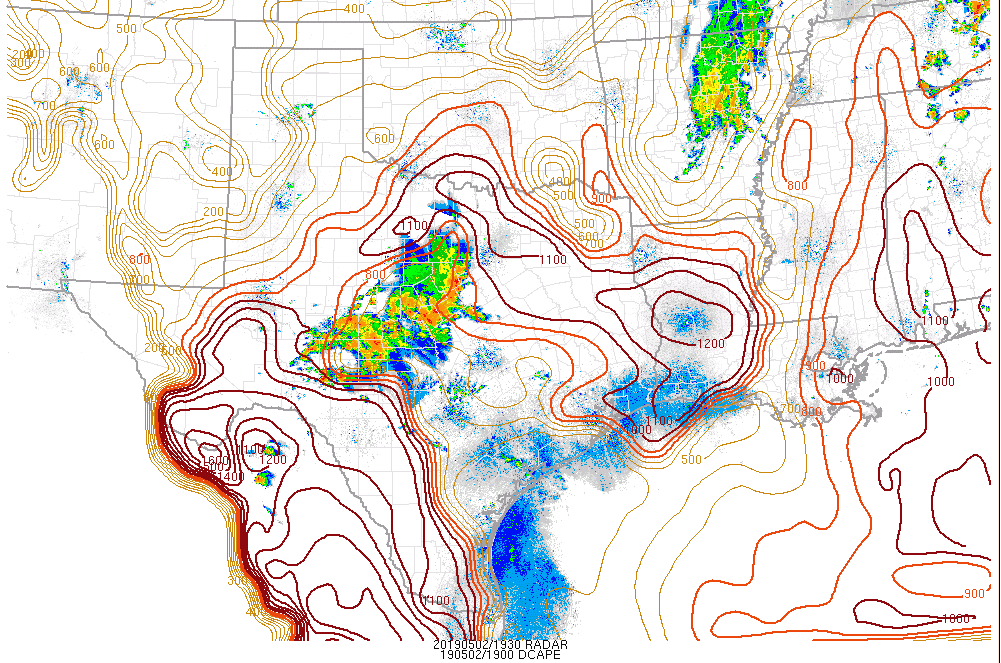
High DCAPE values across the FWS area per SPC mesoanalysis page above

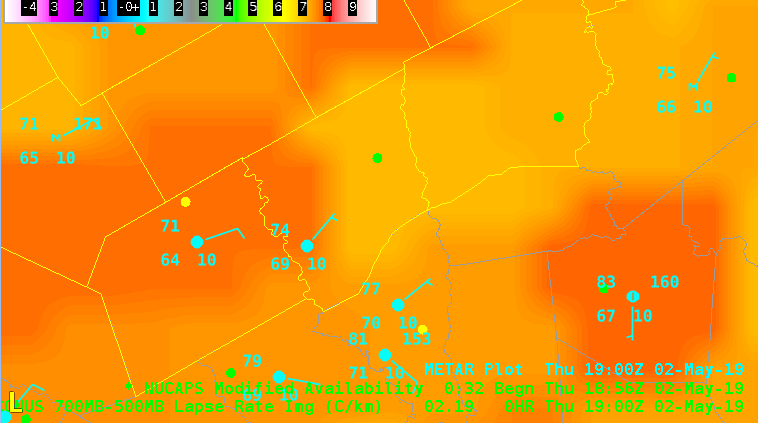
Mesoscale Discussion…40-50kts of wind shear aloft and high DCAPE values show conditions favorable for severe winds to occur, mainly for locations where All Sky total PW shows strong moisture gradient along surface front in southern part of the CWA.

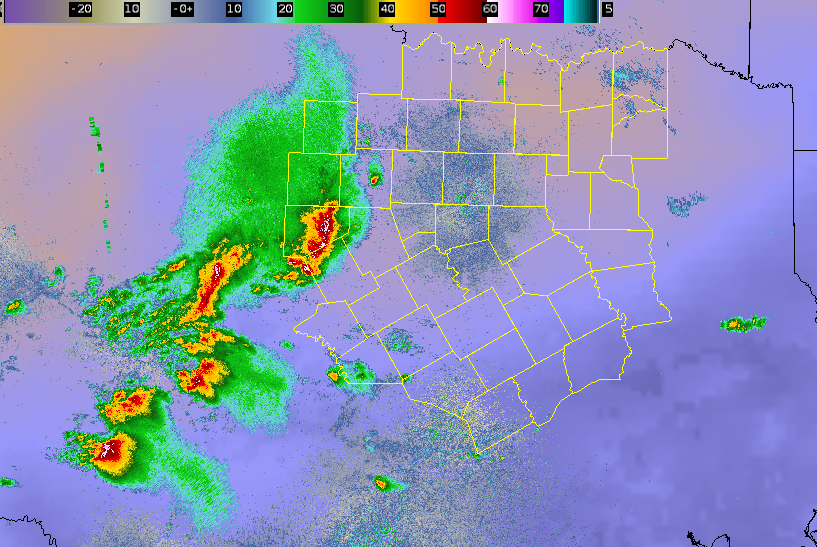
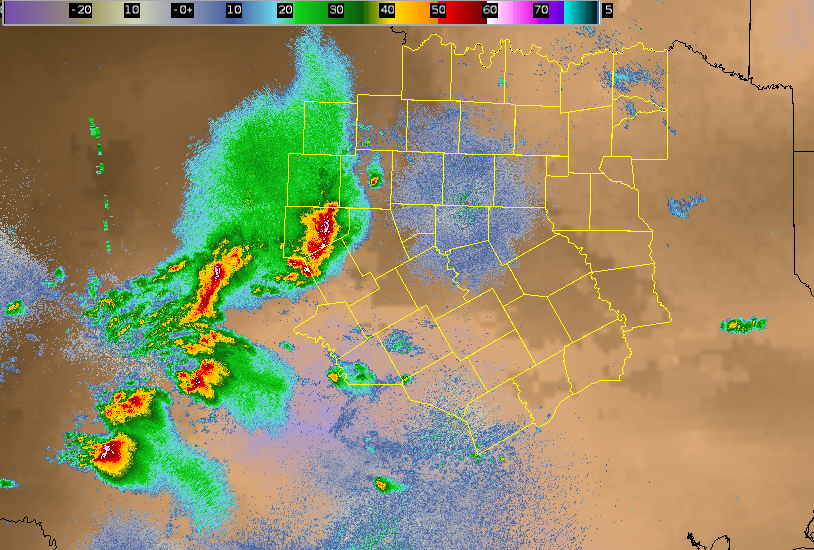
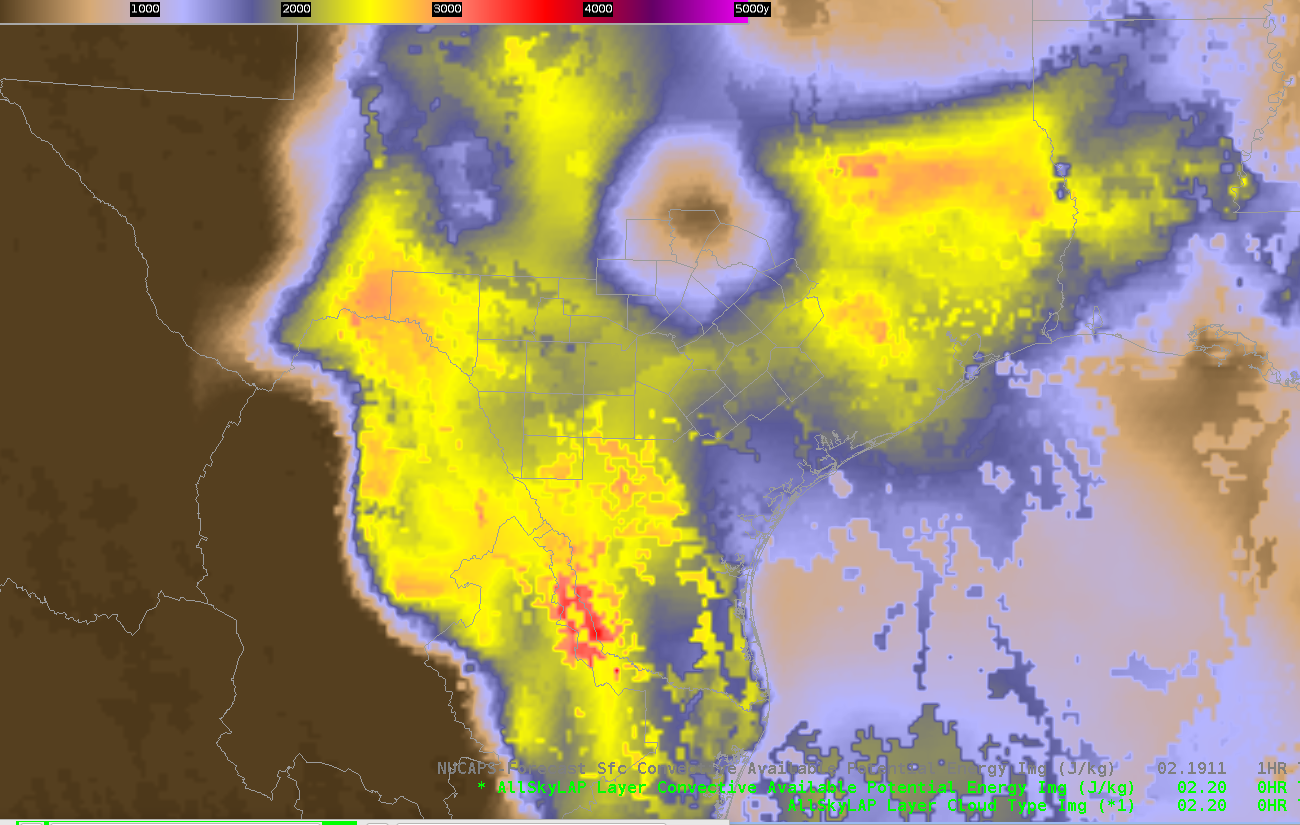
This is a loop of radar and All Sky LAP CAPE. Notice the higher CAPE values in the southern part of the CWA. This is were linear convection could grow upscale become surface based and capable of produce damaging winds. -Jake Johnson
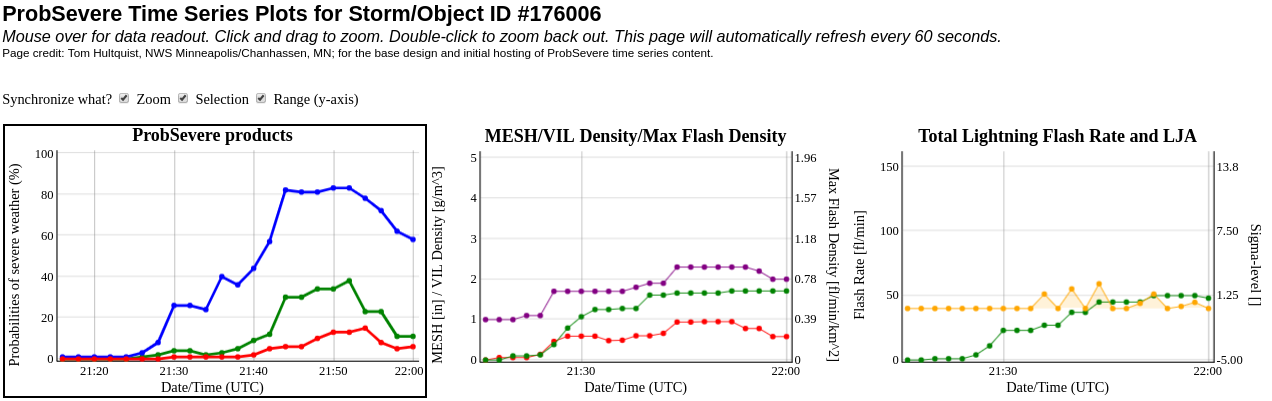
The ProbSevere Wind spiked to 80% with a thunderstorm that later moved across southern FWS CWA, which was our area of concern.


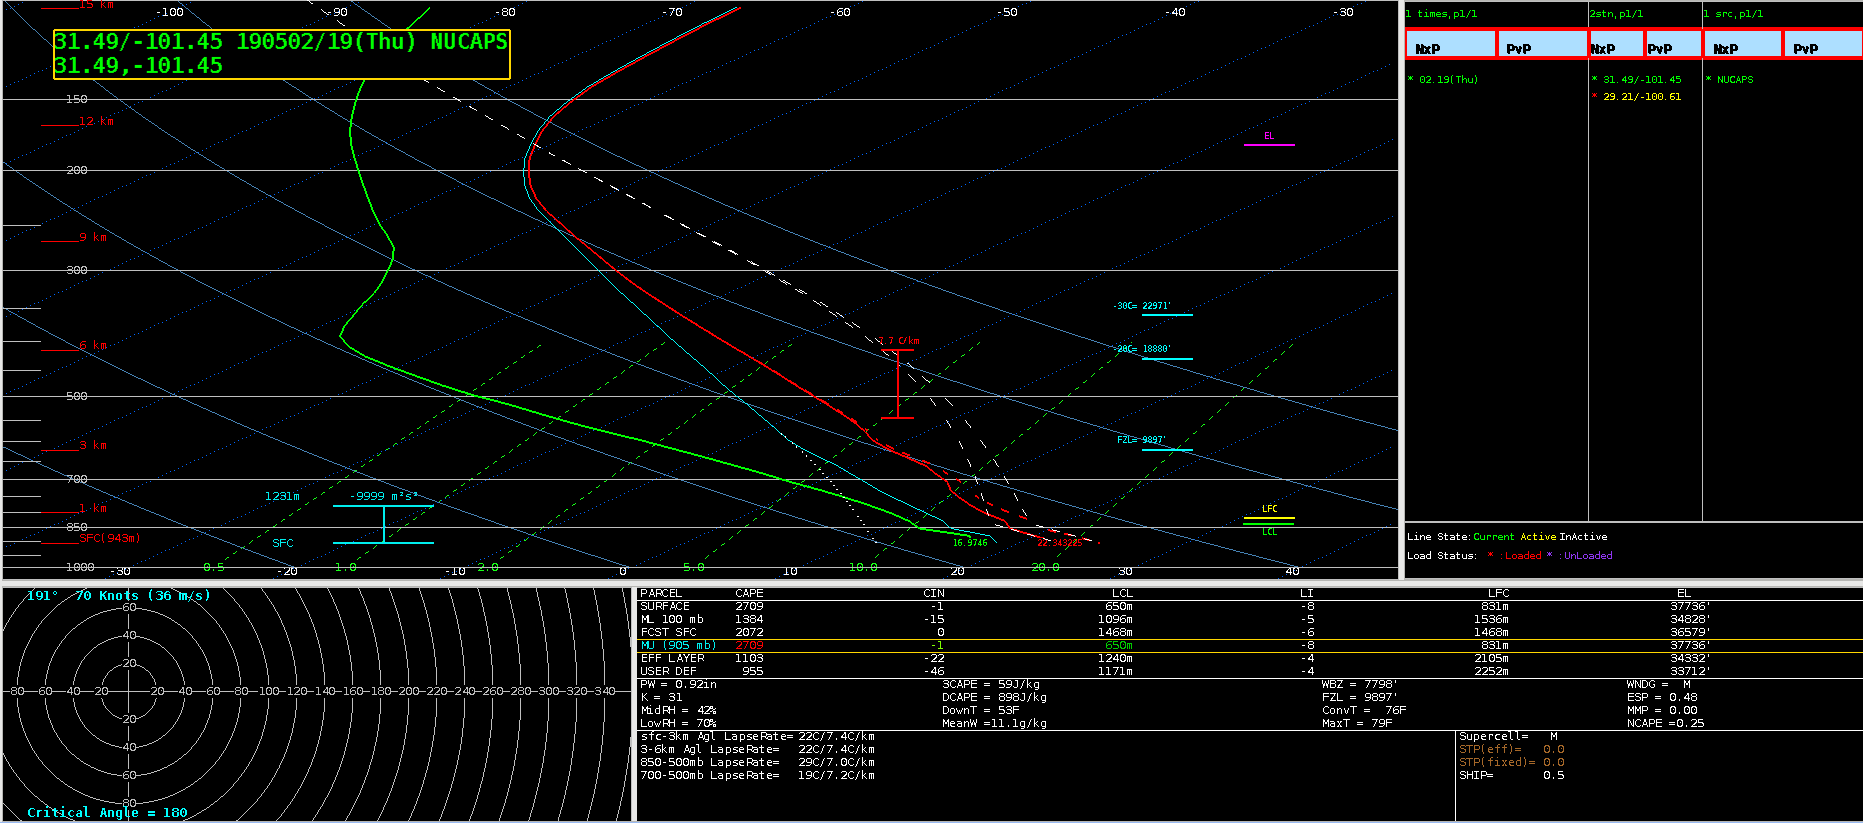
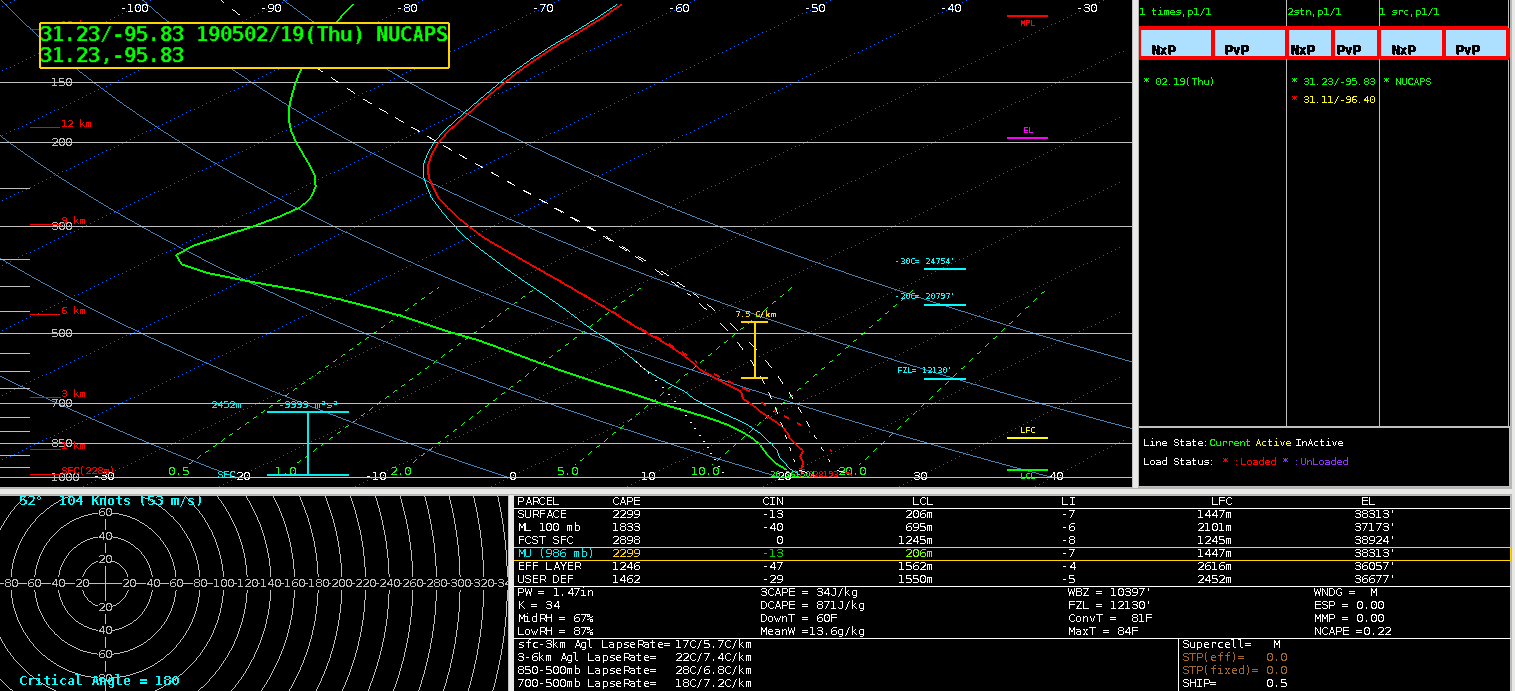
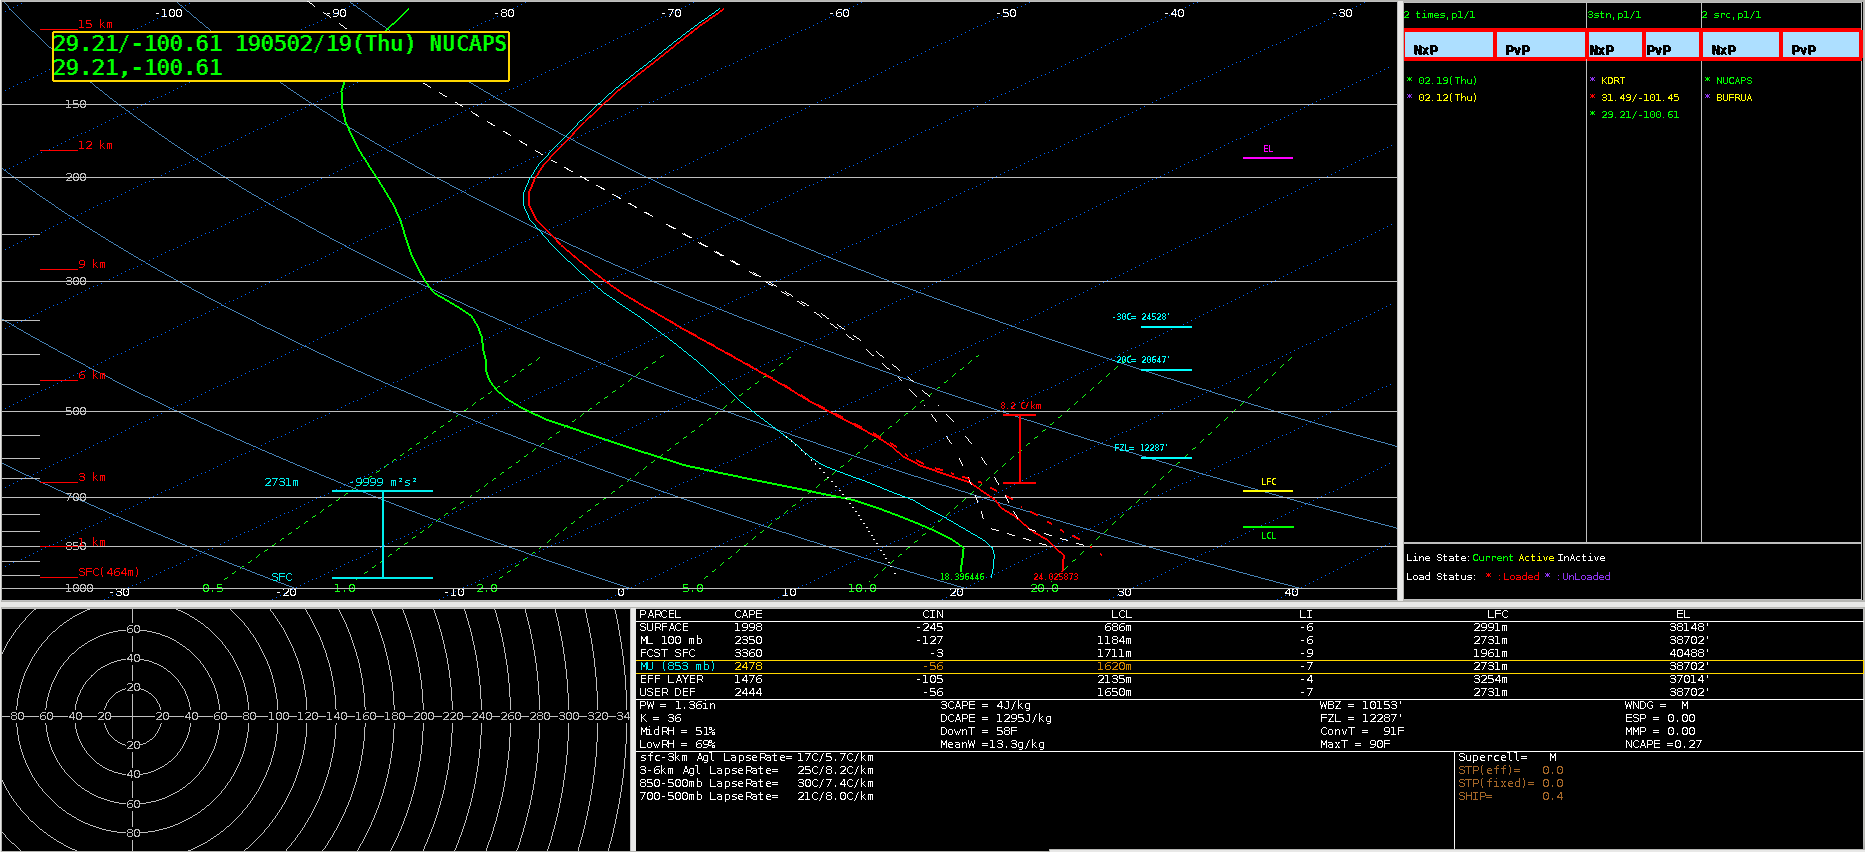 This was an unmodified NUCAPS sounding from the same region. Boundary layer moisture is not captured nearly as realistically as the prior modified example. Overall, trust in the modified NUCAPS sounding data has increased dramatically after some exposure to it. I would say many forecasters need more experience learning about the soundings through simulations to trust the data more.
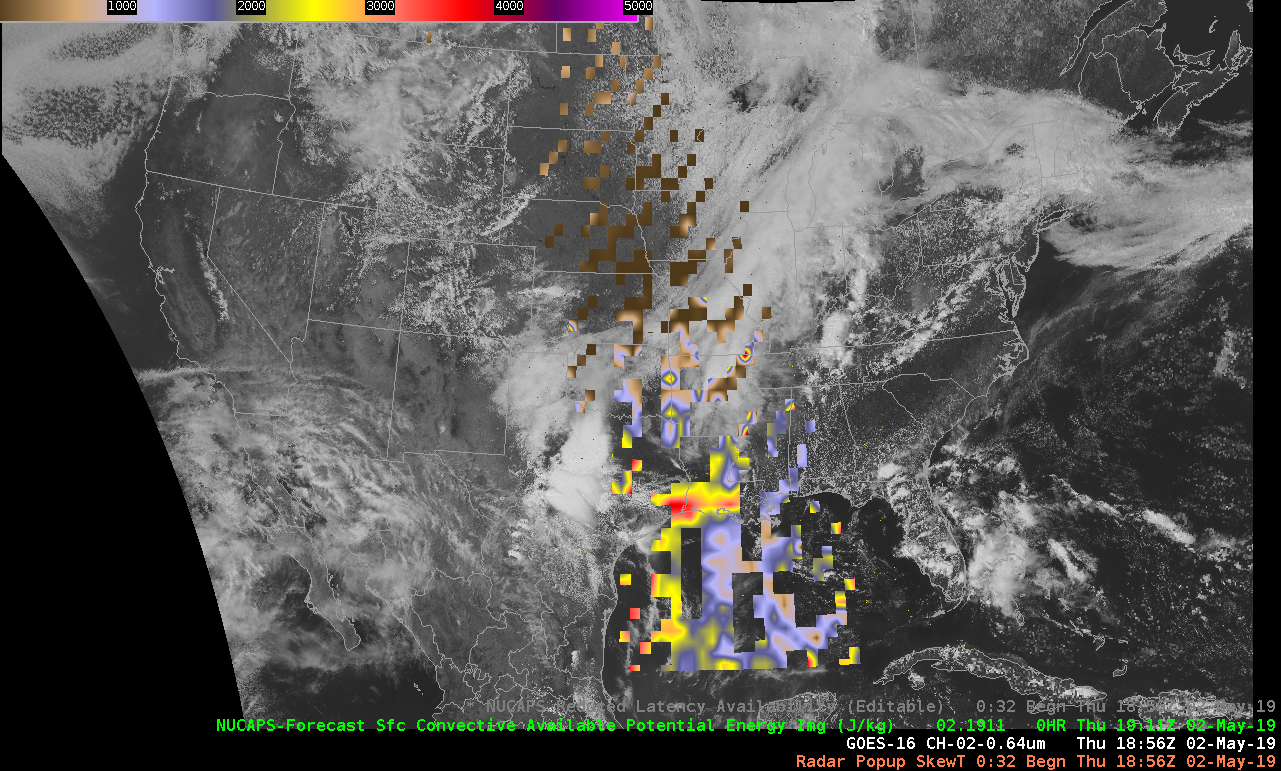


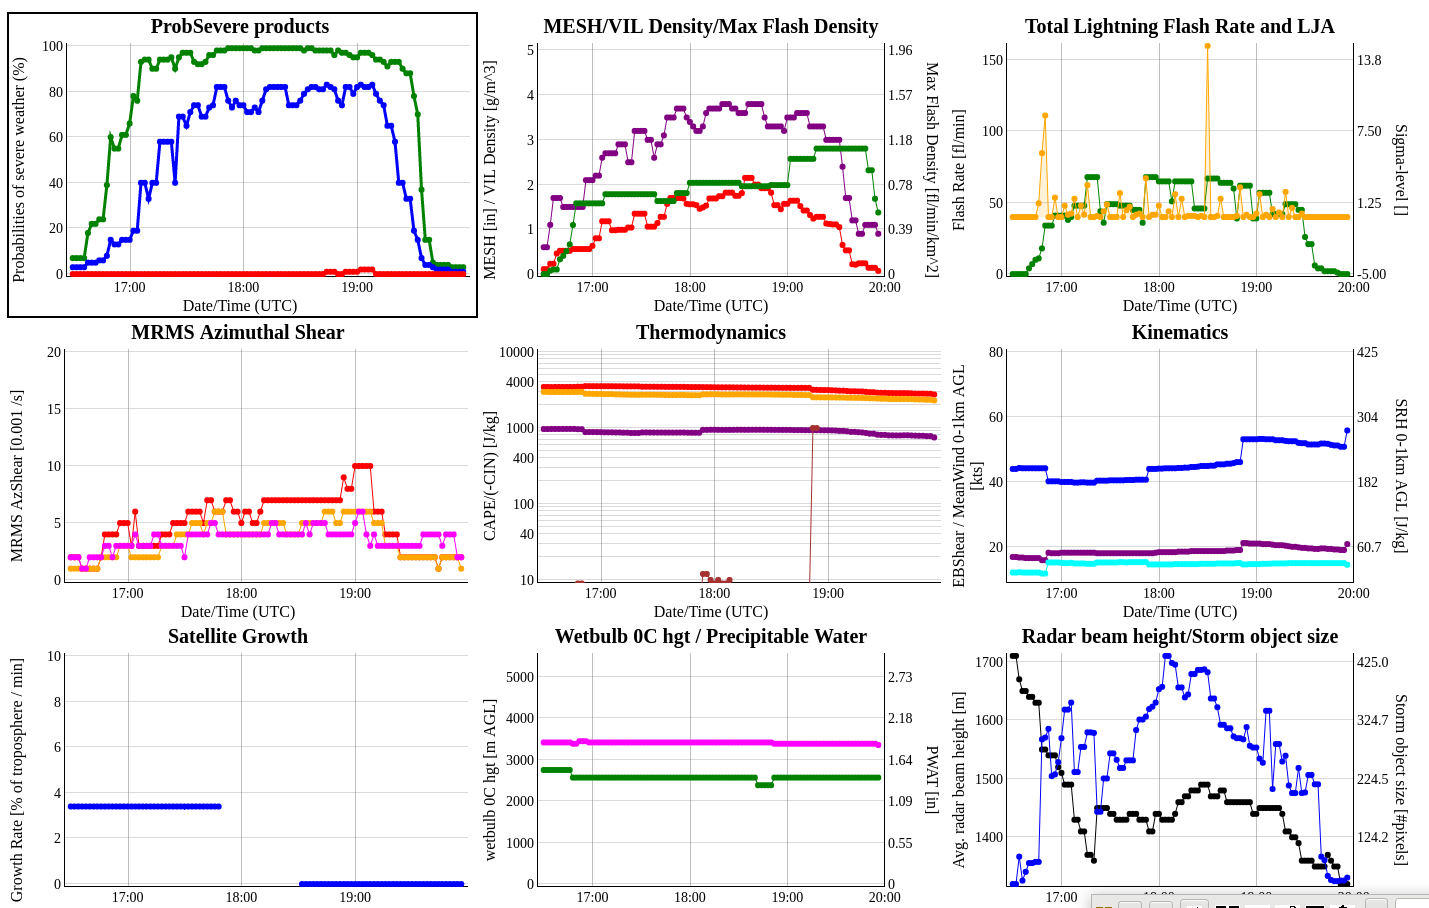 Graph of probsevere for splitting supercell discussed in earlier blog entries. These graphs are extremely useful to forecasters looking for trend analysis.