
Image 1
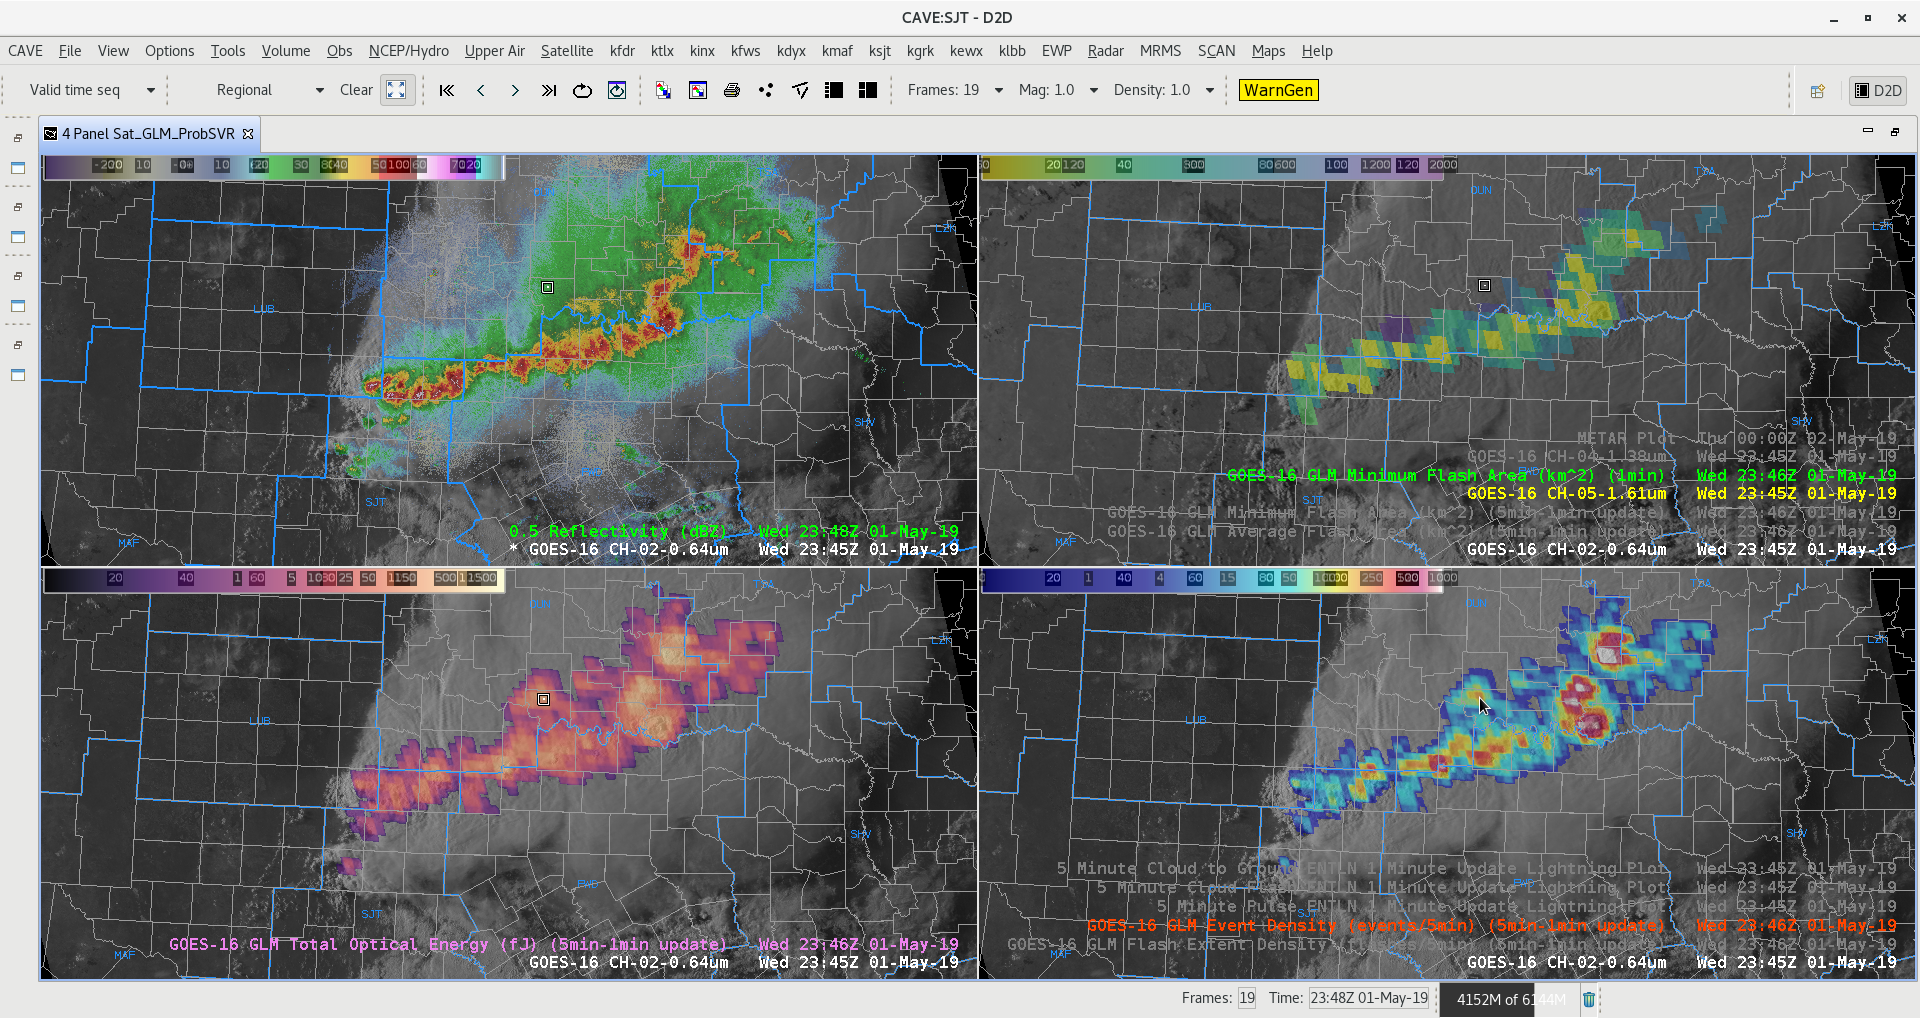
Image 2
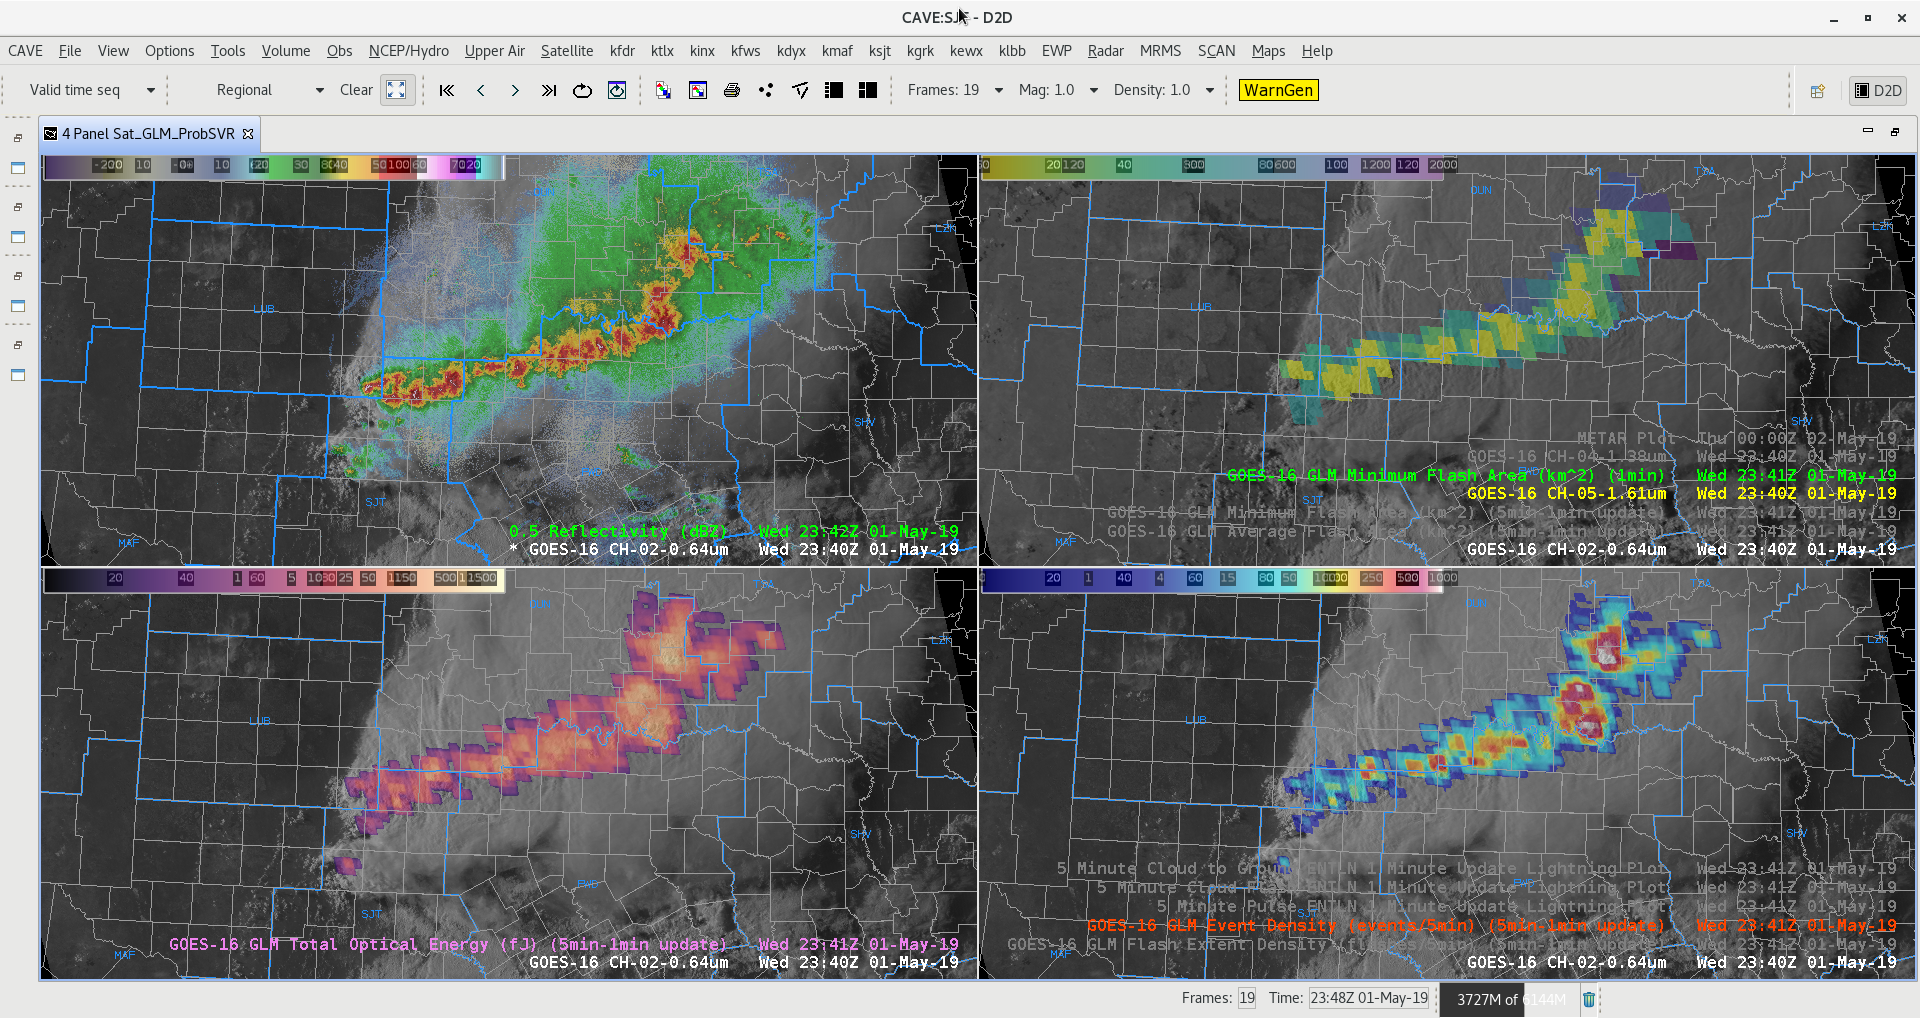
GLM detects lightning flashes in cirrus plume in light rain area north of main convective line. See cursor location in (Image 2) for the cirrus flash spreading northward. -Jake Johnson
Official websites use .gov
A
.gov website belongs to an official government
organization in the United States.
Secure .gov websites use HTTPS
A
lock (
) or https:// means you’ve safely connected to
the .gov website. Share sensitive information only on official,
secure websites.

Image 1
Image 2
GLM detects lightning flashes in cirrus plume in light rain area north of main convective line. See cursor location in (Image 2) for the cirrus flash spreading northward. -Jake Johnson
The storm cluster across N TX began to gust out late in the afternoon. Line motion was ~43kt as the storms surged across Montague county just south of the Red River. There was a report of wind damage in Texas (power poles blown down) and in Oklahoma (estimated 60-70 mph winds) associated with the storm cluster. ProbWind was as high as it has been the past couple of days in the 92-95% range during this time. Of note, the Flash Rate was very high with the identified object, at times nearing 150 fl/min and the AzShear was ‘strong’. This combined with the environmental parameters helped increase the wind probs throughout the life of this cluster as it moved ENE. ProbWind was equally high with other objects to the northeast and southwest of the featured storms yet no wind reports were received from them. Interestingly though, ProbTor was ~30% with the Montague county object at this time helping draw attention to it.
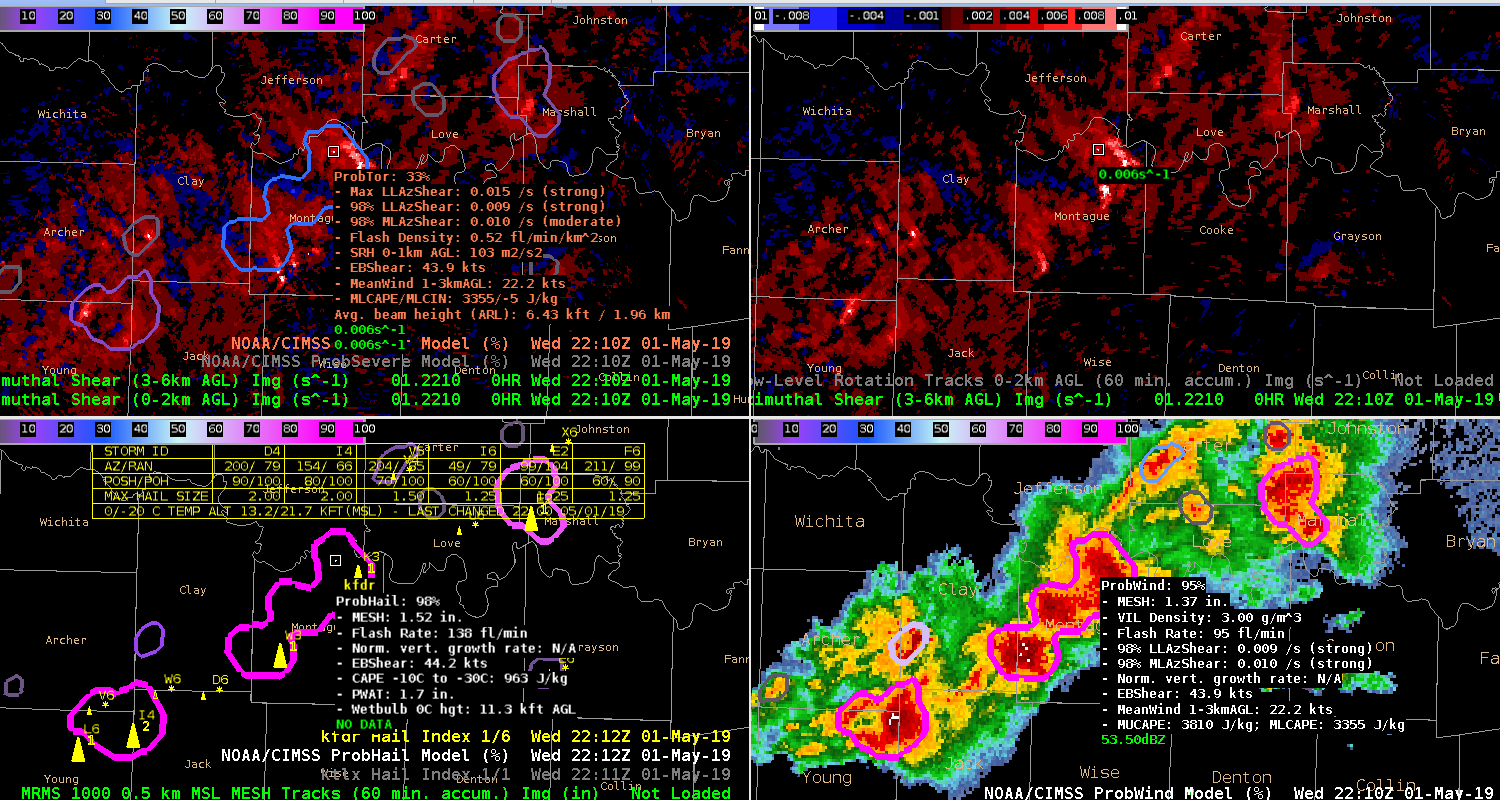
Low Level AzShear (UL), Mid Level AzShear (UR), ProbHail (LL), ProbWind (LR)
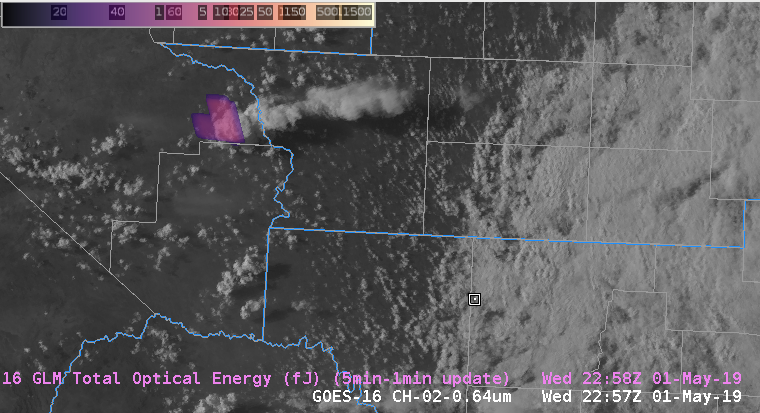
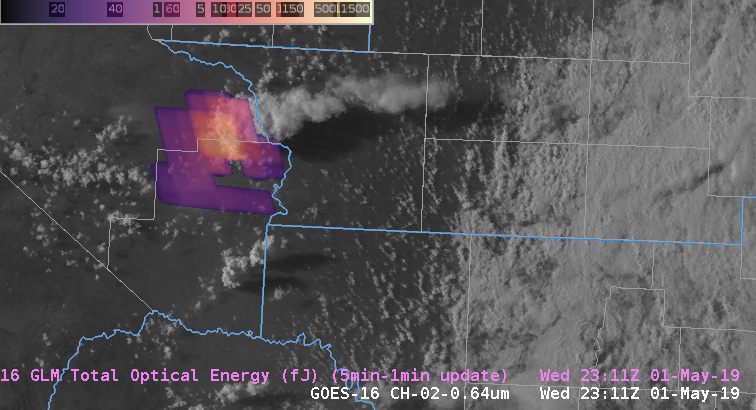
GLM Total Optical Energy product shows rapid increase of lightning in a 14 minute span for a developing thunderstorm in southwest Texas. This is useful information to forecasters for diagnosing storm intensification which usually precedes a response on radar. -Jake Johnson
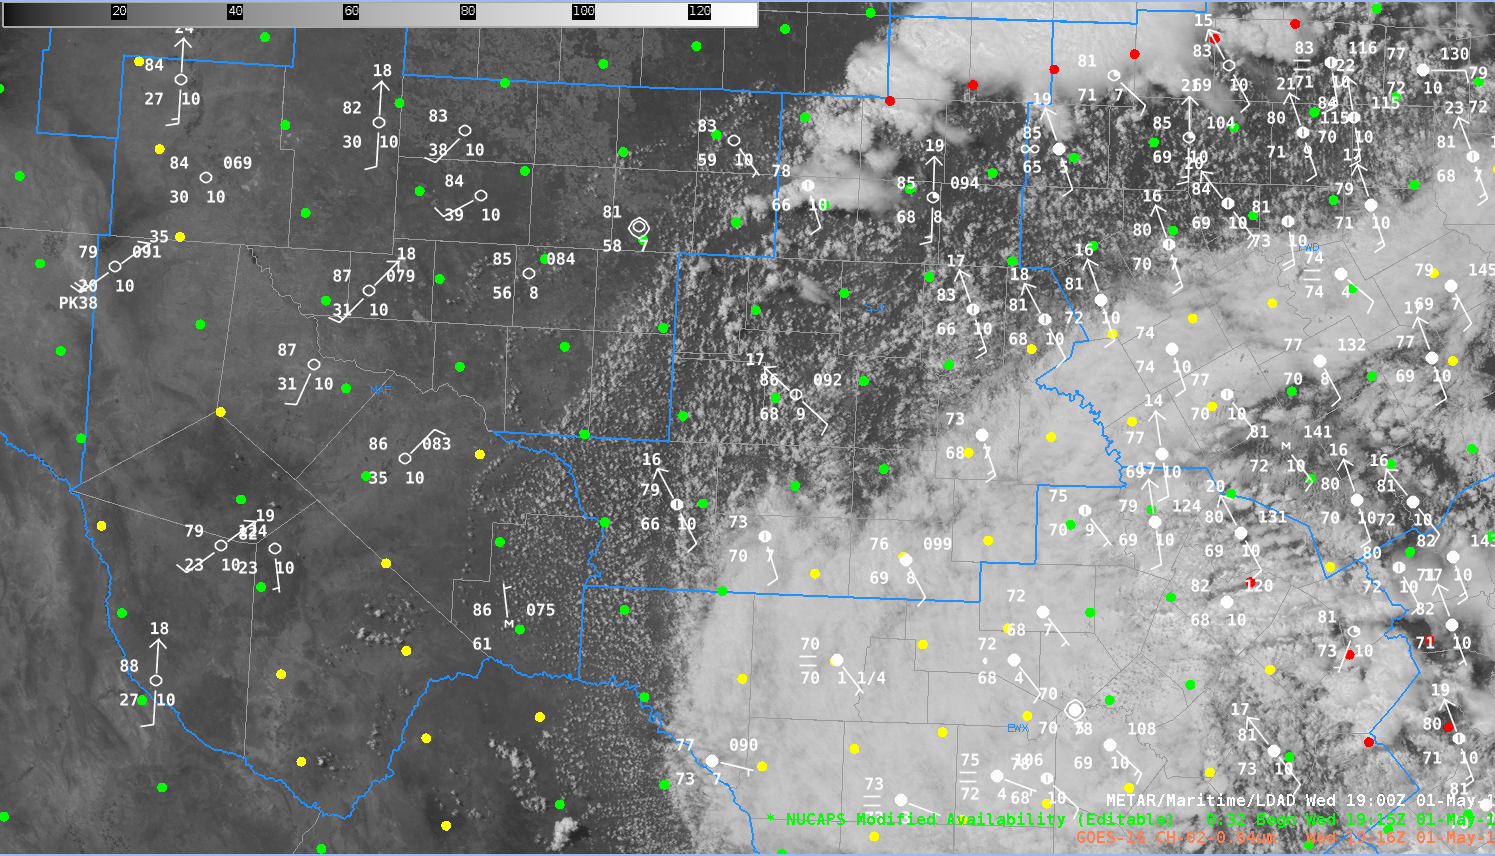
Figure A (NUCAPS Modified sounding points 1915Z
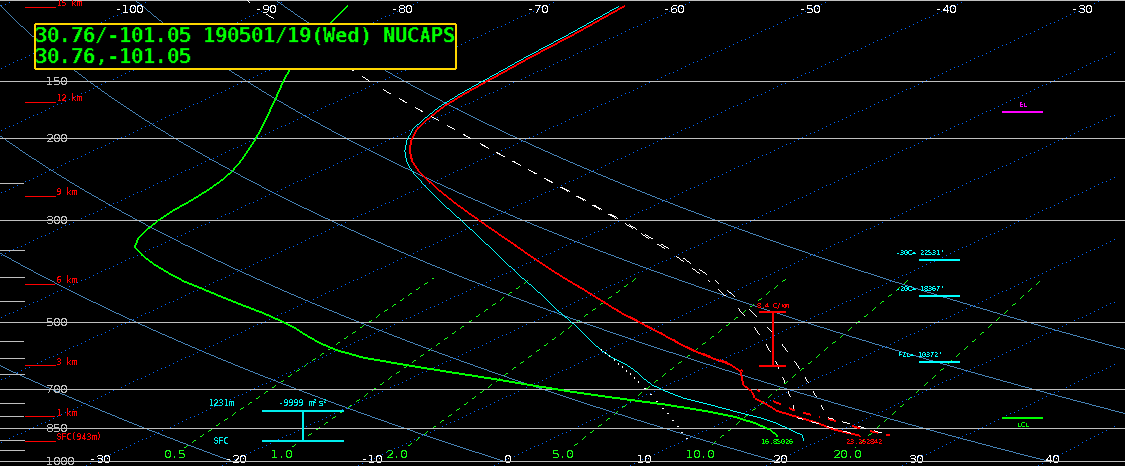
Figure B (NUCAPS Modified sounding point near KOZA, in the moist sector)
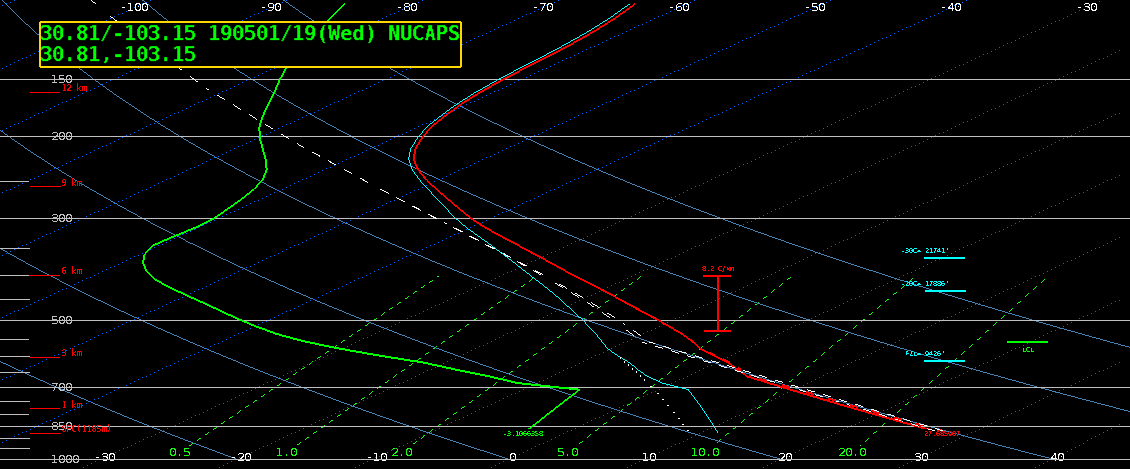
Figure C (NUCAPS Modified sounding point near KFST, behind the dry-line)
This is a comparison of NUCAPS modified sounding for locations west/east of the dry line.
Figure C NUCAPS Modified Temp/Dew….82/27 KFST Metar Temp/Dew….86/35
Figure B NUCAPS Modified Temp/Dew…75/62 KOZA Meter Temp/Dew…79/66
-Jake Johnson
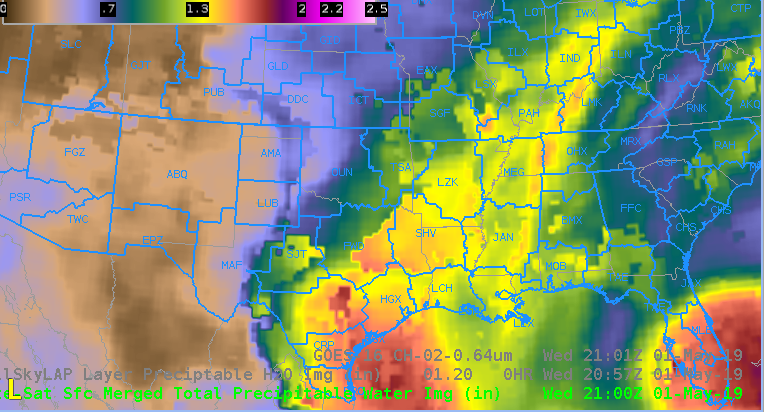
Figure A (CIRA Merged PW)
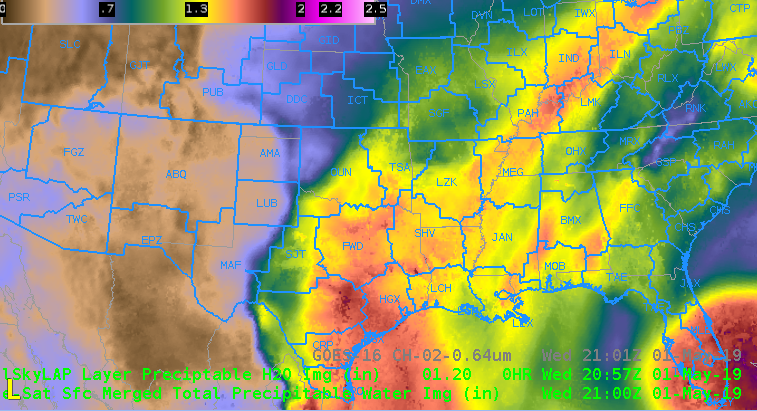
Figure B (All Sky Total PW)
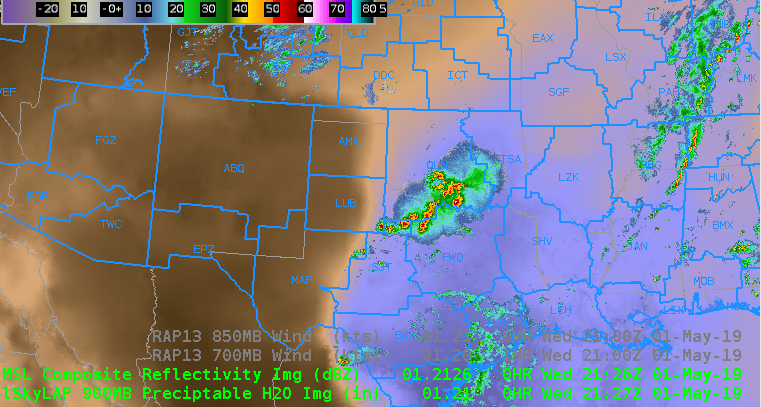
Figure C (All Sky Sfc-900mb PW)
Notice the big difference in Figure A compared to Figure B from DFW to OUN coverage area, Figure B with All Sky Total PW was handling the plume of moisture streaming northward much better. This also correlates well to area of deep convection in Figure C in the deeper moisture region. -Jake Johnson
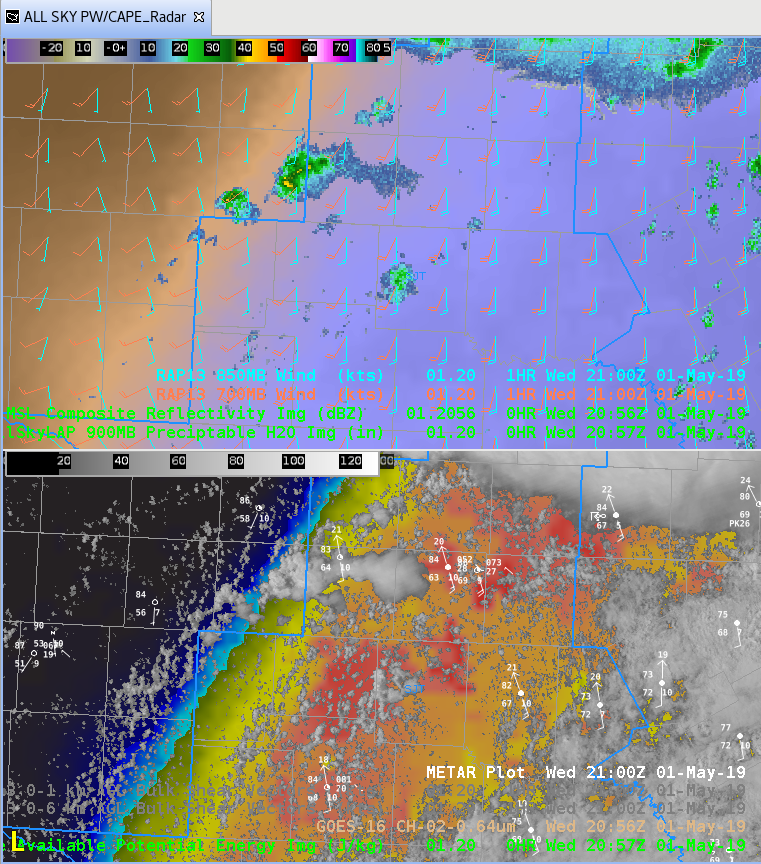
All Sky CAPE image depicts the dry-line nicely in west Texas with a thunderstorm developing along the this CAPE gradient. This is very helpful for mesoscale analysis. Also can see another storm trying to develop southeast from the dry-line storm with-in higher CAPE area.
-Jake Johnson
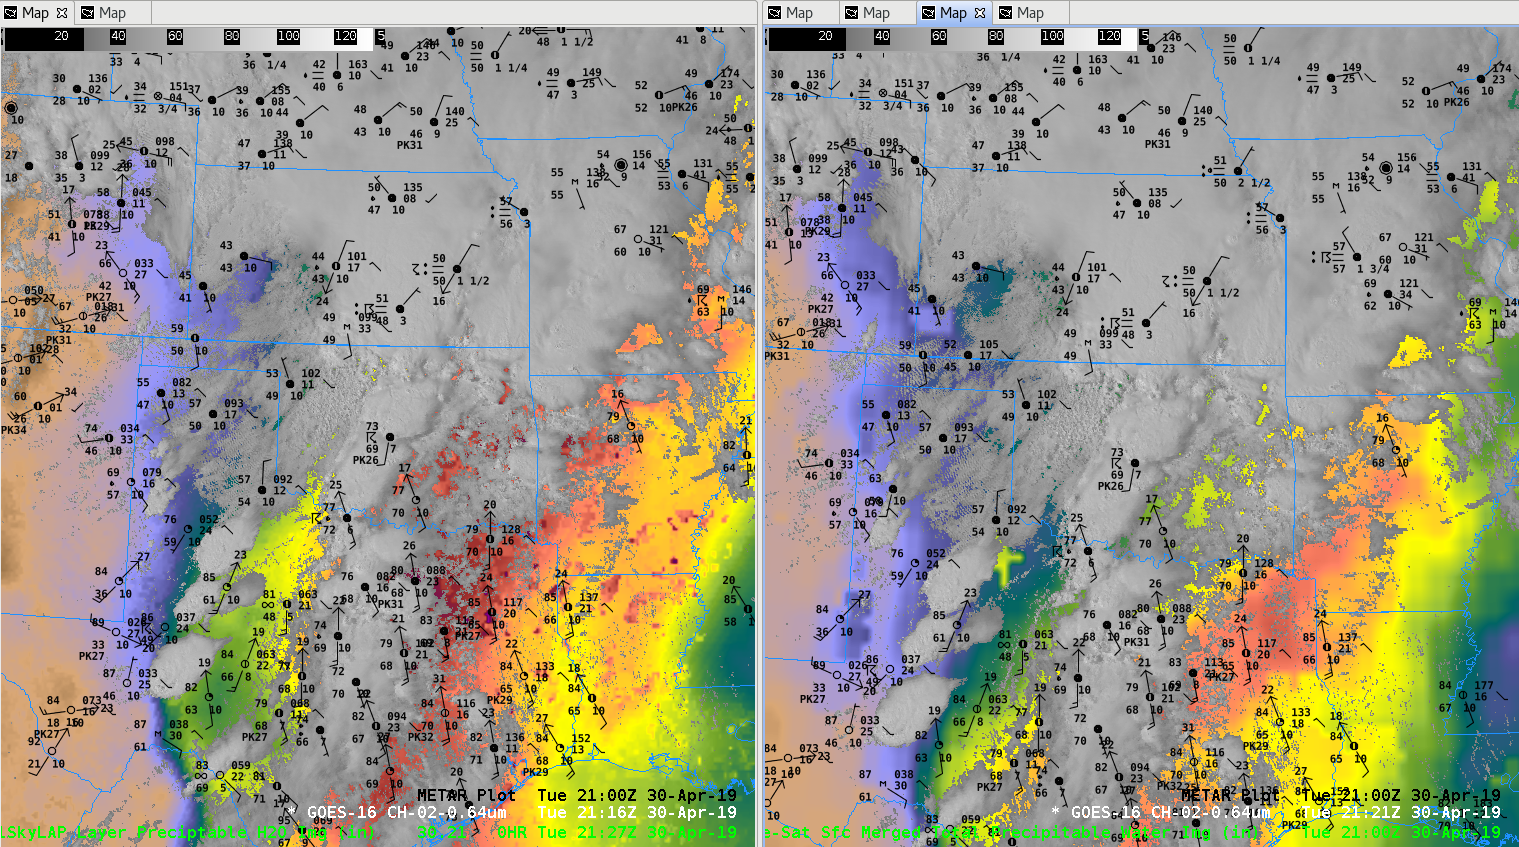
Figure A
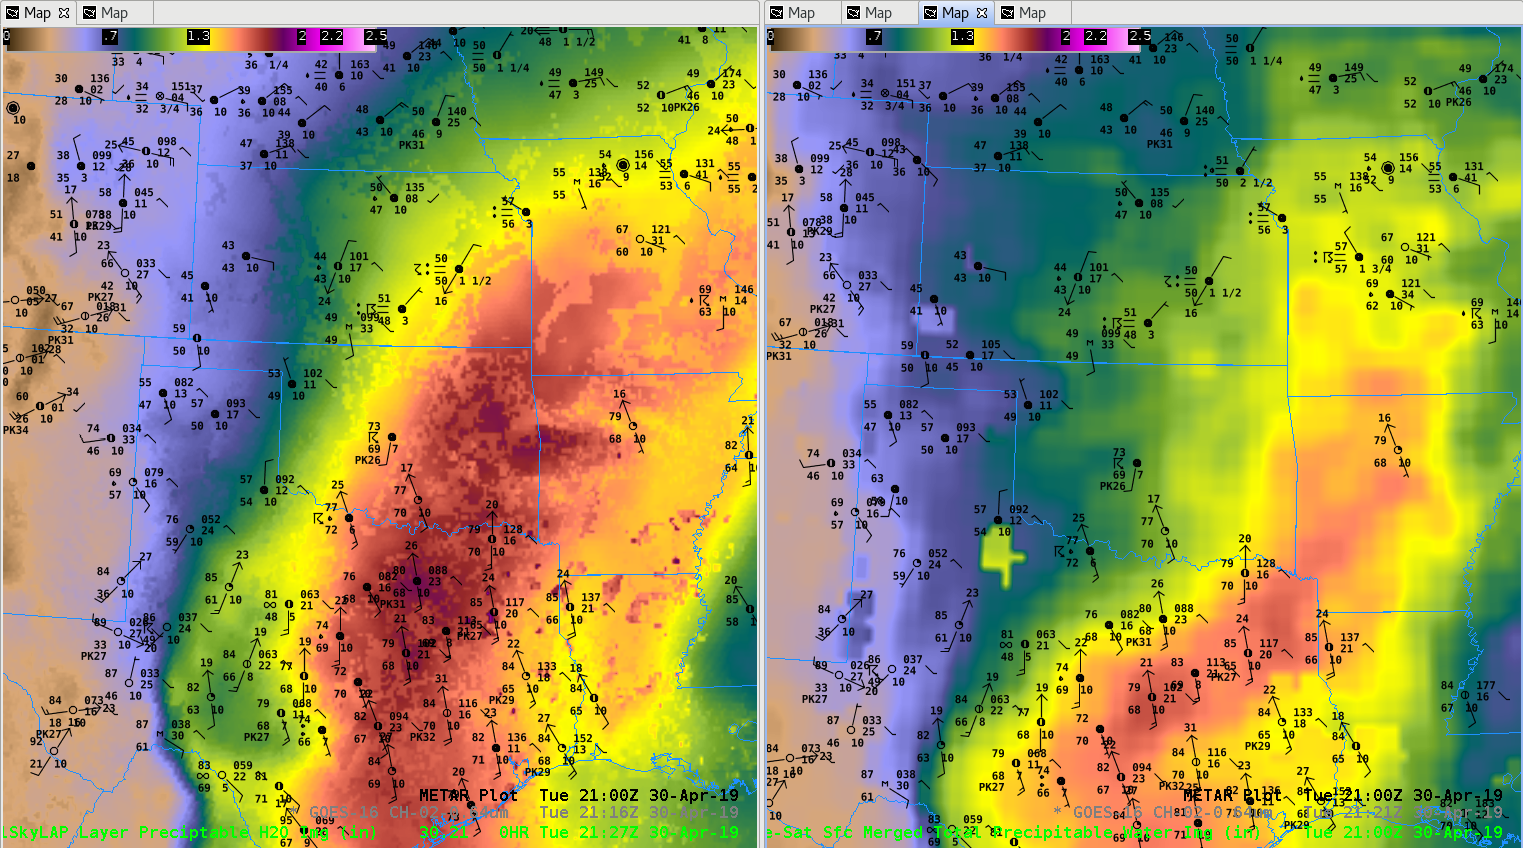
Figure B
All Sky Total Layer PW did a better job in Figure A with western gradient of moisture where convection developed along dry-line compared CIRA Merged Total PW. All Sky also seemed to better capture the moisture plume through central Oklahoma into southeast Kansas.
-Jake Johnson
Feature following zoom showing the GLM pulsing phenomena associated with intensification/weakening of a supercell in OK/MO. During the third pulse, a TOR warning was issued.
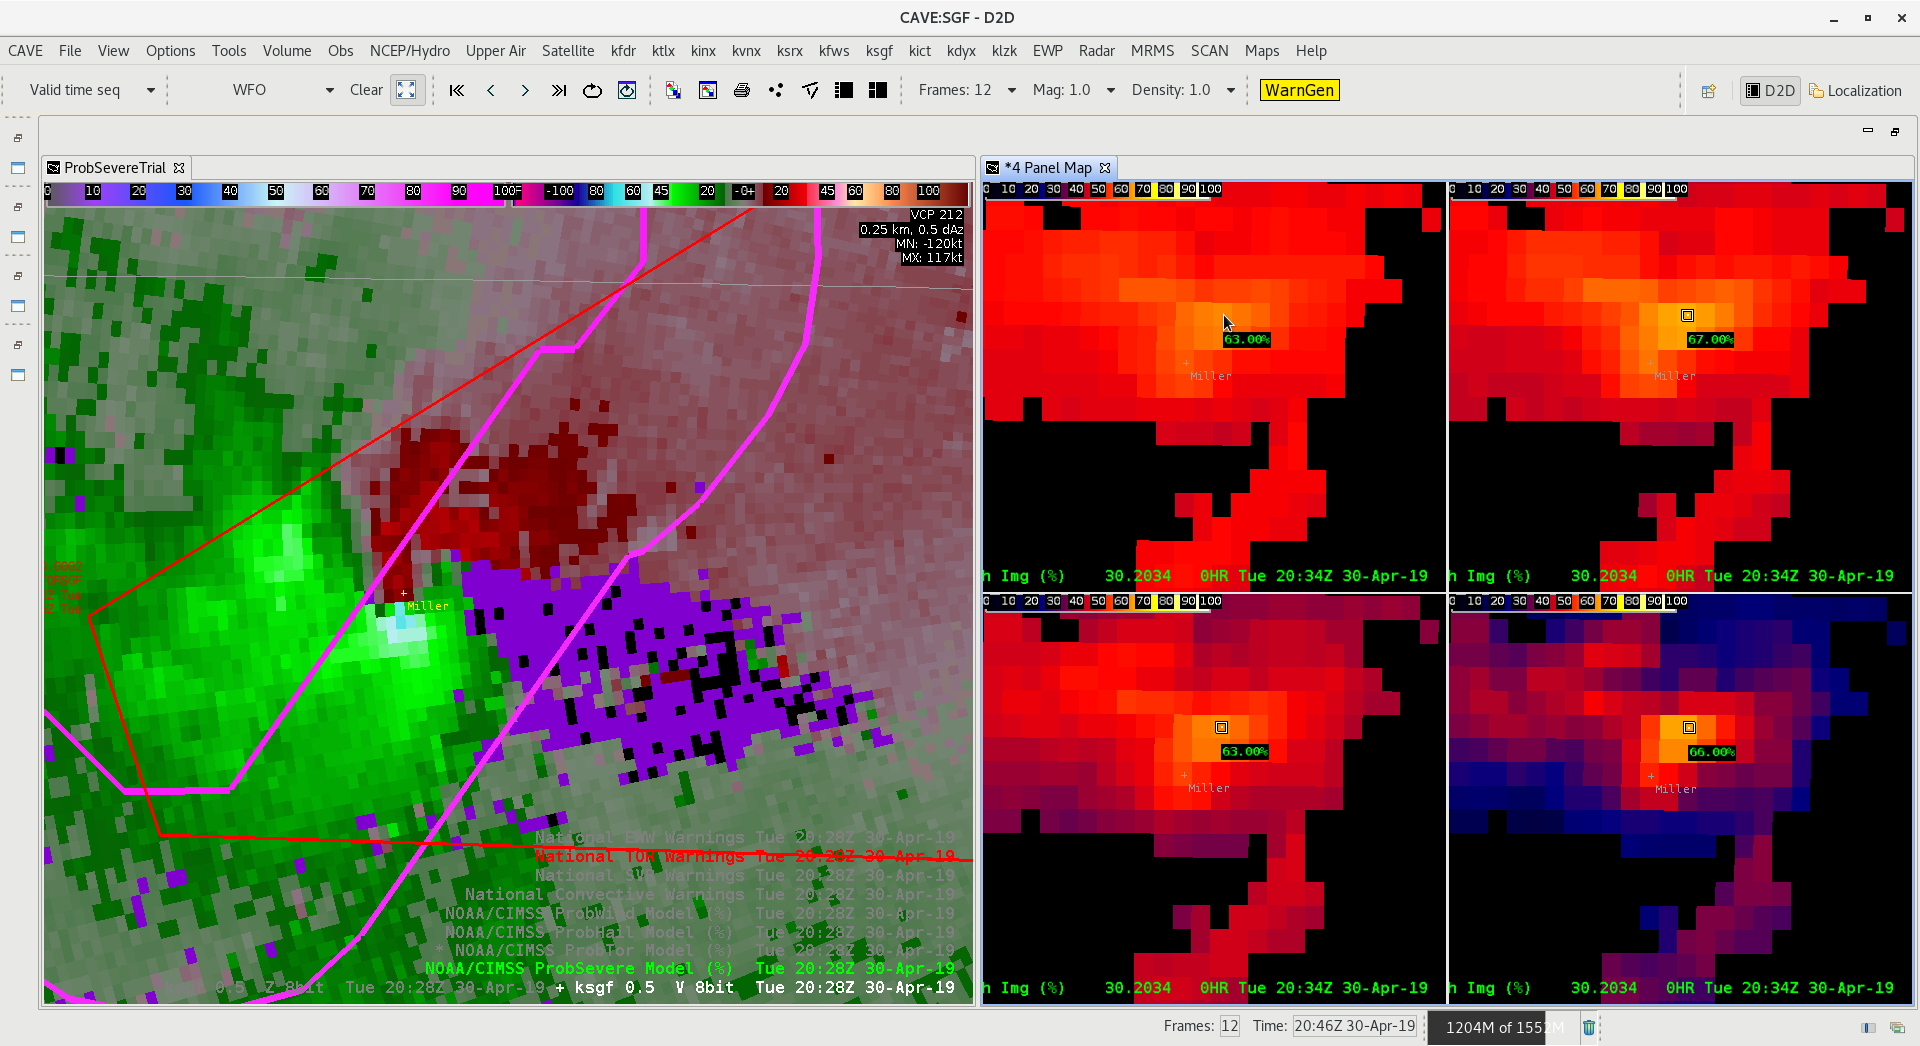
Case of CPTI values on a confirmed tornado near Miller, MO. No confirmed damage estimates yet, but TOR was confirmed at this time visually and with a TDS
Lightning jump preceding a tornado and then confirmed touchdown in MO Event Density over the same cell
 Minimum Flash area showing updraft core
Average Flash Area
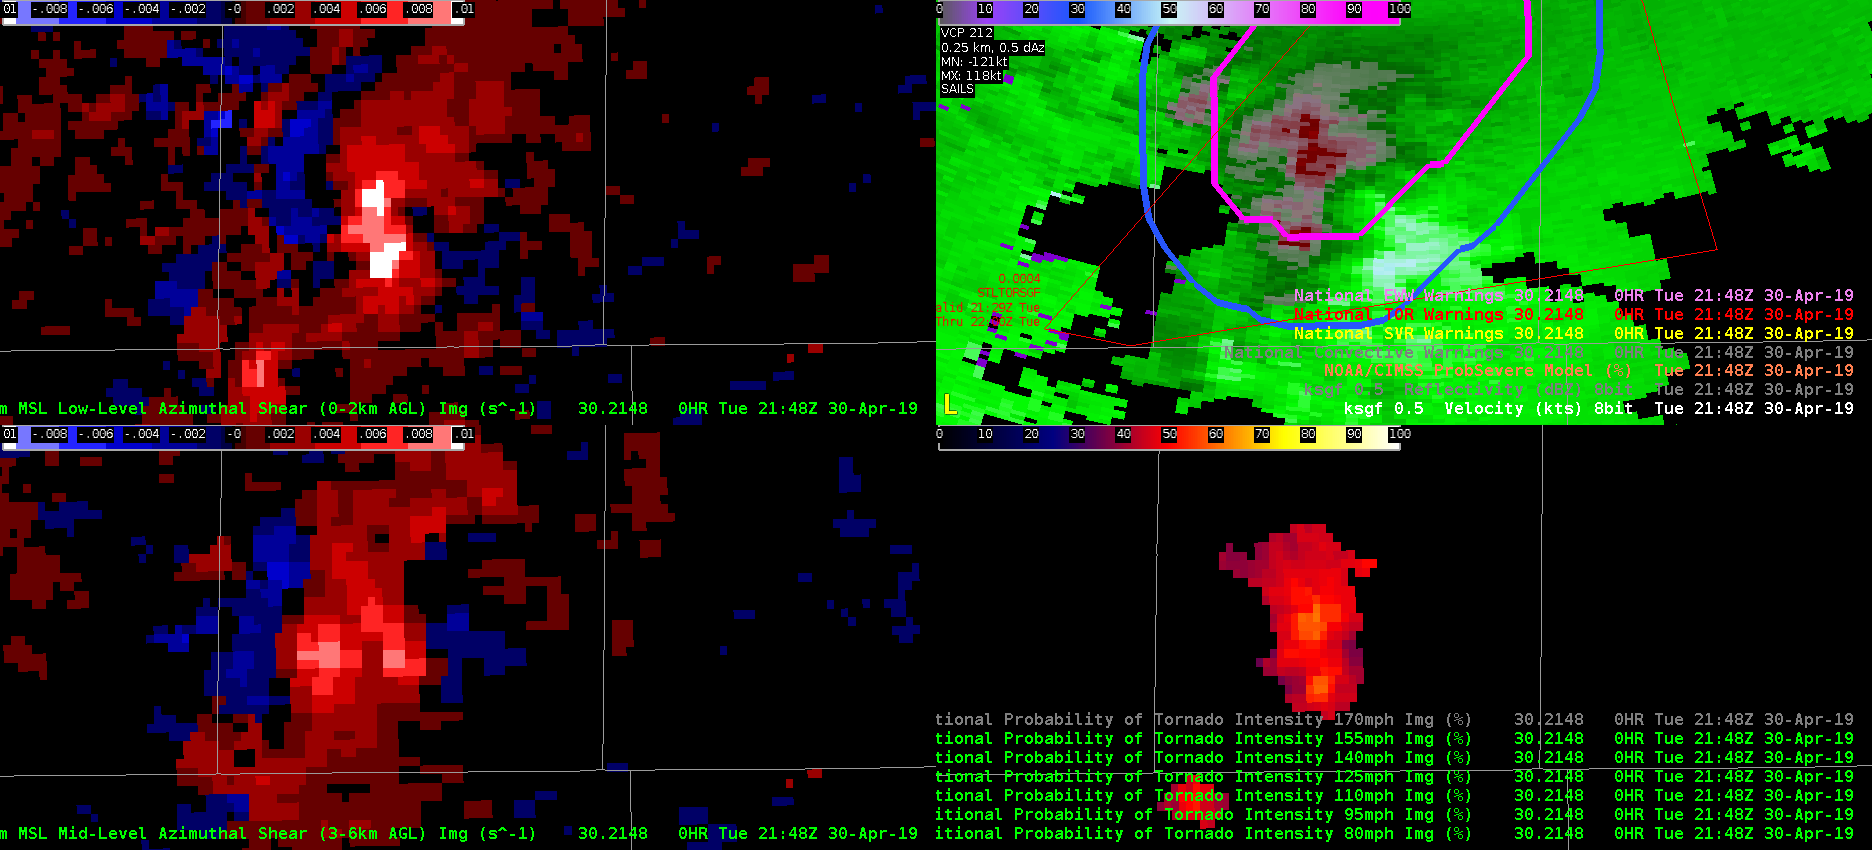 This is a case where AzShear overdid the tornadic threat This supercell had a circulation that never really tightened up. ProbSevere also vastly overestimated the tornado threat, likely due to nearby storm interactions and mergers. When convection gets messy, can we rely on these products as much?
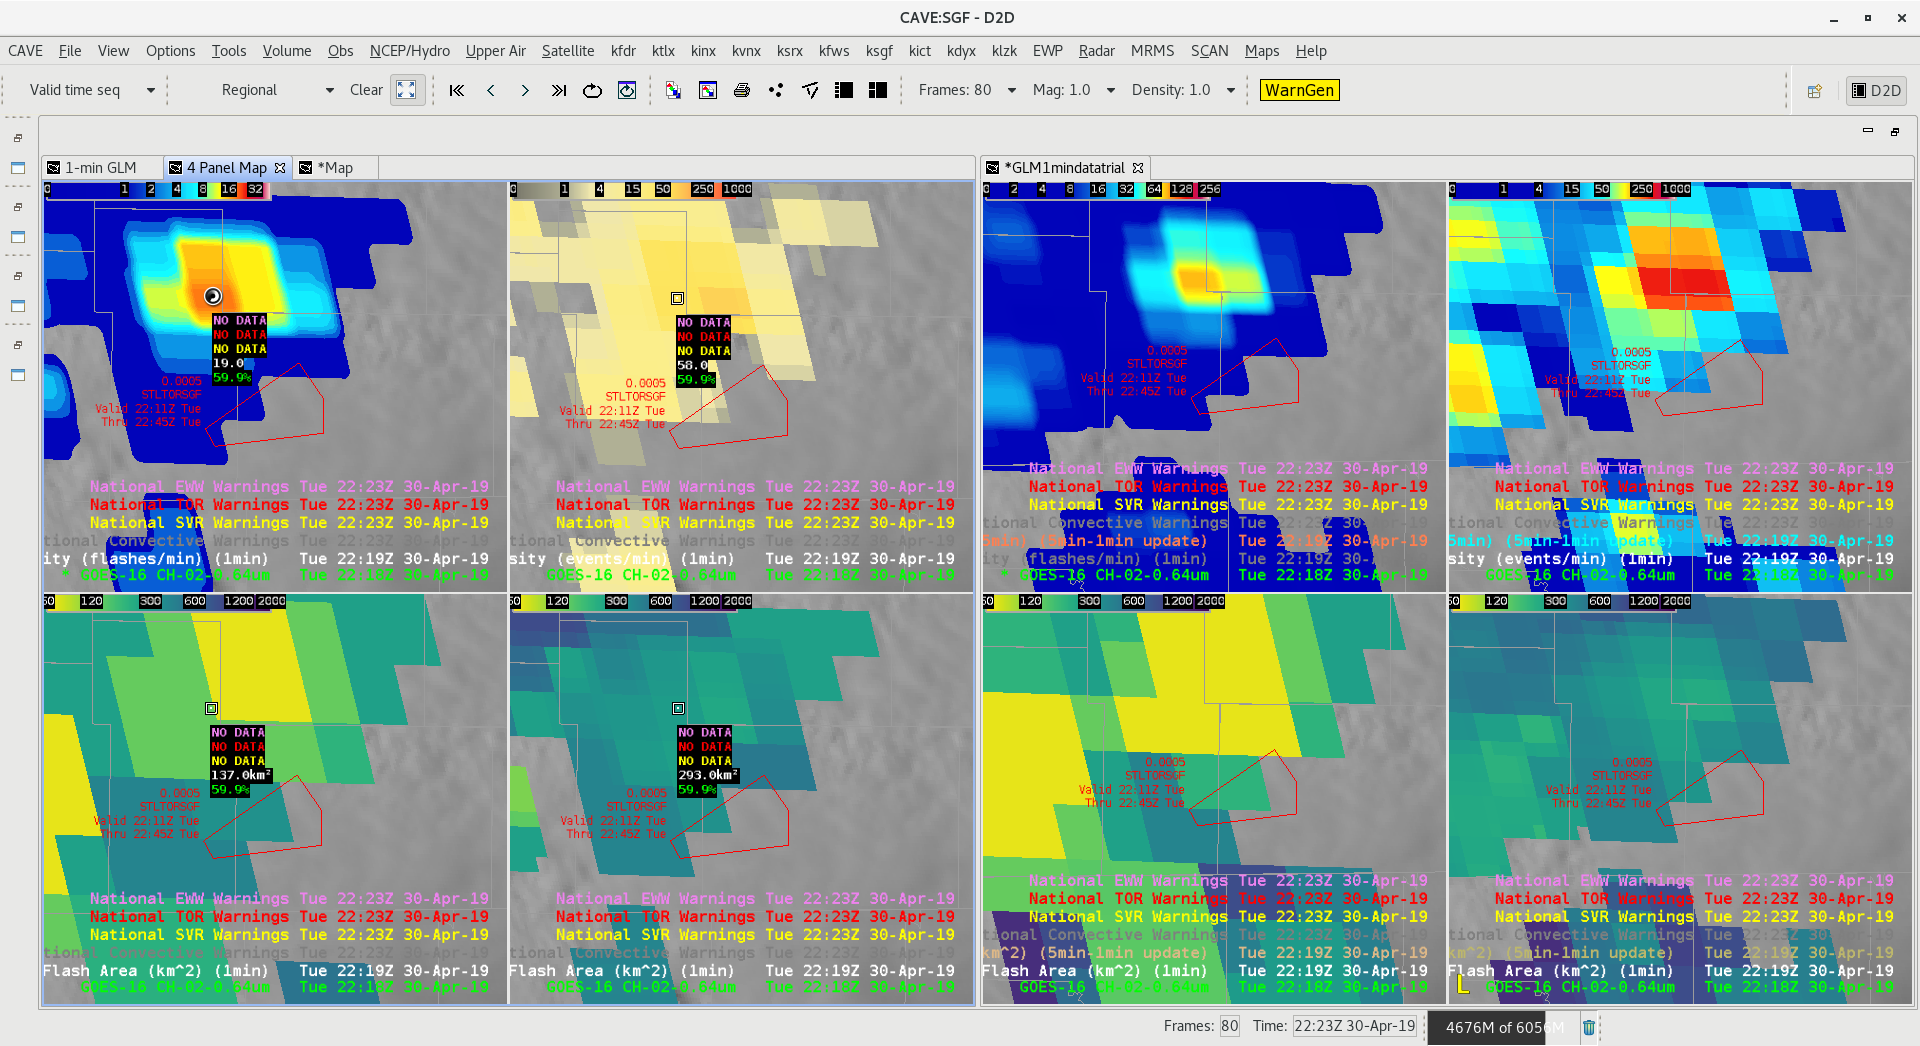
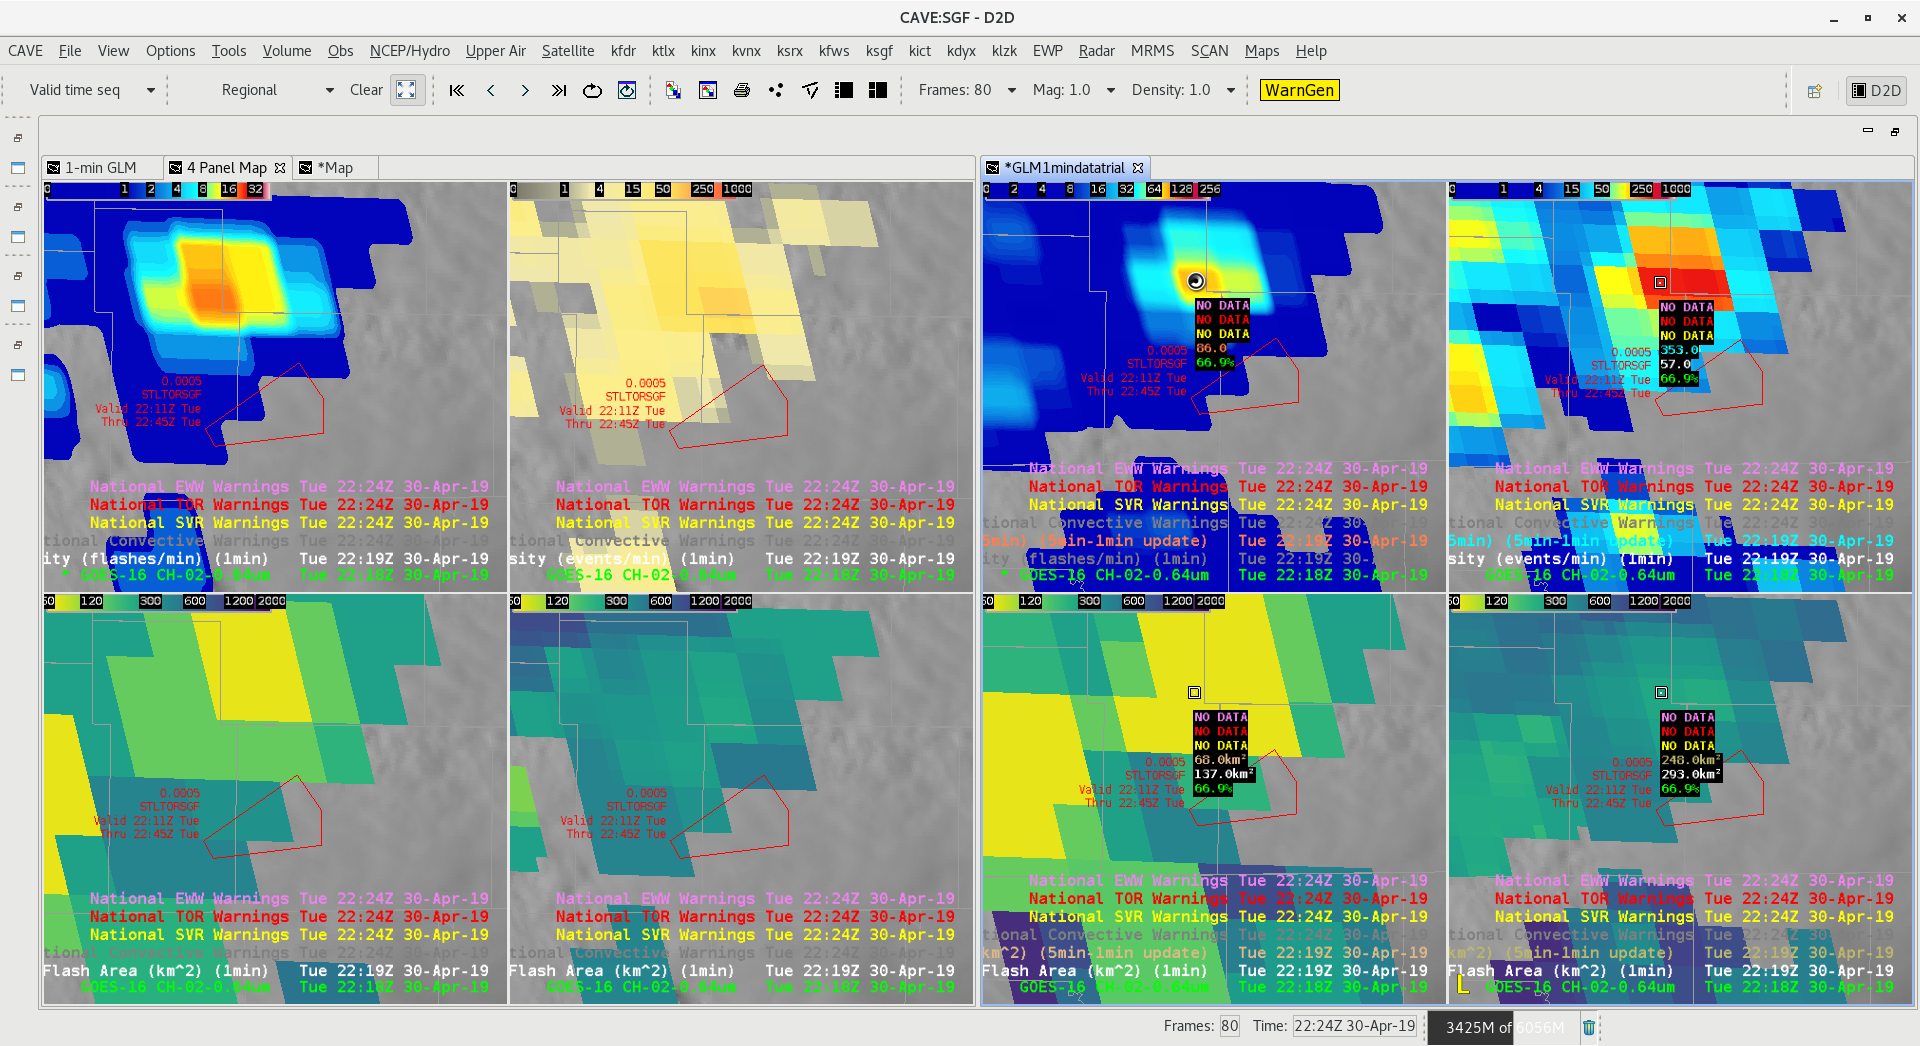
The two images above compare a 4 panel of 1 min GLM data (left four panels) versus 5 min data (right four panels). While the 5 min data was much smoother to view from an animation and trend sense, the 1 min data did provide some fine temporal resolution help during periods of rapid storm intensification preceding this tornado warning.
The above two loops compare 1 min looping (top 4 panel) versus 5 min looping (bottom 4 panels). In a loop the ‘flashy’ nature of 1 min data makes it less desirable in operations, however manual toggling and advancing still make this data useful.
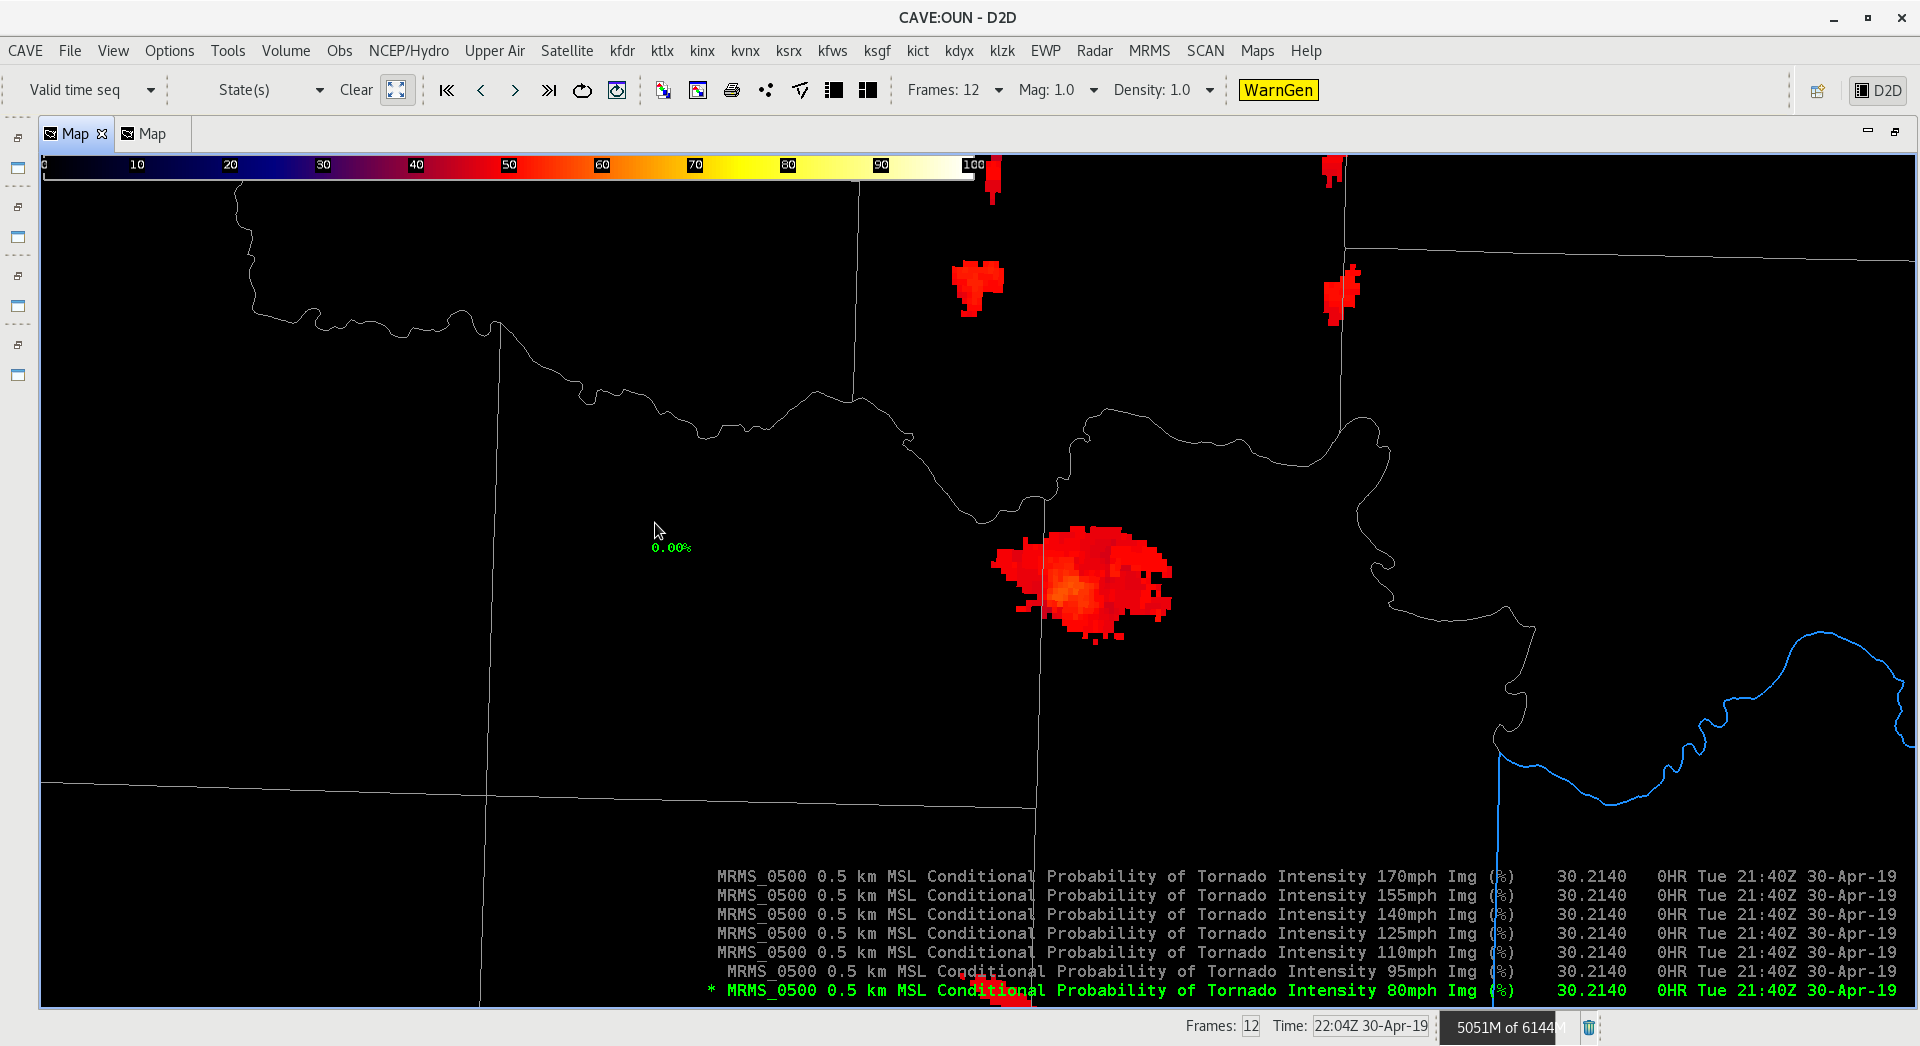
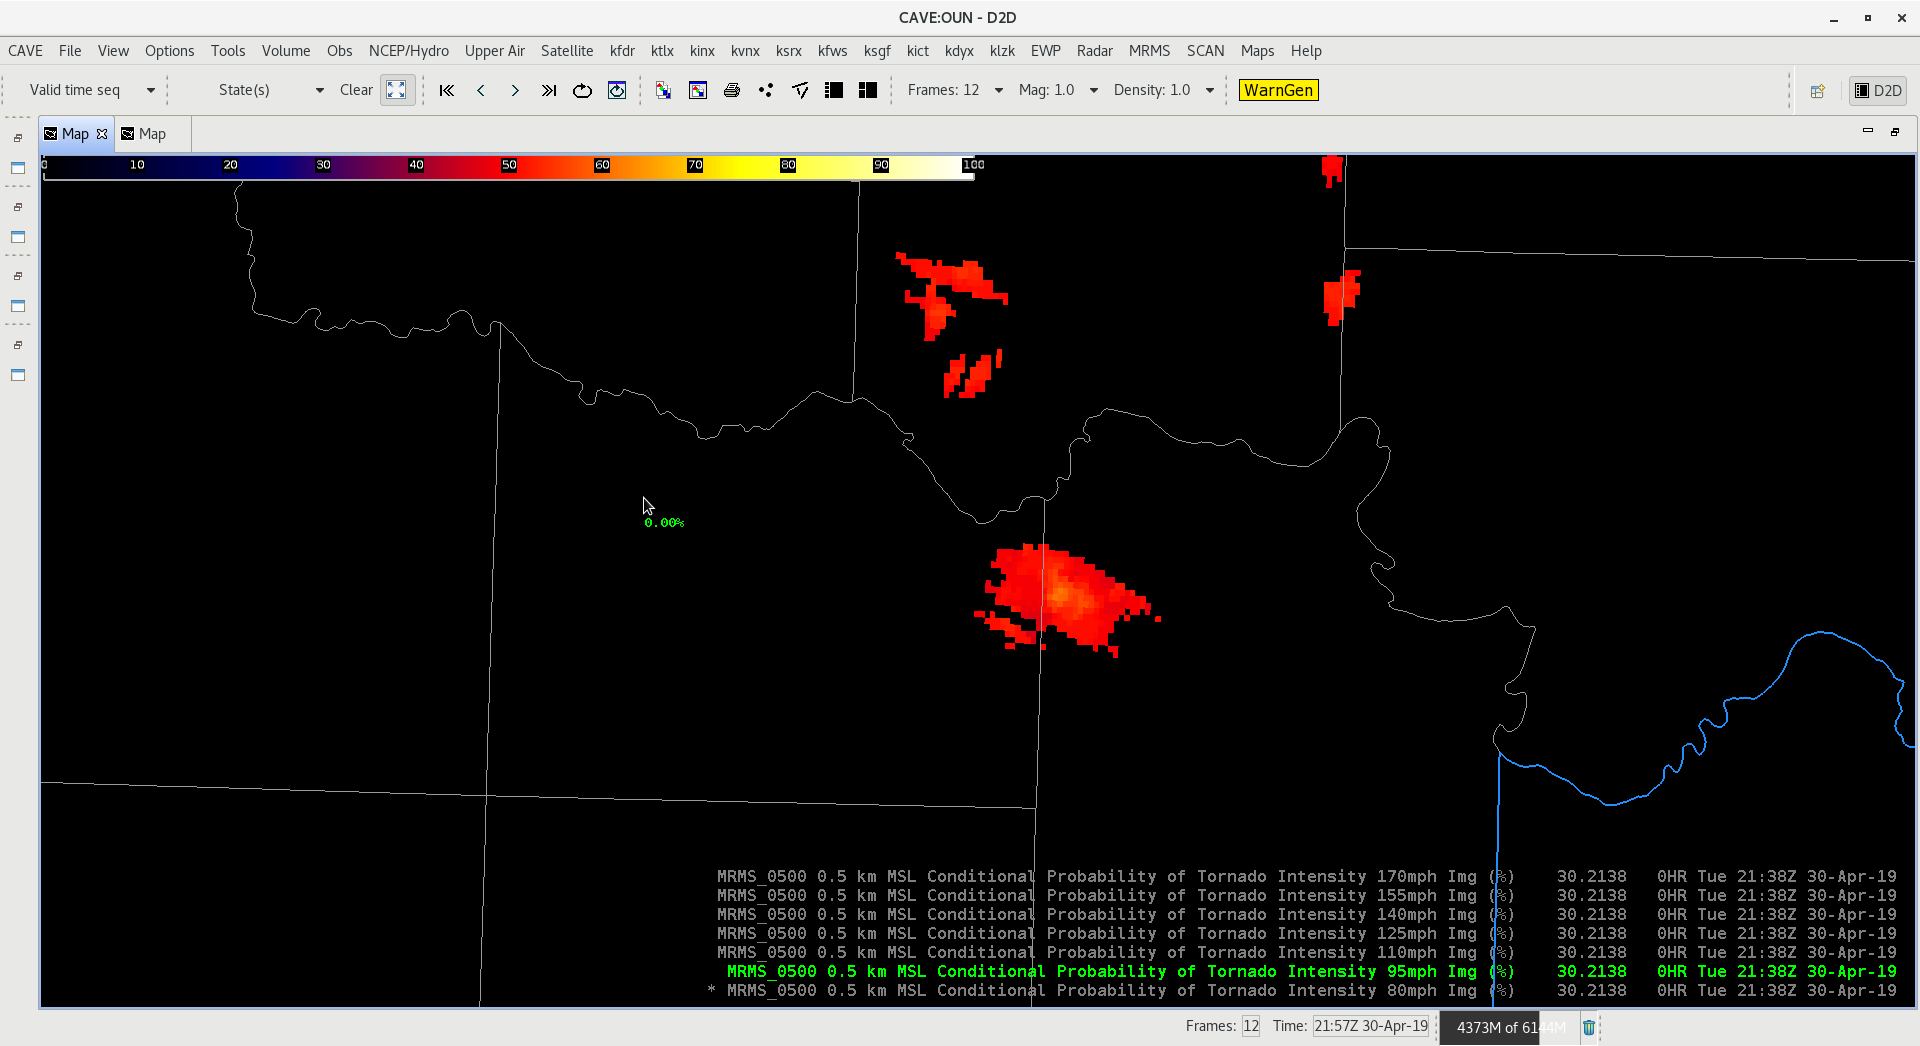


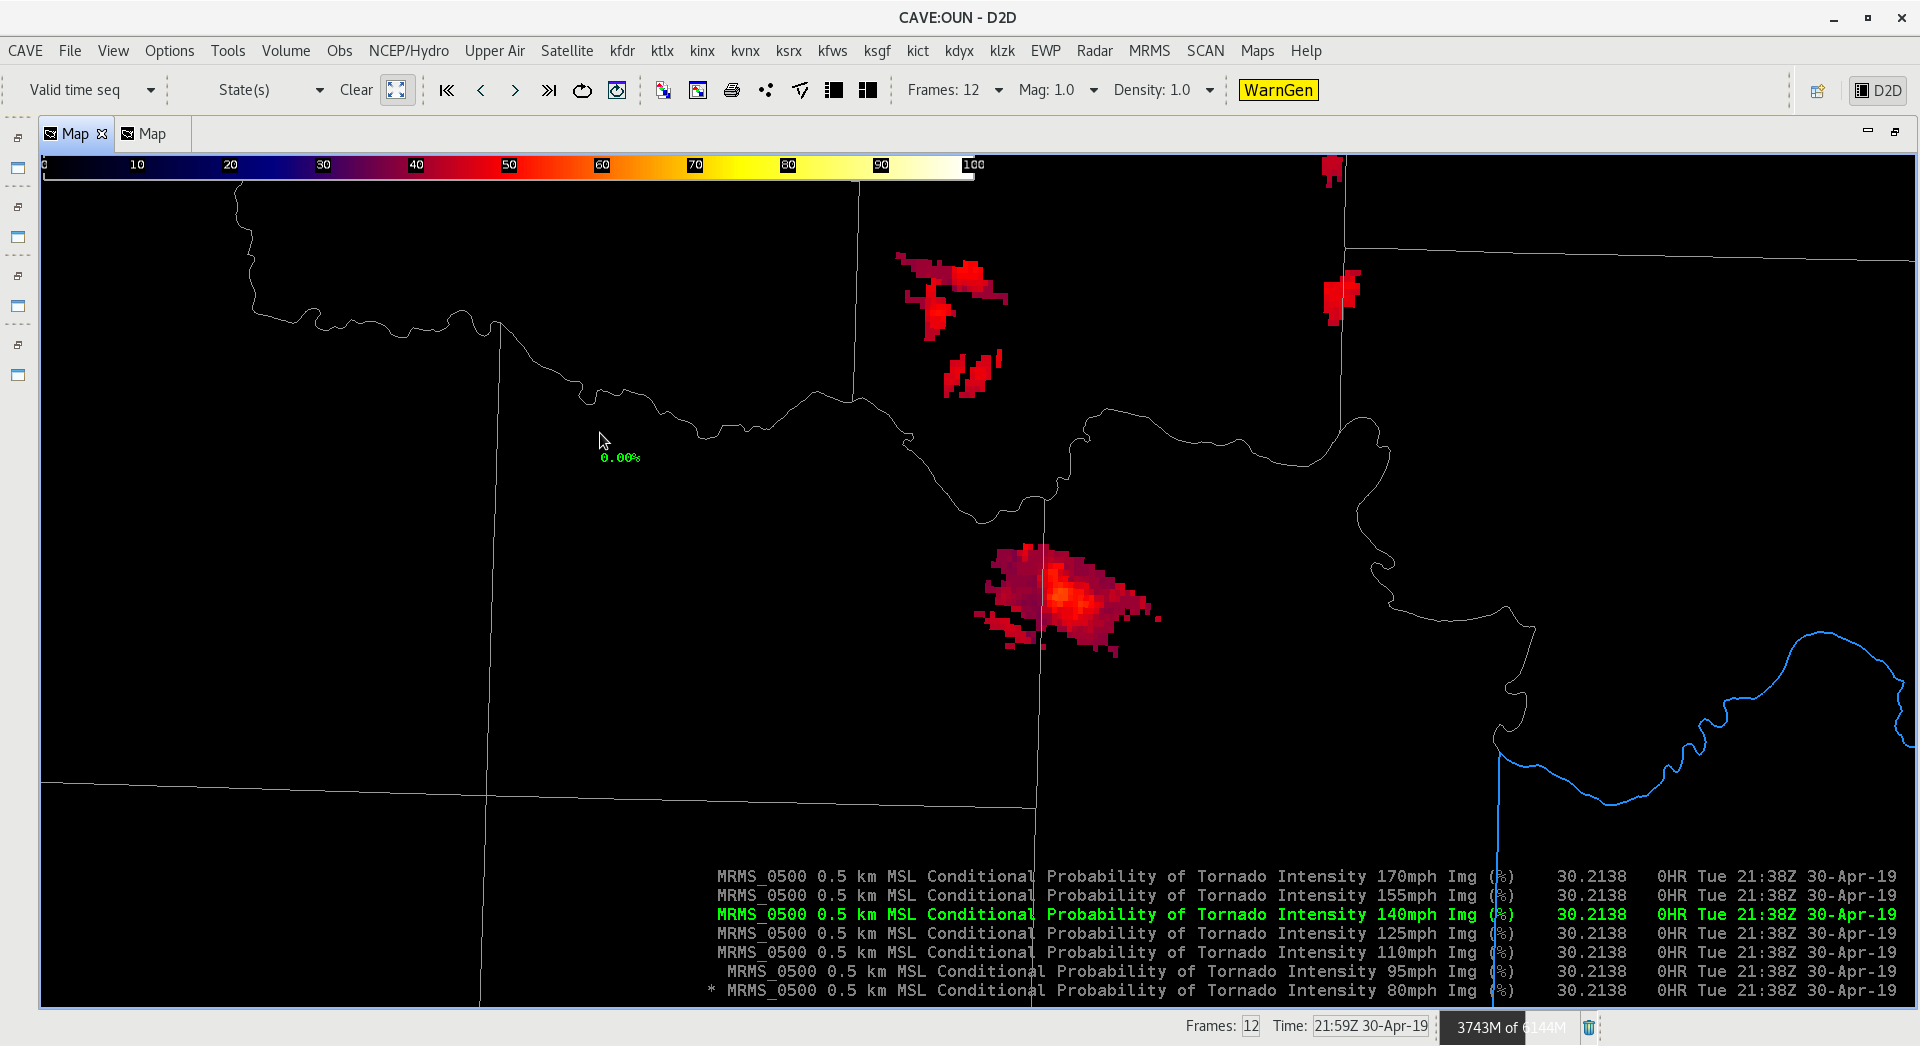
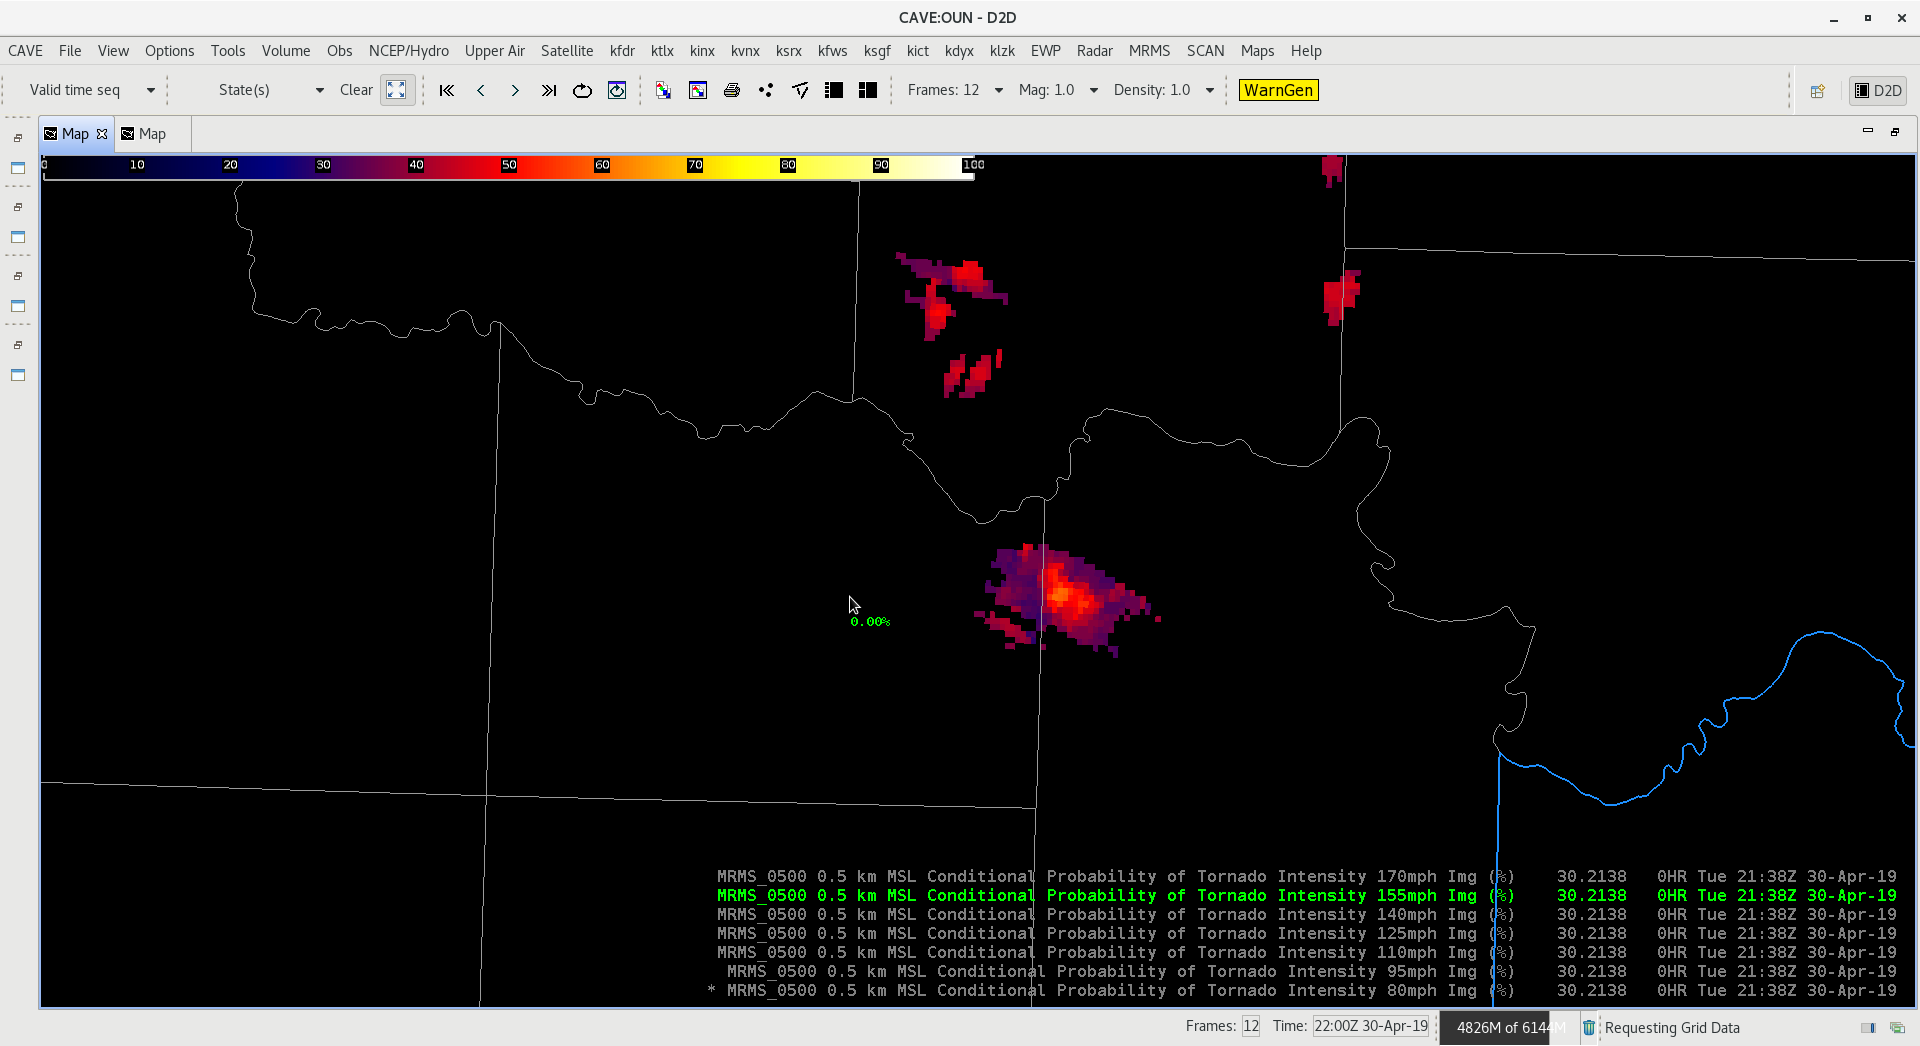
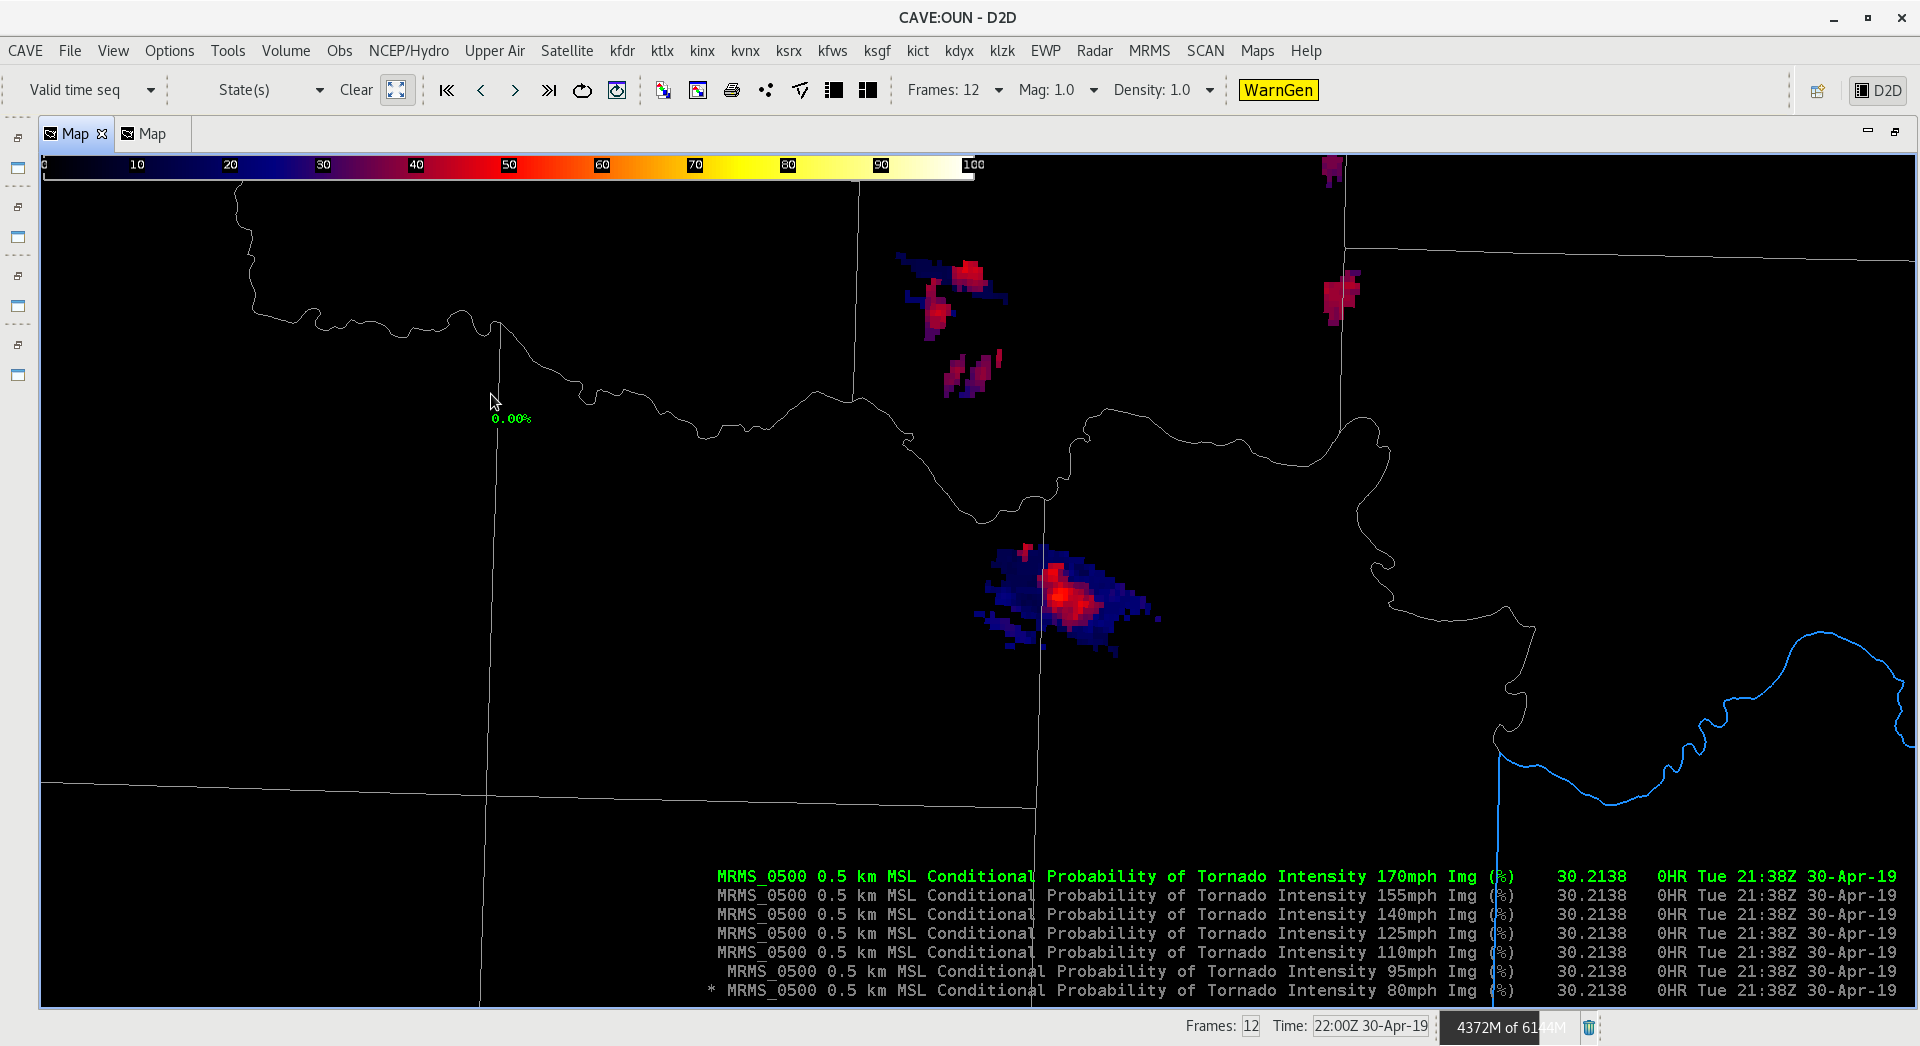
CPTI product shows very little change in the probabilities from one level to the next, therefore i recommend doing ranges with this analysis. This should highlight the threshold ranges of interest in a better way.
For example: Cat 1 (80-110mph), Cat 2 (125-155mph), Cat 3 (170+ mph)
-Jake Johnson
GLM showed a lightning increase (5 fl/min @ 20:39 to 12 fl/min @20:44) prior to tornado report and TDS signature at 20:56. Once the circulation weakened the lightning rate also dropped back to 5 fl/min. The min Flash Area kept a consistent look as the updraft moved east-northeast.
–SCoulomb