Visible and GLM for developing supercell

Two supercells developed in far southwest Oklahoma along 0-3km CAPE gradient.  At 1957Z ProbSVR Hail 10% Wind 39% Tor 3%, then 6 minutes later at 2003Z ProbSRV Hail 63% Wind 75% Tor 5% on the southern storm.  GLM Total Optical Energy in lower left image performed well with the increase in lightning activity for both supercells.  -Jake Johnson

SC Entering Washington County

This storm has had consistent Azhear max for past several volume scans, but again does not seem to match low-level SRM scans very well. Prob Tor has increased and remained steady at about 75 to 77 % CPTI has remained slightly over 50%. Upgraded SVR to Tor possible. Reflectivity structure suggests increasing organization with well organized ZDR arc arc suggesting increasing SRH. May upgrade to tor shortly given better storm structure in base data. Quick Twip

Advantage of AZ Shear

Favorite part of the Azimuthal shear product so far is it can highlight some areas of the storm that need to be investigating…if you are watching a different storm and want to do a quick look at your CWA this can grab you attention to a storm that needs to be looked at next.

South Beach

AZShear and CPTI Product for TUL SC

Watching storm northeast of Hominy @ 1854 utc. 0-2 km AzShear has been showing persistent max with the cell but seemed to displaced to far west of broad circulation. 0-2 kn Azshear not very helpful with this storm given displacement. CPTI has been showing consistent 50-55% 80 mph intensity probs for past several scans.  – quik twip

ProbSevere MouseOver

ProbSvr readout is becoming so long it is hard to fit within a 4_panel. It is not usable as a readout in a 9_panel due to the number of parameters being shown. Perhaps combine the LLAzShear into a single line such as (Max,LLA,MLA) (0.004/s,0.0002/s,0.005/s) to save space???

— S Coulomb

Brewster Co TX storm not so Punky but modified NUCAPS was

The modified NUCAPS sounding over Brewster Co TX was more representative of the actual conditions at 20Z versus the regular NUCAPS. A dryline was positioned very near the point of interest and convective initiation eventually occurred  near the boundary in ~1000 ML CAPE air around 22Z.

Modified NUCAPS sounding w/ surface Td near 47F. MLCAPE ~ 1000 J/kg.

Regular NUCAPS sounding w/ surface Td near 54F. ML CAPE ~2000 J/kg.

RTMA Td analysis. Point H is where the NUCAPS sounding was taken from.

GOES-16 RGB at 2150Z showing CI occurring near the dryline.

GLM Min Flash Area…Best Practice

Figure A

Figure B

Best Practice:  Look at lower left image on both Figure A and B (GLM Minimum Flash Area), notice Figure B has interpolate turned on which makes the product less useful since outer edges also have minimum values.  The GLM Minimum Flash Area of interest jumped out much better on Figure A without interpolate turned on.


Figure C

Blending both All Sky Sfc-900mb PW and Visible satellite imagery together for convection initiation in western TX panhandle.

AZShear case 2/23/19

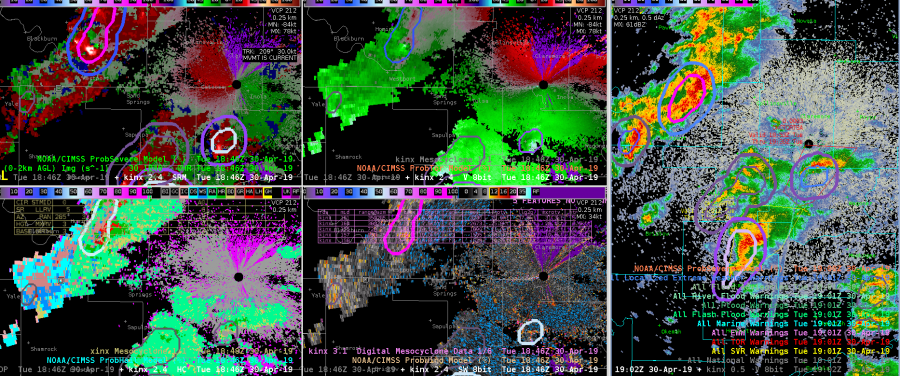
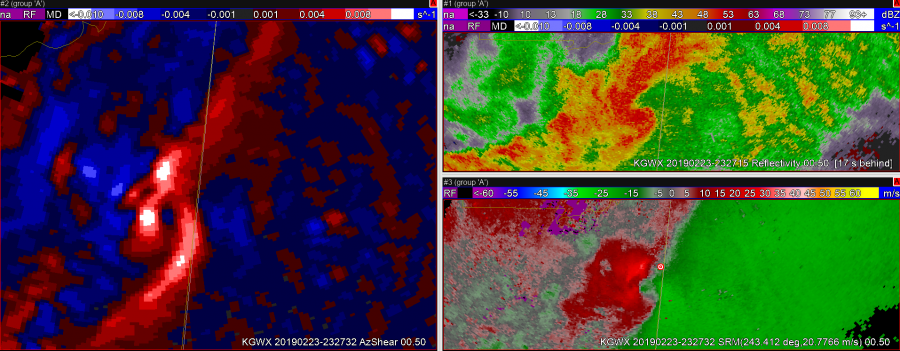
First impression of the single radar AzShear……display is rather noisy with lots of couplets…many not associated with any storm. Perhaps if had the option to filter out negative values (blue) so can focus on positive values only would make for easier digestion of data and enhance SA.   IN current state of product, would have have to be sure to compare to base velocity data, etc.

Azshear did  help draw my attention to potential cyclic nature of the storm and picked up on increasing shear to northeast perhaps a little sooner than if I had not been looking at it.  Pickup up on second circulation and locked on to it very well as second tornado(?) developed.

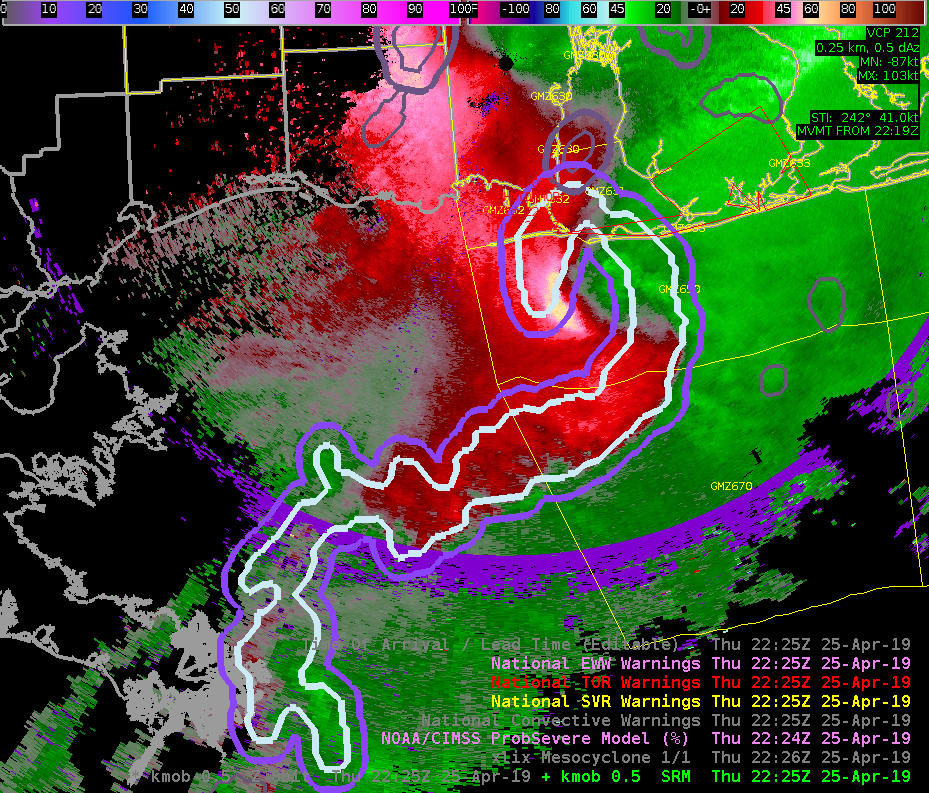
Azshear also seemed to highlight the shear along the RFD/Flanking line rather well.

0-2 km merged product provided similar information.  Did not have good feel for 3-6 km product yet.

Again, biggest drawback is the noisiness of Azshear.  I could see where this could distract from true area of shear associated with developing mesocyclone. Color enhancement could be improved as well.

Quik TWIP


02 Feb 2019 AzShear Case

AzShear helped identify a new developing circulation ahead of the reflectivity signature. This provided added SA in watching for new meso development. It also “might” help identify quick spin-ups along a surging bow echo or RFD. At first glance, false alarms appeared to be minimized but this was a fairly classic supercell case with at least one strong tornado and clear debris signature.

— S Coulomb

Large ProbSevere Blob

Here is one drawback of ProbSevere that has been briefly discussed. The areal extent of the identification is not based off of some of the features that feed into it, but rather the dBZ reflectivity representation. In this case, for a MCV and line of storms, the blob below is approximately 152 miles long using a center line to calculate the distance. ProbSevere kept this size of storm for two 2 minute calculations before breaking the storms apart into several different identifications.

-Alexander T.