

The CIMSS NearCast Vertical Theta-e Difference Mid-Low product depicted a minimum area of values -2 to -3 K at 19 UTC on May 15 in southwest Arkansas (top image). The next two images of this variable depicted at 22 UTC and 24 UTC has this minimum area moving east southeast into southeast Arkansas around 22 UTC then northwest Mississippi by 24 UTC. I wonder if storm development will follow this minima area for the next few hours. If so, the NearCast forecast tool would be especially useful in near term forecasting (1-6 hr) and can give forecasters a heads up where and when convection occurs.
Category: General
General Information and News


 Michael Scotten
OUN WRF – Doing well as of 1845Z Thursday

Here is an analysis of the OUN WRF and its ongoing performance. It seems to be doing quite well with the ongoing convection! As you can see in the picture above, there is a nice eastern line/area of convection that the model is picking up on quite well. It has the storm mode correct too, with discrete storm development currently ongoing. Will continue to monitor its performance through the day.
-Deitsch
Simulated Satellite Imagery Analysis – Thursday 1815Z

Just a quick look at how the simulated satellite imagery is doing early this afternoon. It appears to be doing pretty well! It may be just slightly overdone with convection across Oklahoma, but it has a pretty good handle on the larger-scale features. It definitely gives me some confidence in this model going forward through the day.
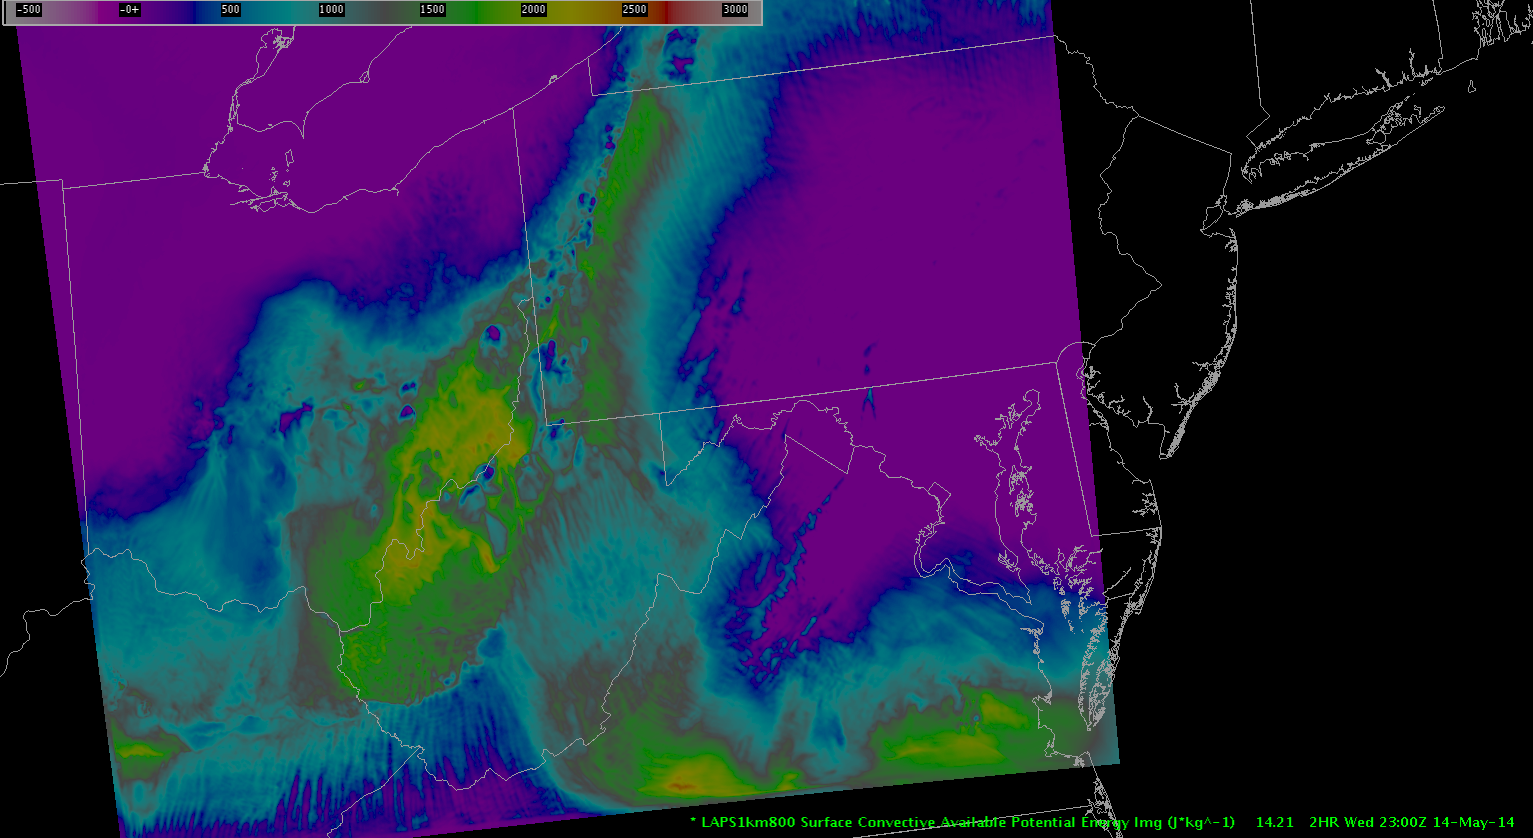
Severe storms in Western PA on LAPS
On Wednesday afternoon, a line of severe storms developed and began moving through western Pennsylvania. The LAPS 800×800 surface CAPE output was showing an interesting feature- relatively high CAPE levels (around 2000 J/kg; not bad for western PA).
 30 minutes later, and the values in this area are progged to be very erratic, with strong gradients in CAPE developing along this same line.
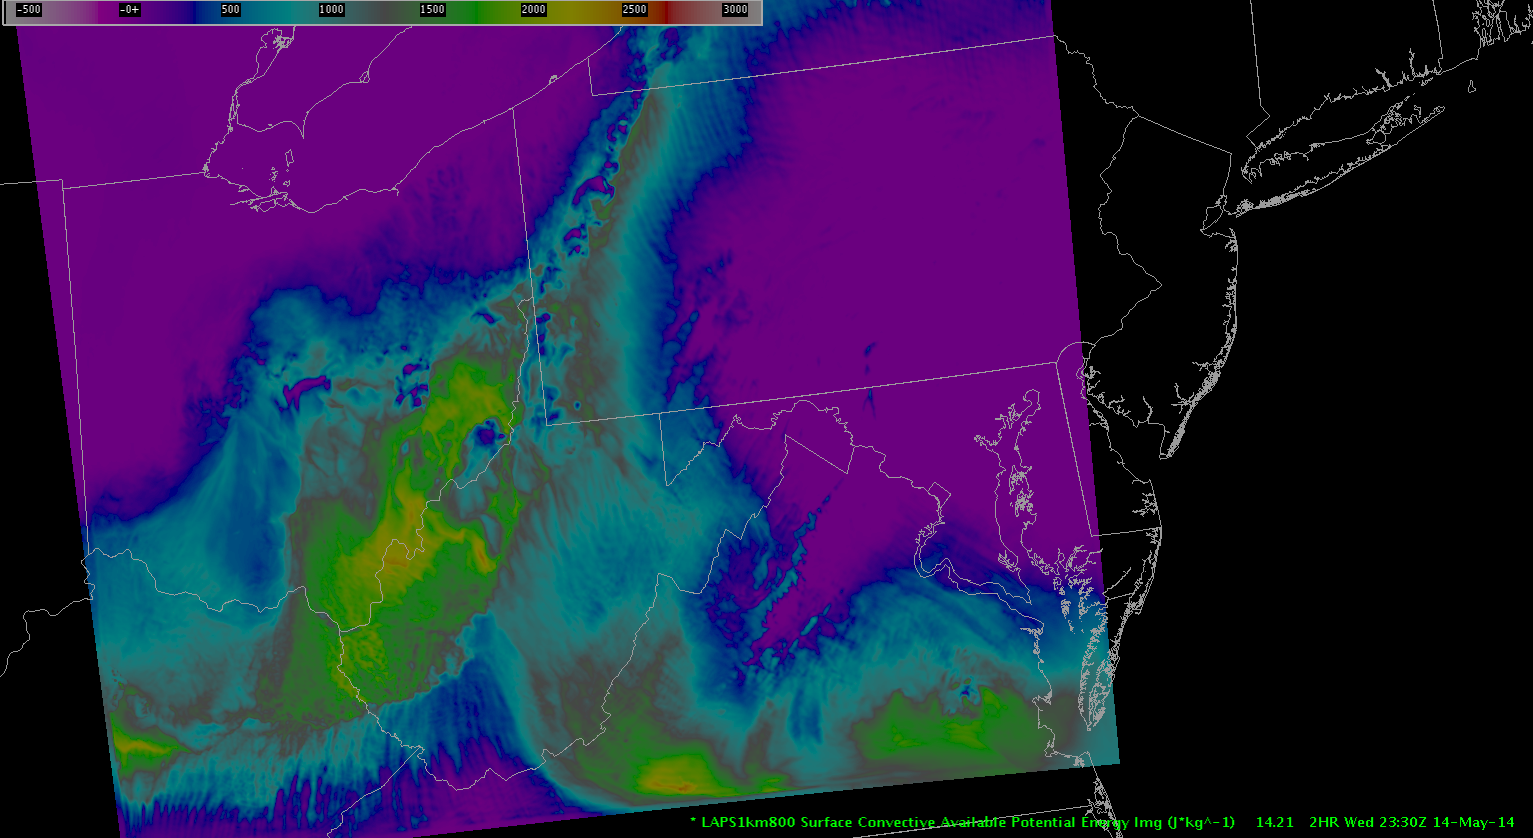 The model output seems to produce a sort of streamline look, heading toward the center of this line. It sort of looks like a convergence zone. This is precisely the area that manifested as a line of severe thunderstorms. The first SVR for this line was issued at 22:54Z. This is what the radar looked like at about 23:30Z.
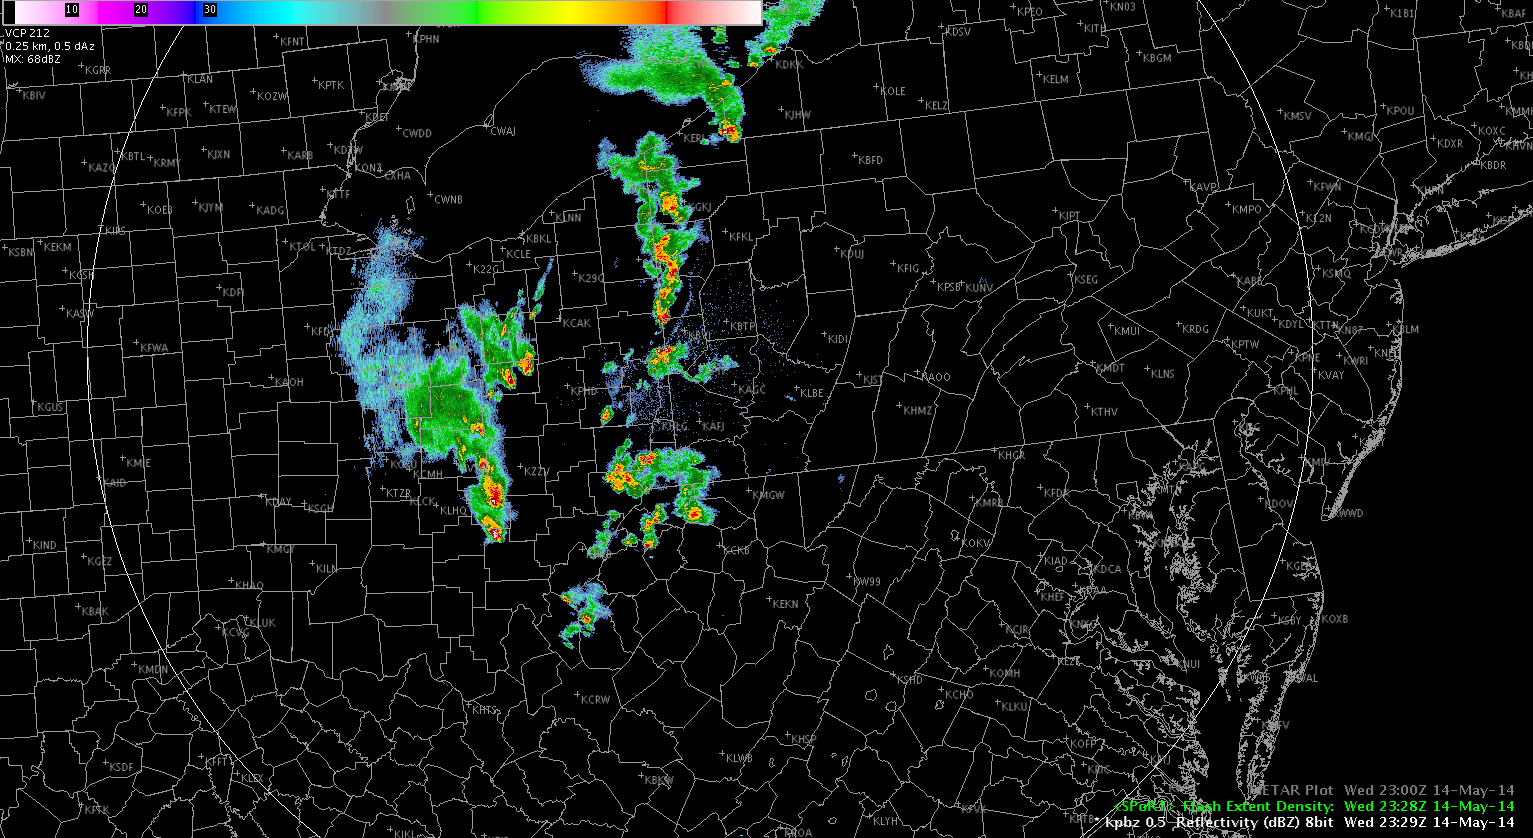 A whole bunch of convective cells, but oftentimes, you’ll get a line like this and it won’t turn severe. So it’s helpful to have guidance in the short term so see if these storms have true severe potential.
I also want to point out the storm cells along the PA/WV border, which had spawned severe warnings at the same time as the line to the north. The LAPS was showing high CAPE values (above 2000) in the vicinity of the developing cells, but the values were also high back behind the storm. So, the spatial coverage of the high CAPE values was too large to determine exactly where a strong thunderstorm would develop. But, you could see it on the super rapid scan GOES IR imagery:
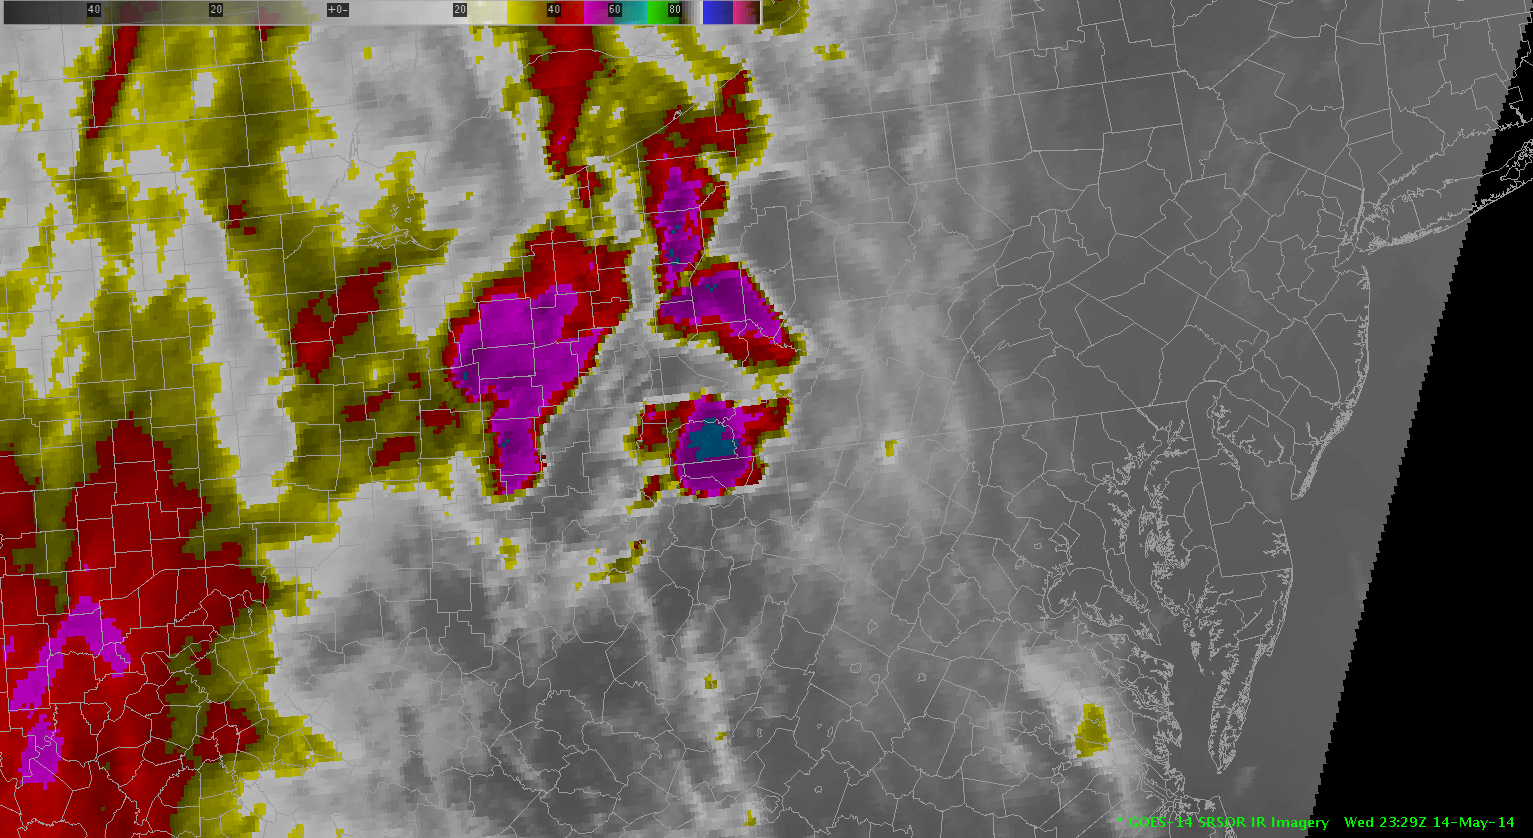 The southern cell had a SVR issued about 10 minutes prior to the SVR for the northern line of storms. I noticed in later images of GOES IR (which I failed to capture… sorry) that the cloud tops had cooled significantly in the northern cell and a broad area of -60C cloud tops had developed.
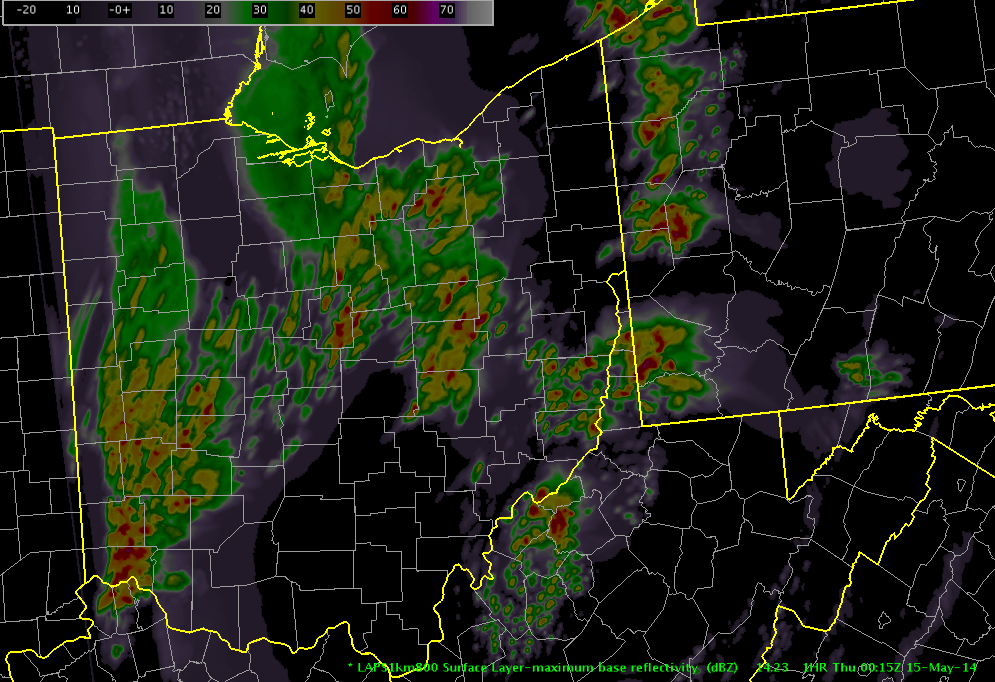
VLAPS Simulated Reflectivity – Good Performance
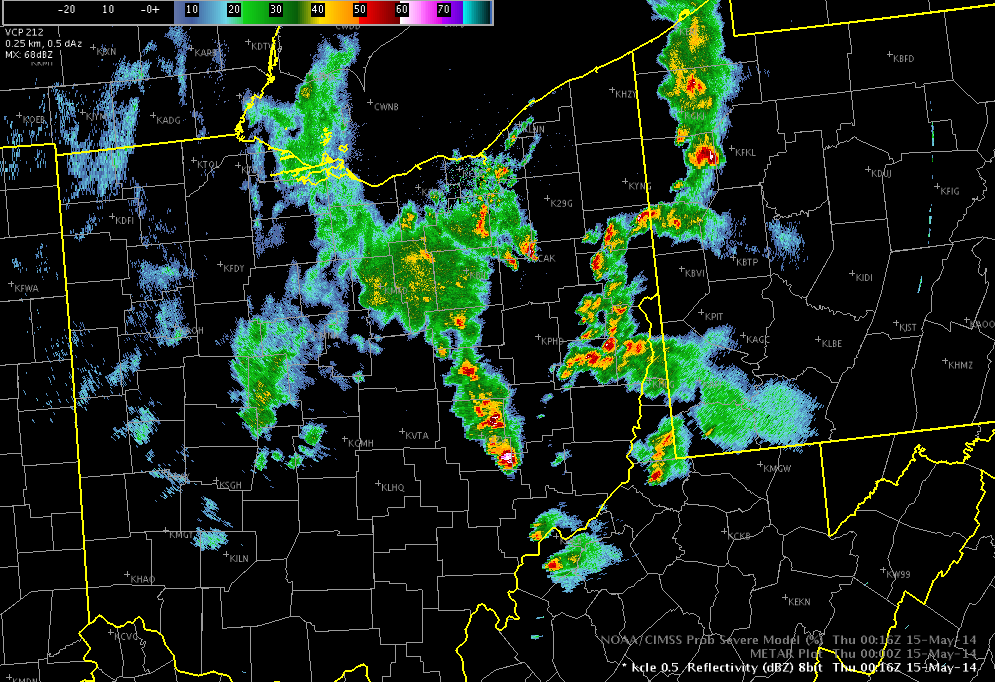
The vLAPS 1 hr Simulated Reflectivity image is the top image from a run at 23 UTC, valid at 0015 UTC (75 min later), did a fairly good job representing actual base reflectivity from KCLE at 0016 UTC in the image below. The simulated reflectivity seemed to perform best in western Pennsylvania and West Virginia. The reflectivity may have been overdone in western Ohio.
CI Tool – Use of CI tool at night
After diagnosing the CI tool once it switches to the coarser resolution using IR, I just don’t think it’s usable. It’s way too noisy and very inconsistent, almost unusable in my opinion. I love this tool during the day, but I honestly just don’t think it’s worth the data crunching to run at night.
– Deitsch
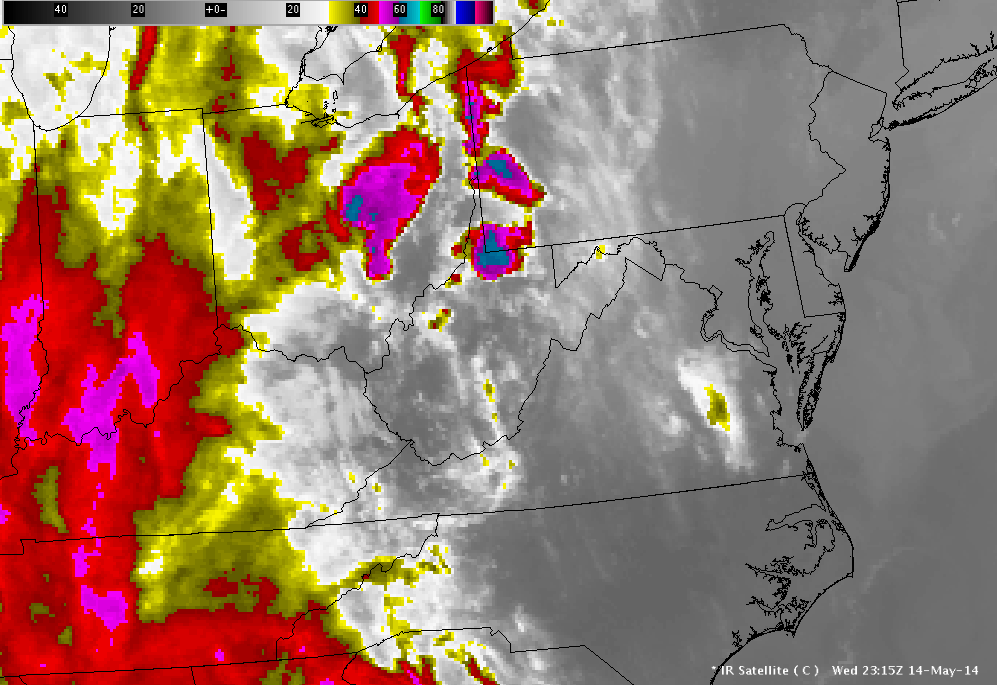
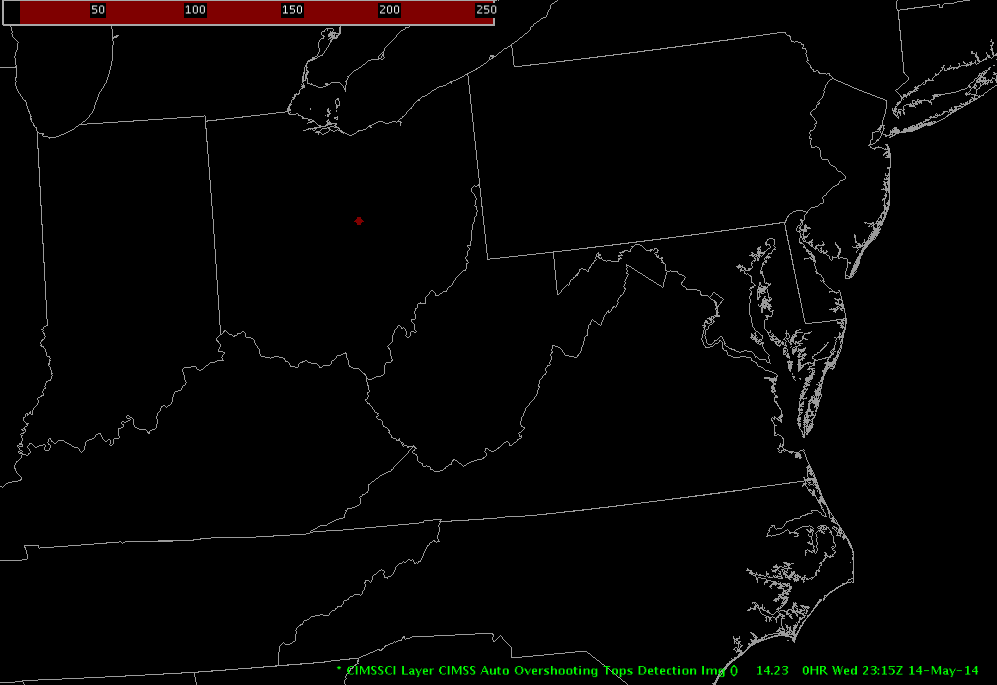
Overshooting Top Detection Continues to Underestimate Overshooting Tops
The GOES-R Overshooting Top Detection (OTD) product continues to underestimate the number of overshooting tops. In the top image at 2315 UTC, there are several cold cloud tops around -60C with several severe storms in Ohio, western Pennsylvania, and West Virginia. The OTD product only detected one overshooting top over Ohio at this time.
The OTD product seems to be underestimating the number of overshooting tops today on May 14.
 Michael Scotten
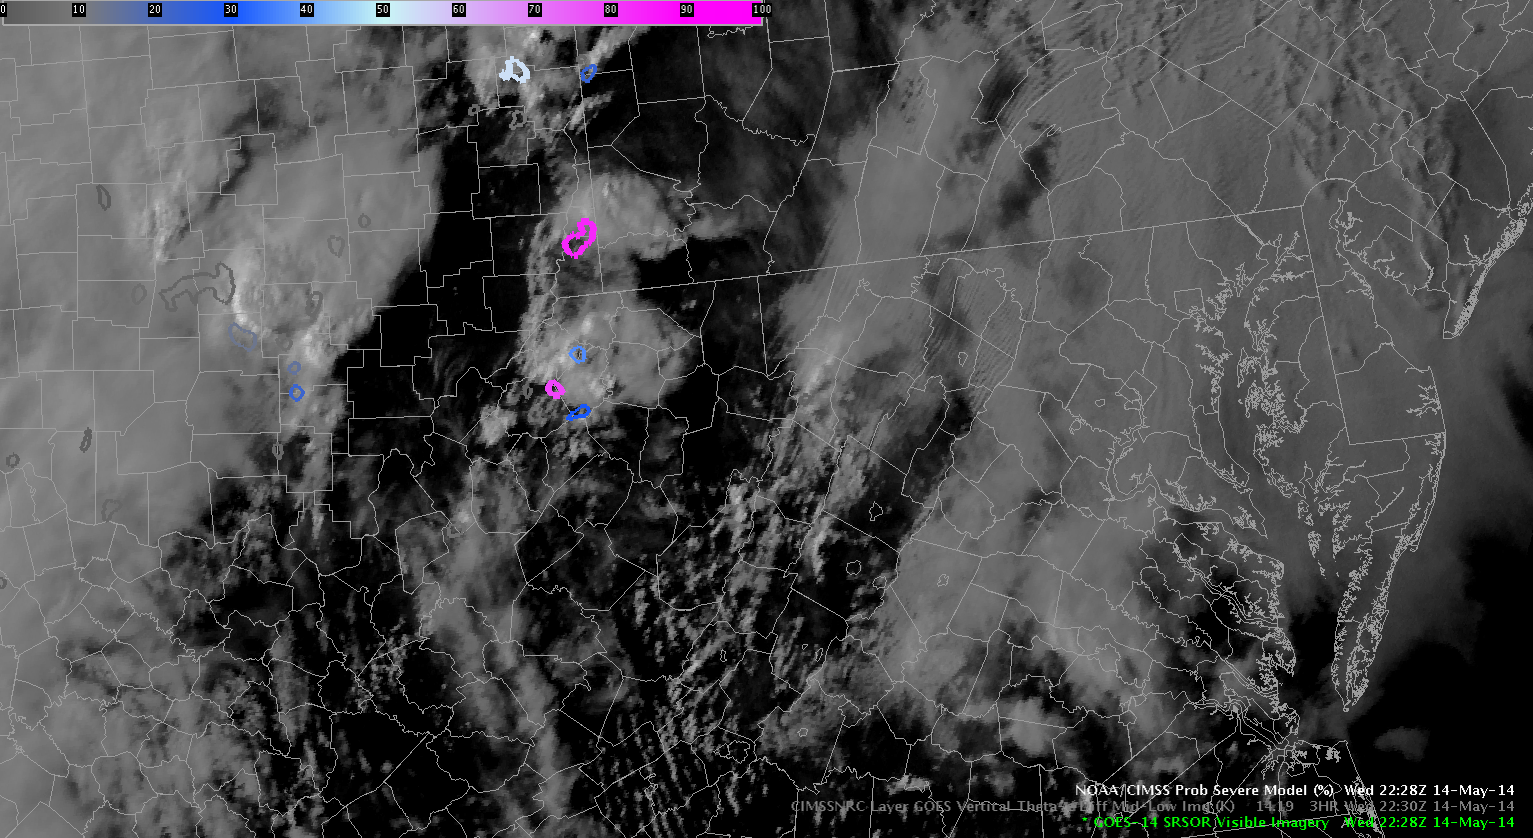
ProbSevere got a jump on a SVR in PBZ area
The ProbSevere model was useful in spotting a convective cell that popped up in the Pittsburgh area late in the afternoon. The rapid scan GOES imagery, overlaid with ProbSevere, shows a few cells worth keeping an eye on. The northernmost shapefile in pink was in an area that I otherwise would have ignored, because I didn’t see any visual cues in the visible imagery that indicated convection in the immediate area of the pink outline.
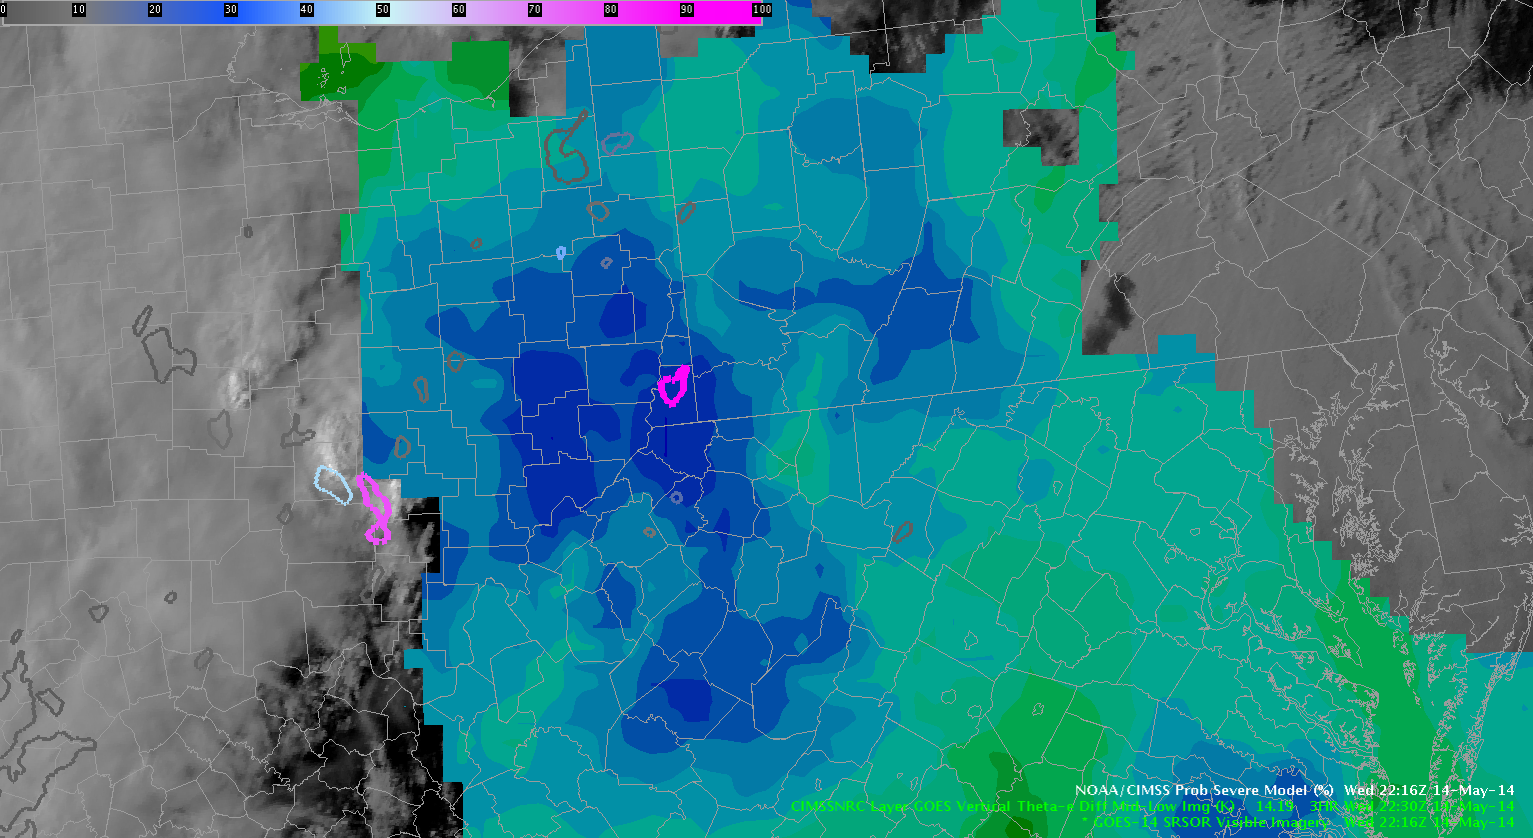
 At the time when I was looking at this cell, I also had the Theta-e differential overlaid, to see if that was pointing out any unique features. I dialed down the opacity of the color table so it wouldn’t interfere too strongly with the high-res sat data. For the picture below, I pushed the opacity back up to clearly show the colors. As you can see, there is a relative maximum over the ProbSevere shapefile of about -9.0K, but without the ProbSevere shapefile, this area wouldn’t have caught my attention, since there are other areas with that same intensity, and the values weren’t too impressive, either. That said, the -9K blob on the right was in an area with developing Cu, whereas the blob on the left didn’t have Cu development yet. So I guess in retrospect, I could have taken notice to the area with relatively high Theta-e difference in conjunction with the developing clouds. I do feel like the ProbSevere gave a jump on any visual confirmation I might have made on changing cloud structure, because like I said before, the clouds did not look that impressive to me.
 The vertical PW difference wasn’t showing any impressive values, either, but something that’s worth noting is the gradient that formed right in the warned area. As we know, gradients are conducive to volatility, and the storm’s path actually tracked right along this gradient, moving due north. The image below is valid at 22:00Z. A warning was issued in the circled area at 22:27Z.
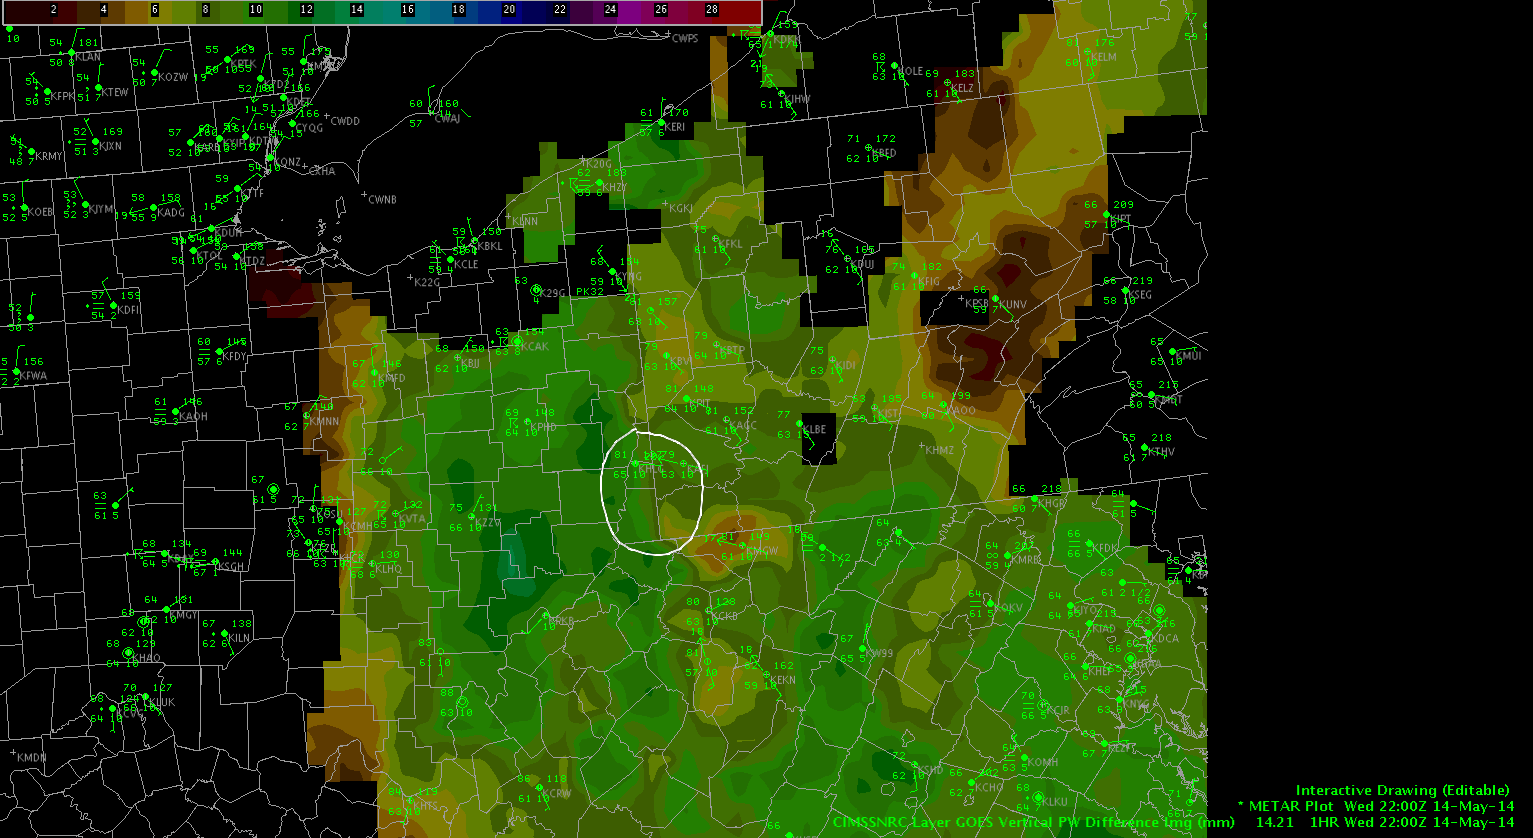 This cell had been warned earlier in the afternoon, and redeveloped. The ProbSevere model might prove to be very useful for tracking storm cells, not just before they become severe. It could also be useful after a storm loses its severe characteristics by tracking its redevelopment potential.This could be very useful for a forecaster to help them sift through the clutter, especially in events with lots of pop-up cells and in linear MCS events.
ProbSevere Model verified with 3BSS
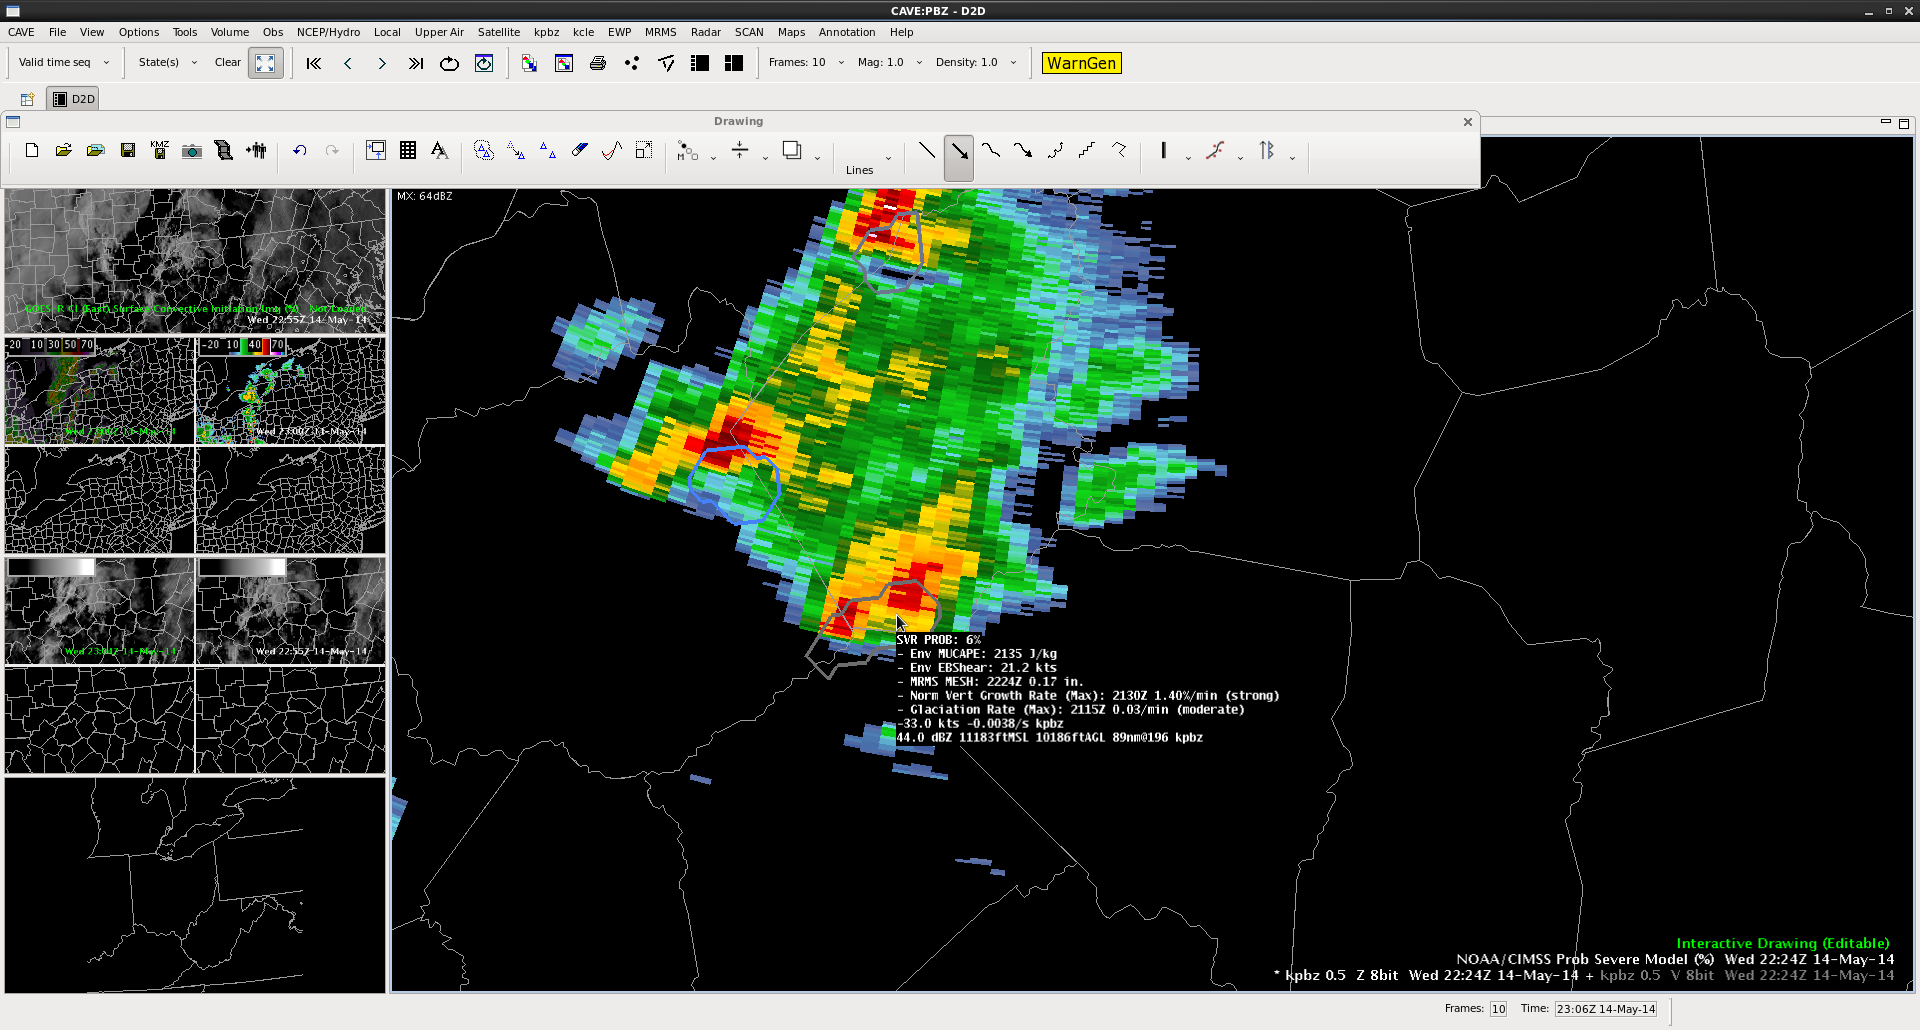
The following three images follow a cell northward across north-central WV using the ProbSevere Model overlaid on KPIT 0.5 degree radar reflectivity. The first image below is from 2224z where the sampling box shows the ProbSevere model with a 6% probability of a severe storm. The Multi-Radar Multi-Sensor MESH size was 0.17 inch within an environment of 2135 J/kg MUCAPE and 21.2kts EBShear. There was strong vertical cloud growth rate and a moderate glaciation rate calculated from satellite imagery.
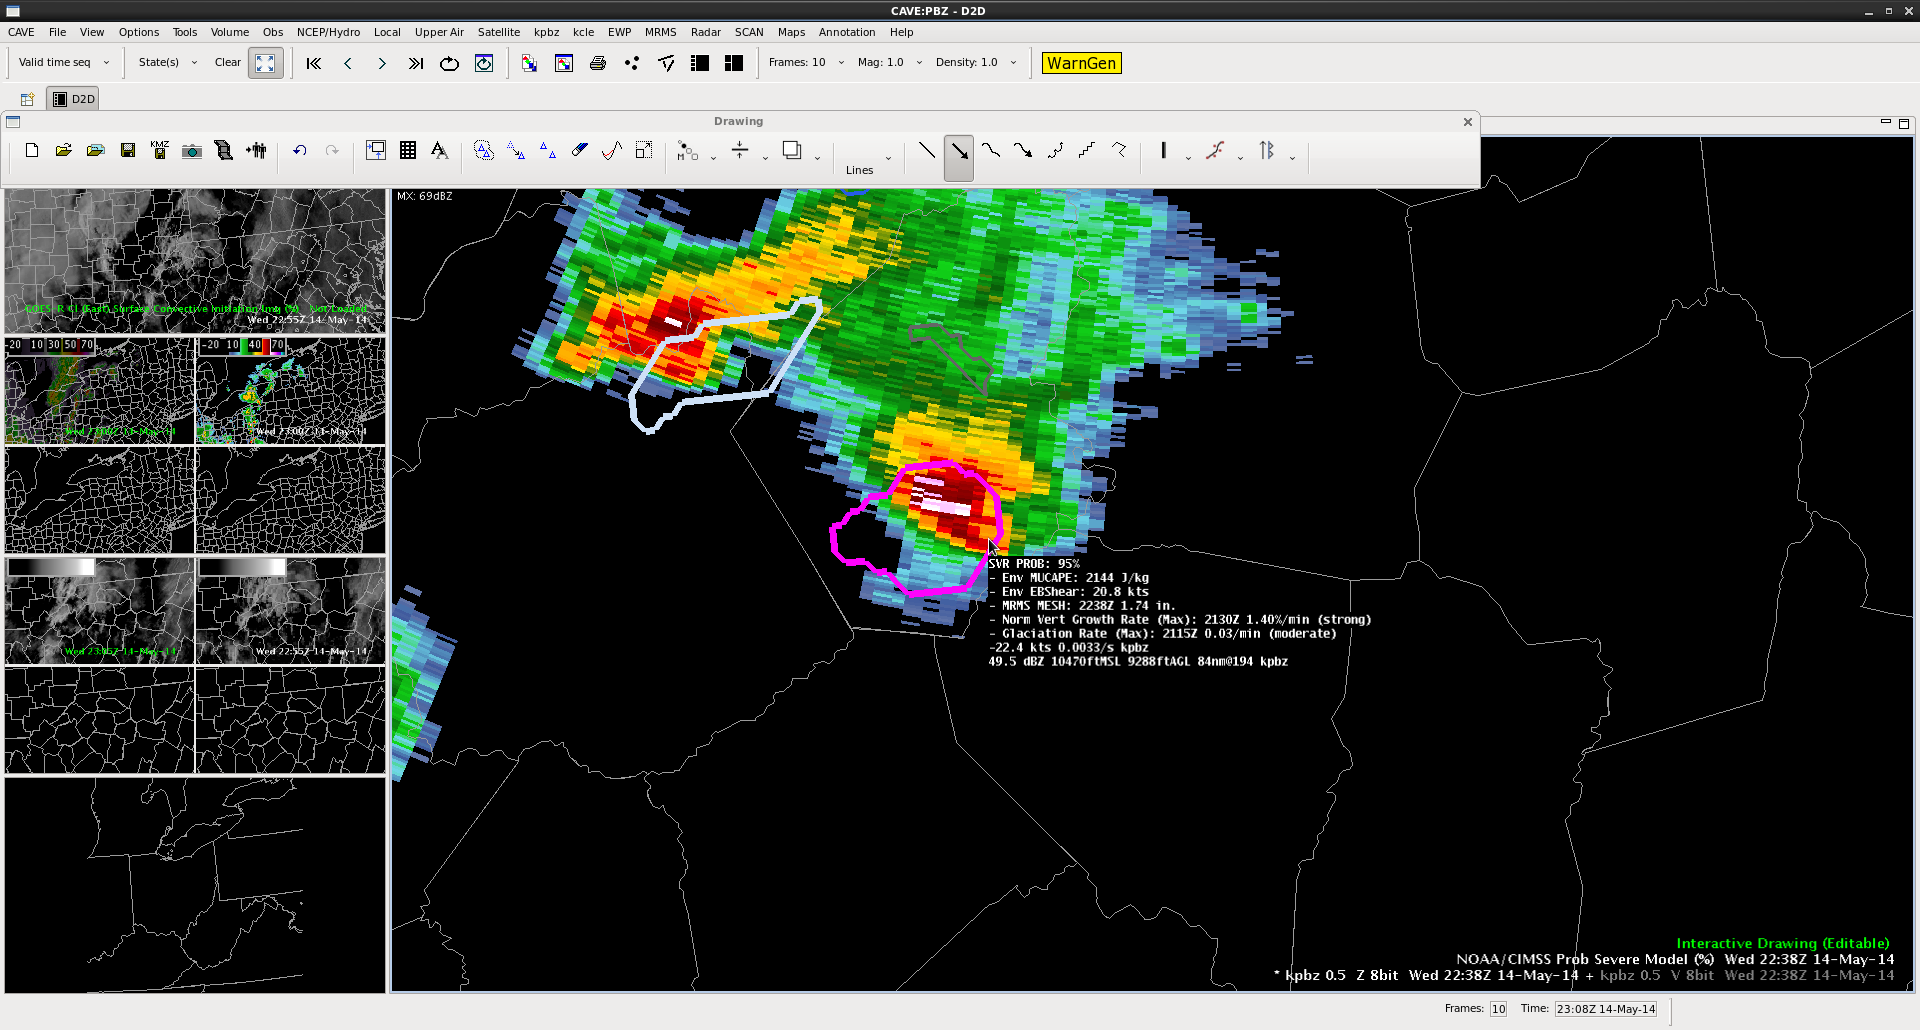
 14 minutes later at 22:38z the ProbSevere Model severe probs jumped to 95% with the only change in the predictors being an increase in MRMS MESH to 1.74inch.
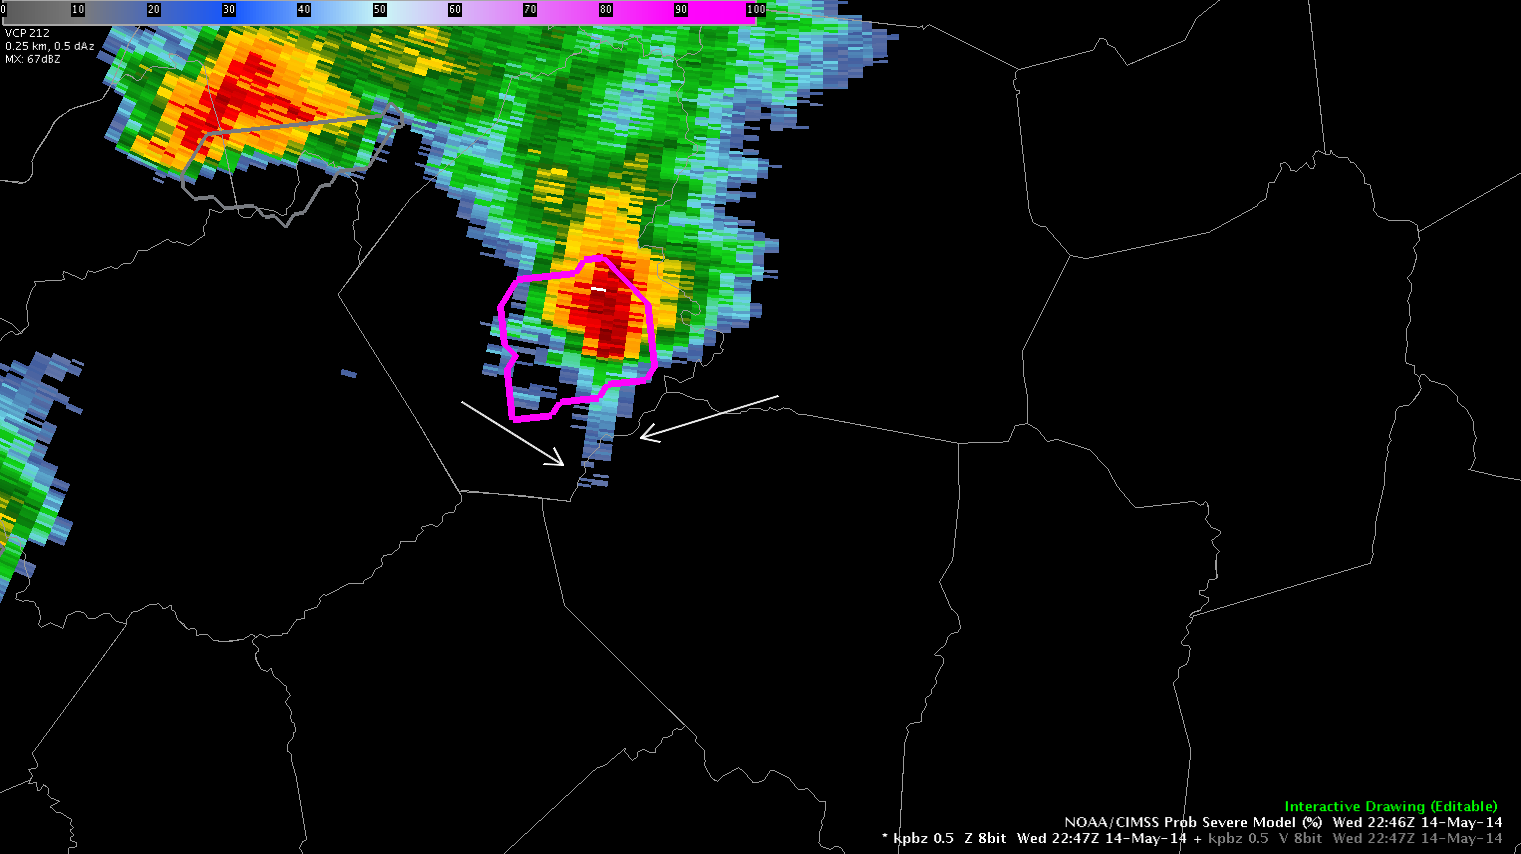
 9 minutes later at 2247z a three-body scatter signature (between the annotated arrows) shows up on the KPIT radar to the south of the storm core. At 2254z golf ball sized hail was reported in Salem, WV.
 Shawn Smith
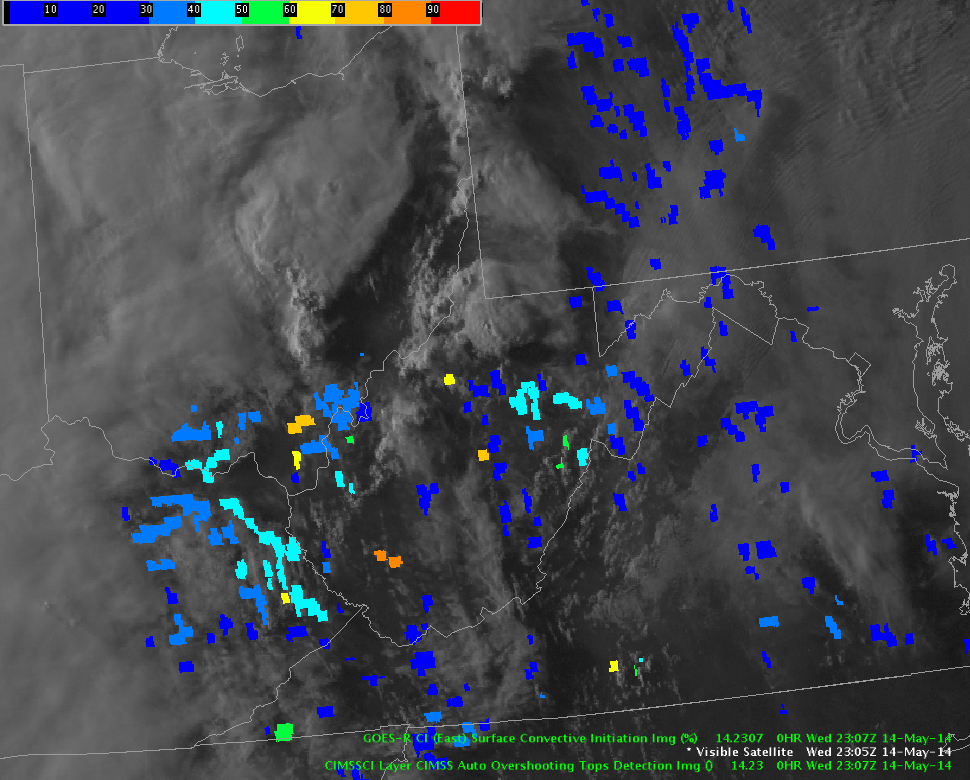
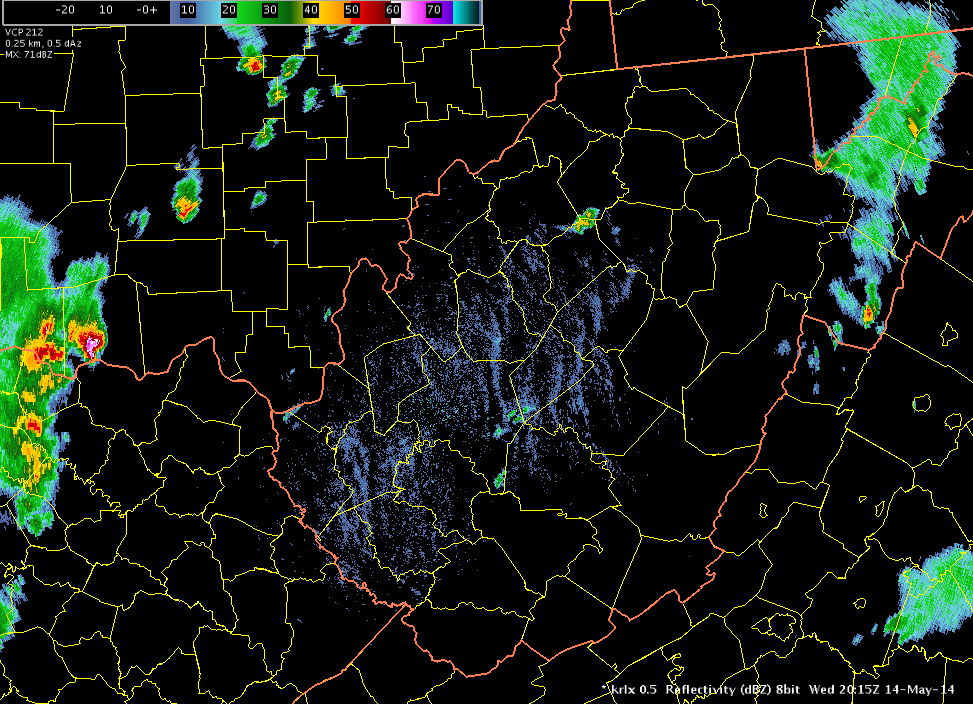
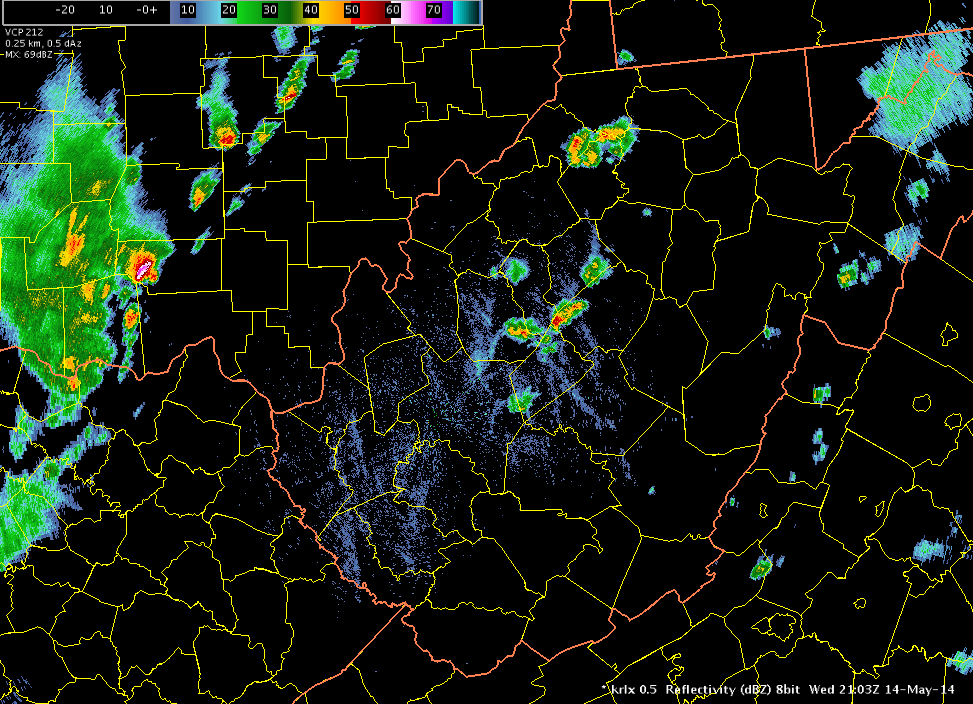
GOES-R Convection Initiation Nails Developing Storms in Wonderful West Virginia
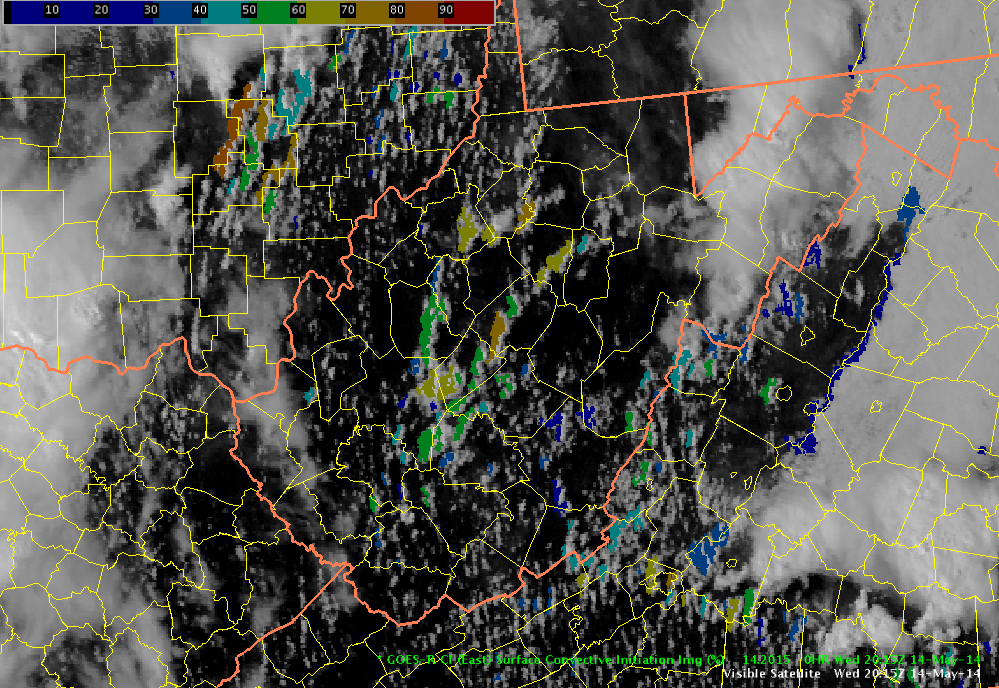
The GOES-R Convection Initiation product handled developing convection in West Virginia with 15-45 minutes of lead time on May 14. The top image displayed visible imagery with CI values along a few bands of enhanced cumulus with values 51-84% highlighted in the green, yellow, and orange areas at 2015 UTC in the middle part of West Virginia. The second image with RLX reflectivity depicted very little to no convection at 2015 UTC. The last image depicted RLX reflectivity at 21 UTC with isolated to scattered storm development where CI values were 51-84% about 45 minutes earlier.
This product continues to perform very well. CI values greater than 50% have been shown to indicate developing convection with high confidence.
 Michael Scotten