HWT Wed 4 June blog 4 – Synthetic Sat (NSSL WRF) Evaluation

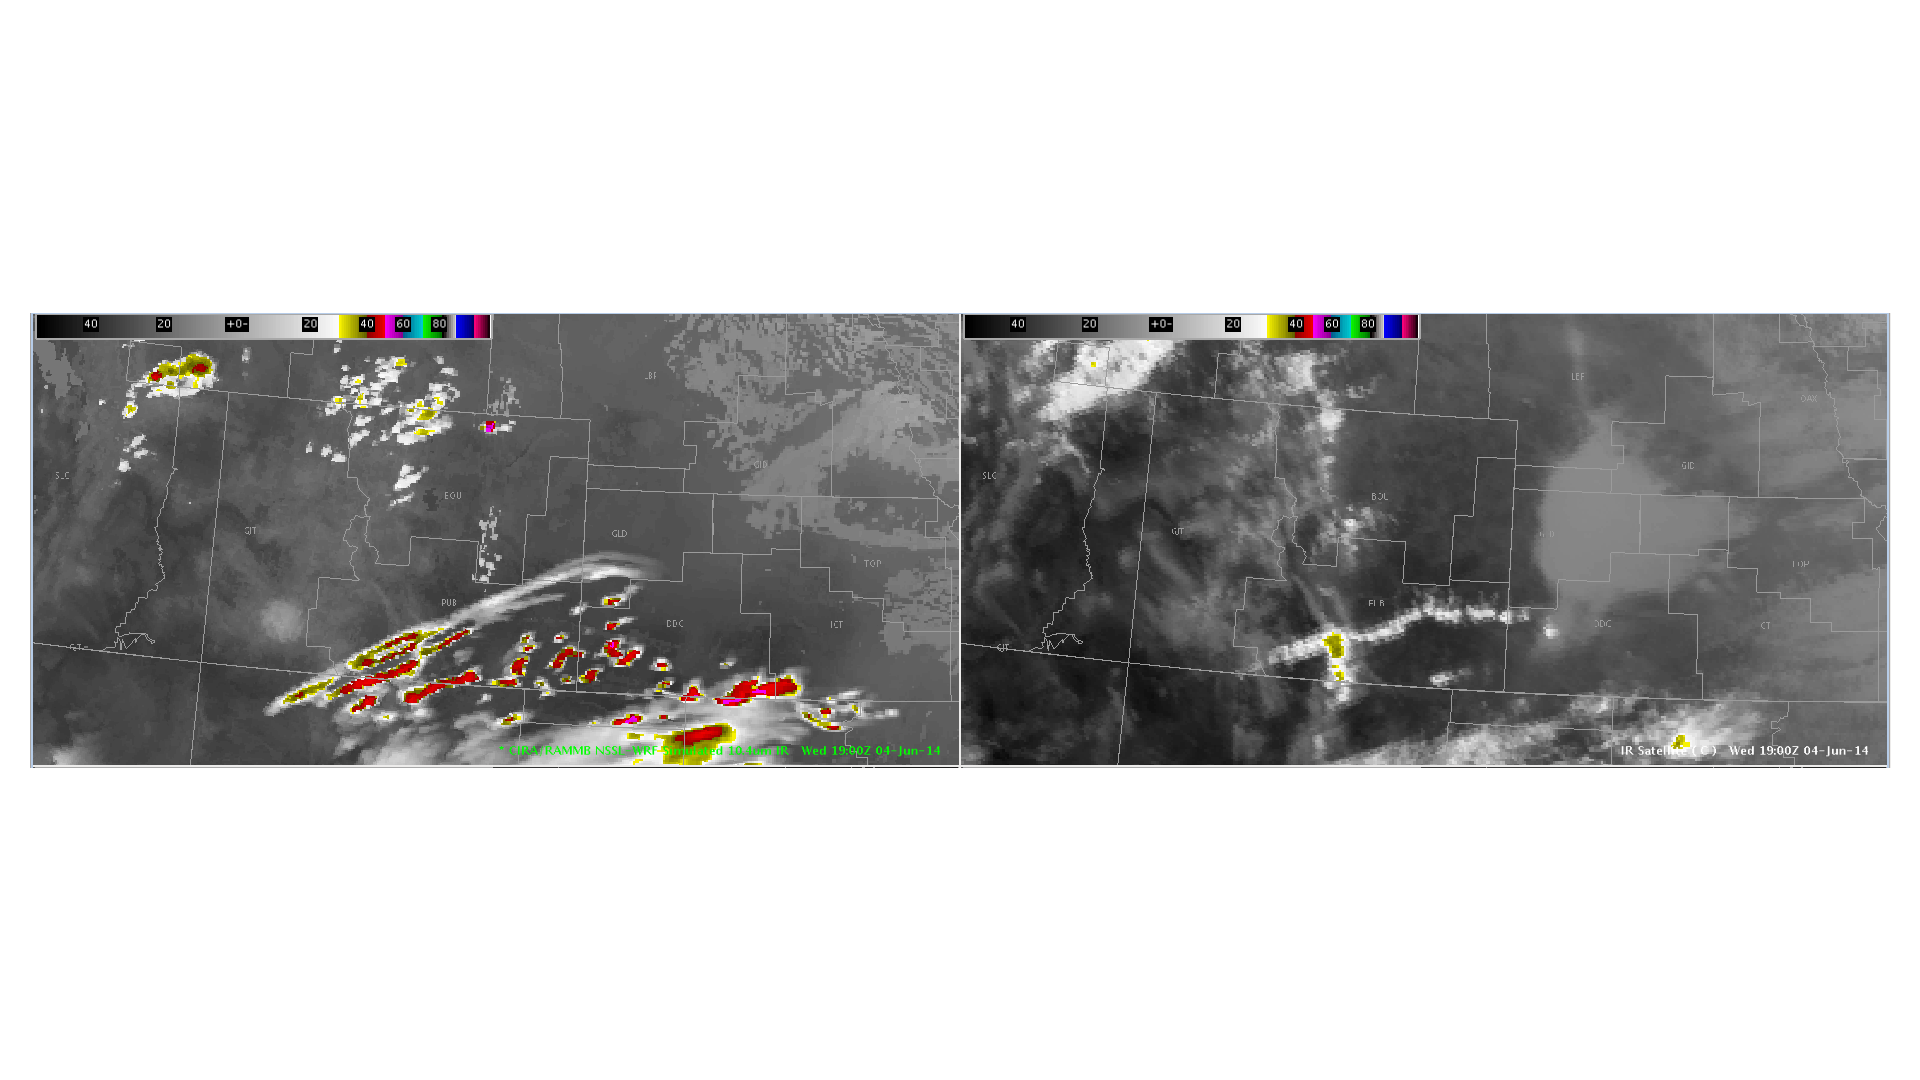
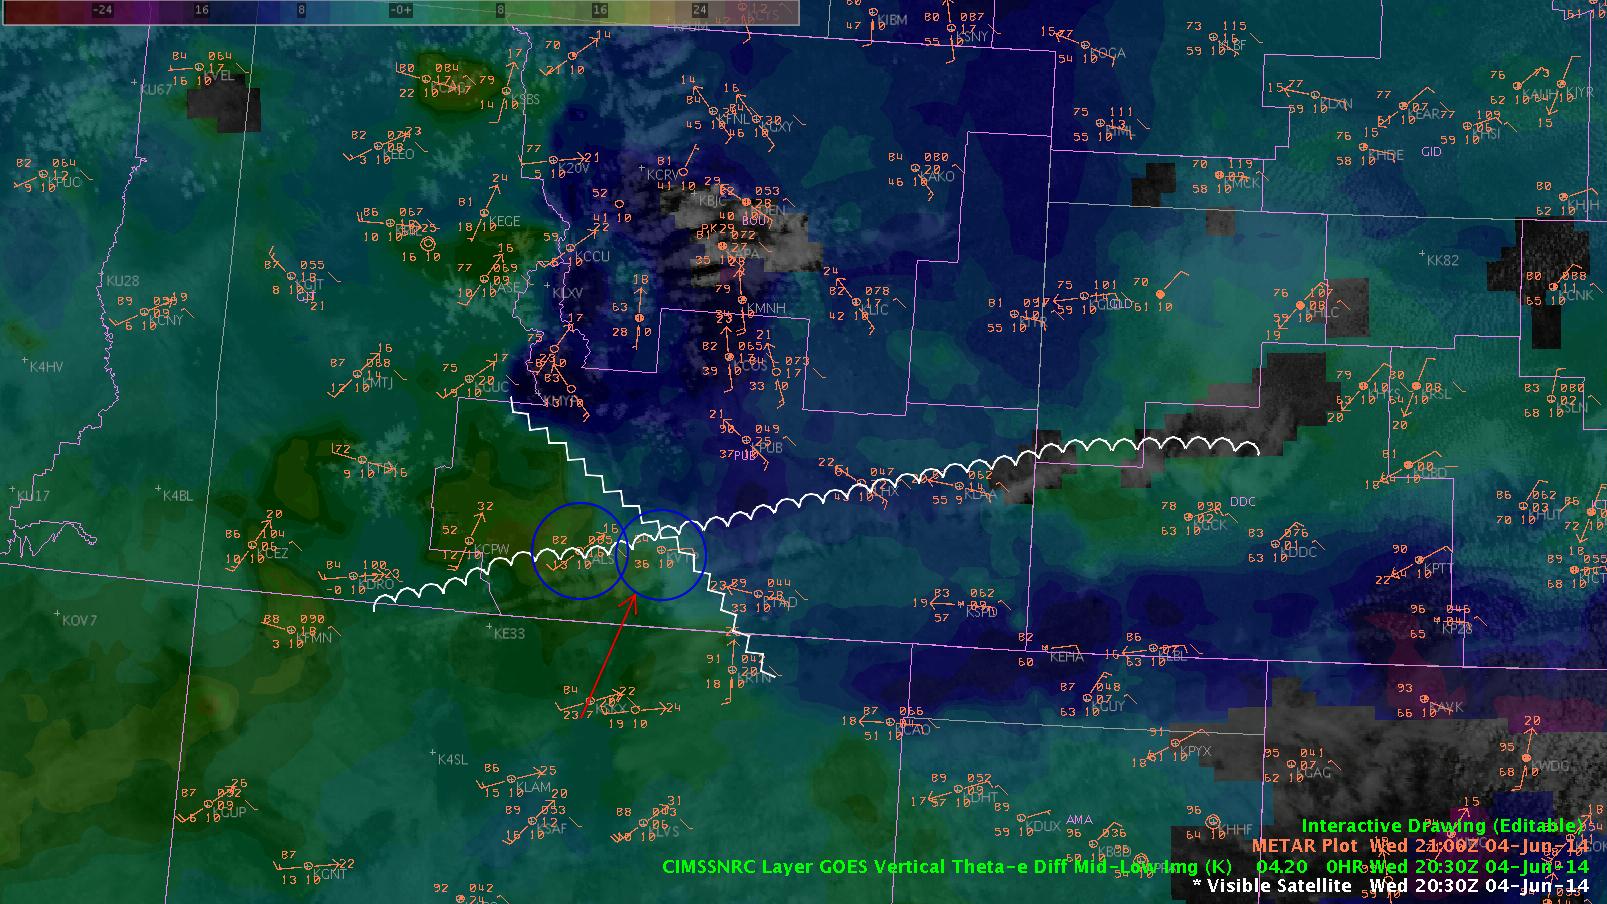
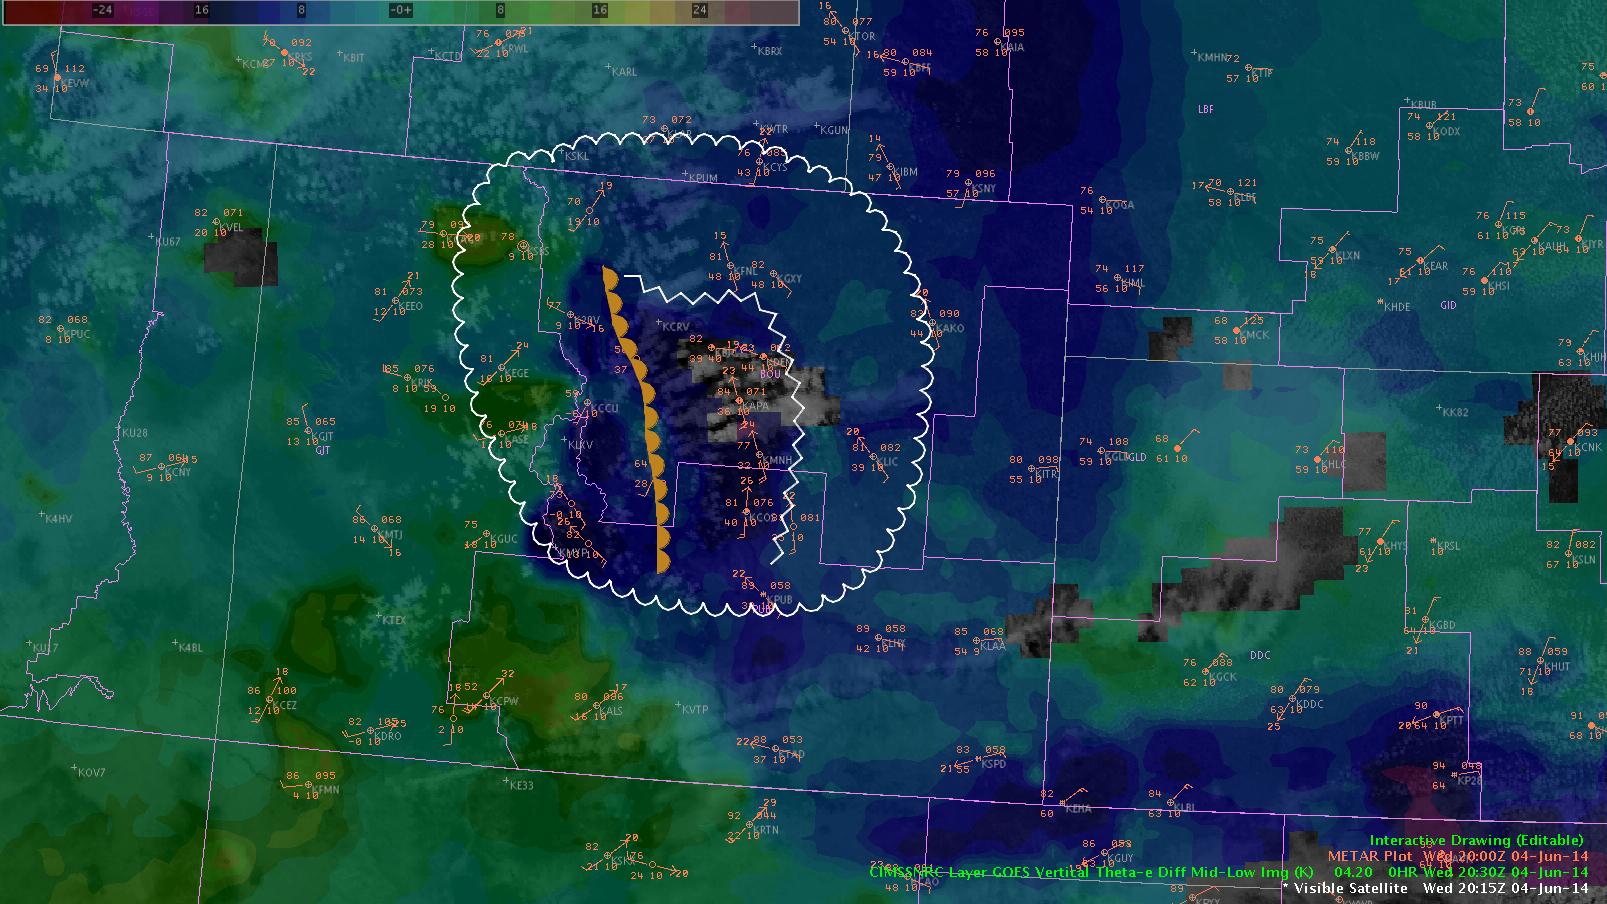
Evaluating the NSSL WRF sim sate with IR window and Radar over Colorado. While NSSL WRF is as usual overly robust, the model did show a cloud boundary over SE Colorado that is very present in GOES IR. This boundary is transverse to a theta E diff Boundary and up-slope flow. We expected some convection here (out of our CWA today) and there is some development along the NM/CO border. The NSSL WRF also shows the convection (albeit weak) east of KPUB that we are monitoring. I continue to believe the synthetic NSSL WRF imagery to be very valuable in not only evaluating model performance but as an important tool in locating areas of concern.
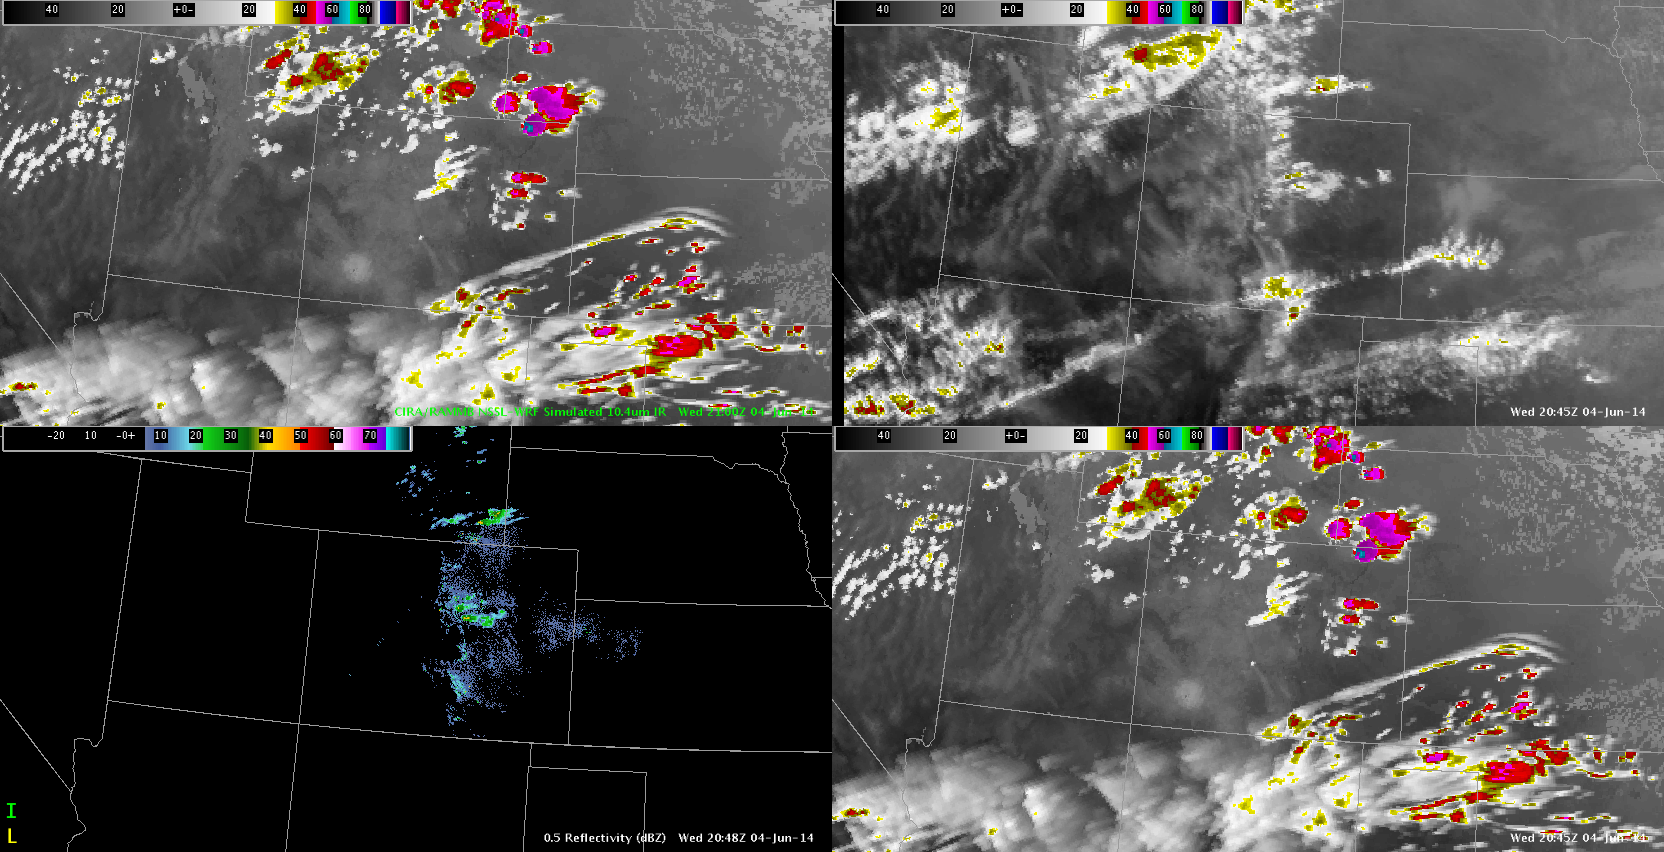
NSSL WRF SIM SATD Satterfield
KP

Tags: None

X marks the spot!

060414_2030Z_XmarksTheSpotWe are seeing convection firing near the intersection of two boundaries (pointed to by the red arrow)…the gradient in theta-e difference from the nearcast product, and a west-east oriented line of cumulus shown in the visible satellite imagery. The METARs, circled in blue, show convergence of dry downslope winds and relatively moist upslope flow in that same area where the boundaries intersect. If the simulated IR imagery for later this evening is any indication, this line of cu will slowly slip south and east…with strong convection firing in its vicinity east of the CWA later this evening.

-KP

-D. Satterfield

Tags: None

CI consistency

CIwedThere has been persistent CI values near 60% in the highlighted area over the past hour or more. There has been an increase in radar echoes during this time, but the updrafts has been slow to grow.

jca

Tags: None

Showers going up in a favored area

060414_20Z_convectionInFavoredAreaThis image shows the convection trying to get going in an area along a dewpoint gradient, denoted by the dryline symbol, and in the vicinity of the nearcast gradient in theta-e difference. This is the area we were focusing on based on both the nearcast forecast and the simulated IR imagery from earlier. Expect this to continue to be a favored area…with a potential shift eastward throughout the afternoon.

-KP

-D. Satterfield

Tags: None

HWT Wed 4 June blog 3 (Lightning Evaluation)

Lightning Flash Extent and Lightning Jump

Saved two AWIPS screens. The first shows the first Flash Extent that we saw today, out of our CWA in SE WY. Next scan shows the Light Jump Algorithm is now tracking it. Hope to spend a lot of time evaluating these two products today.

Lighning Jump
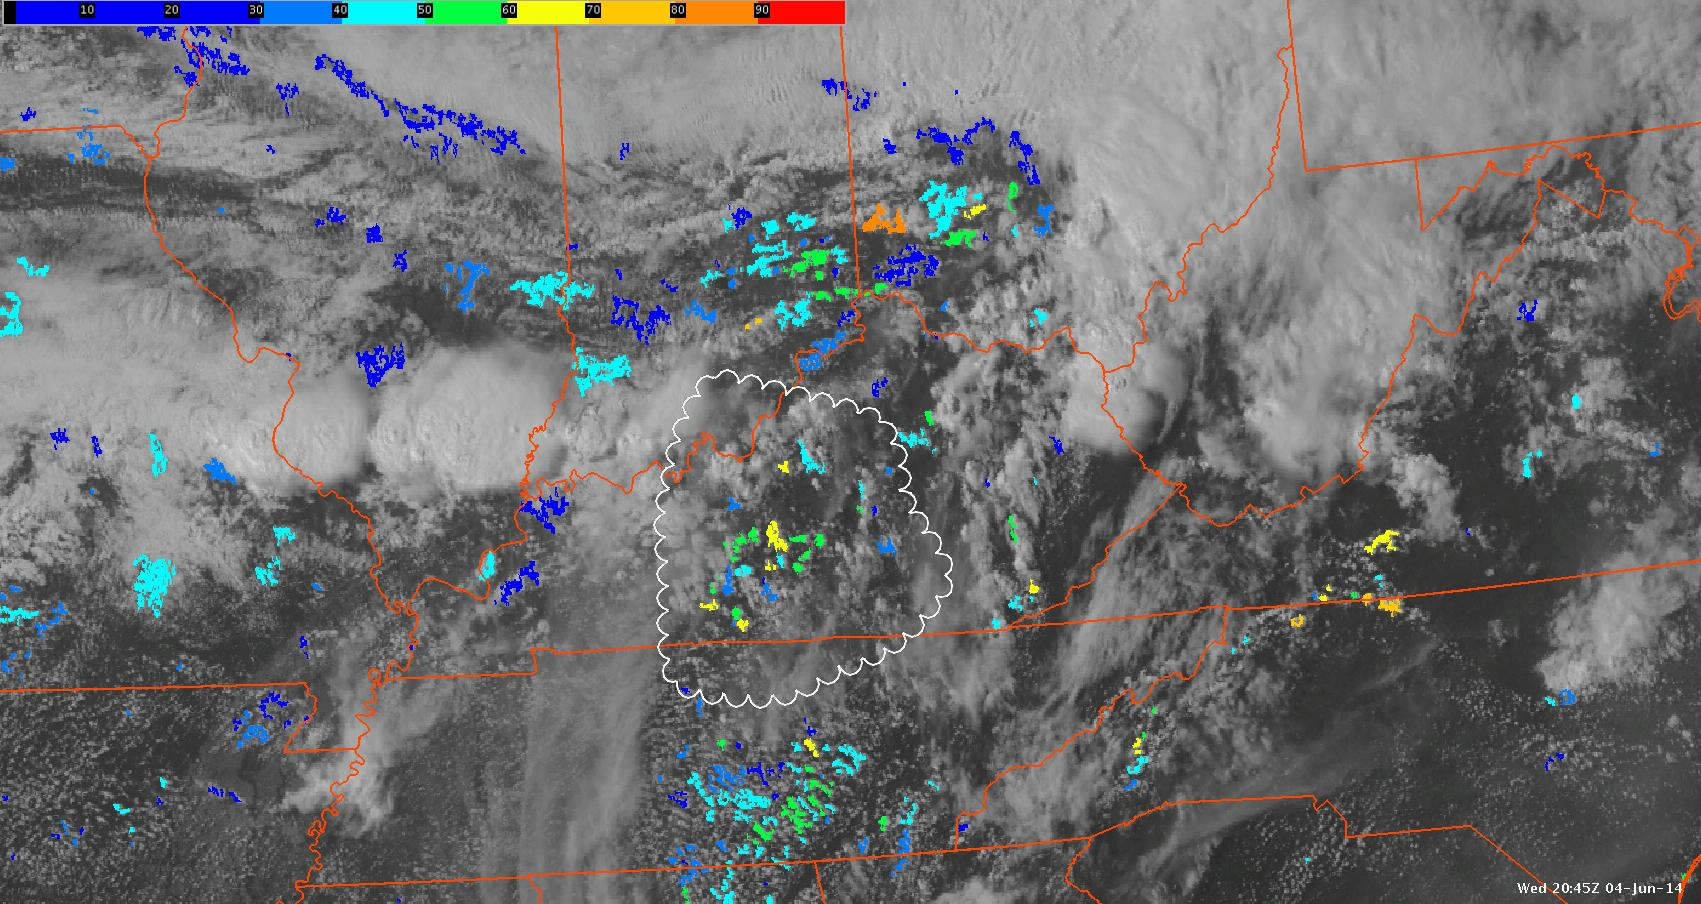
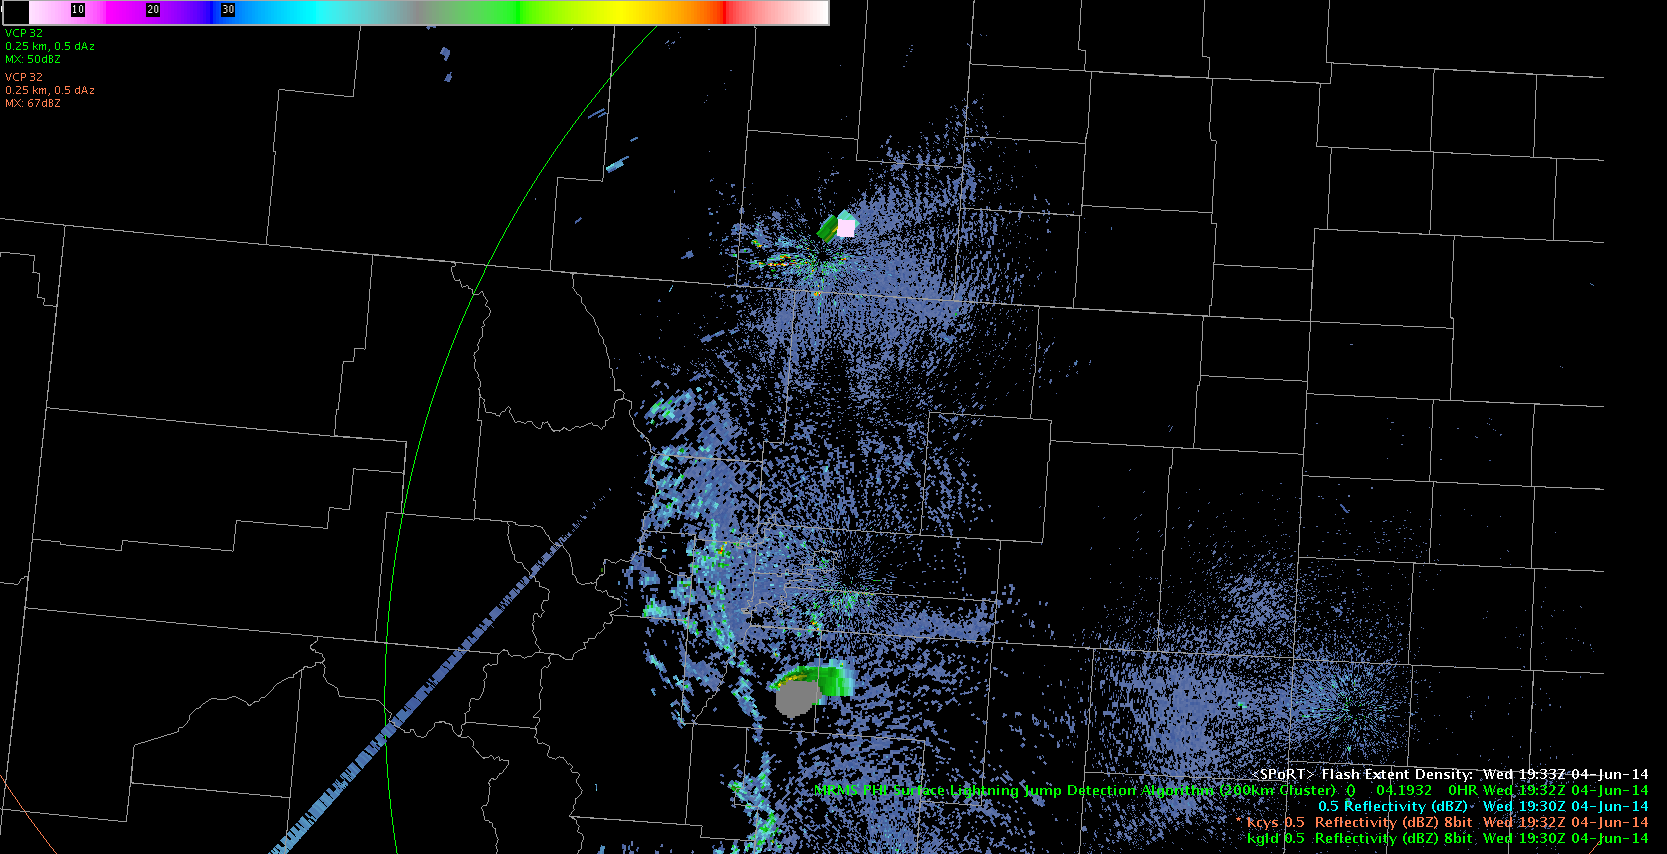
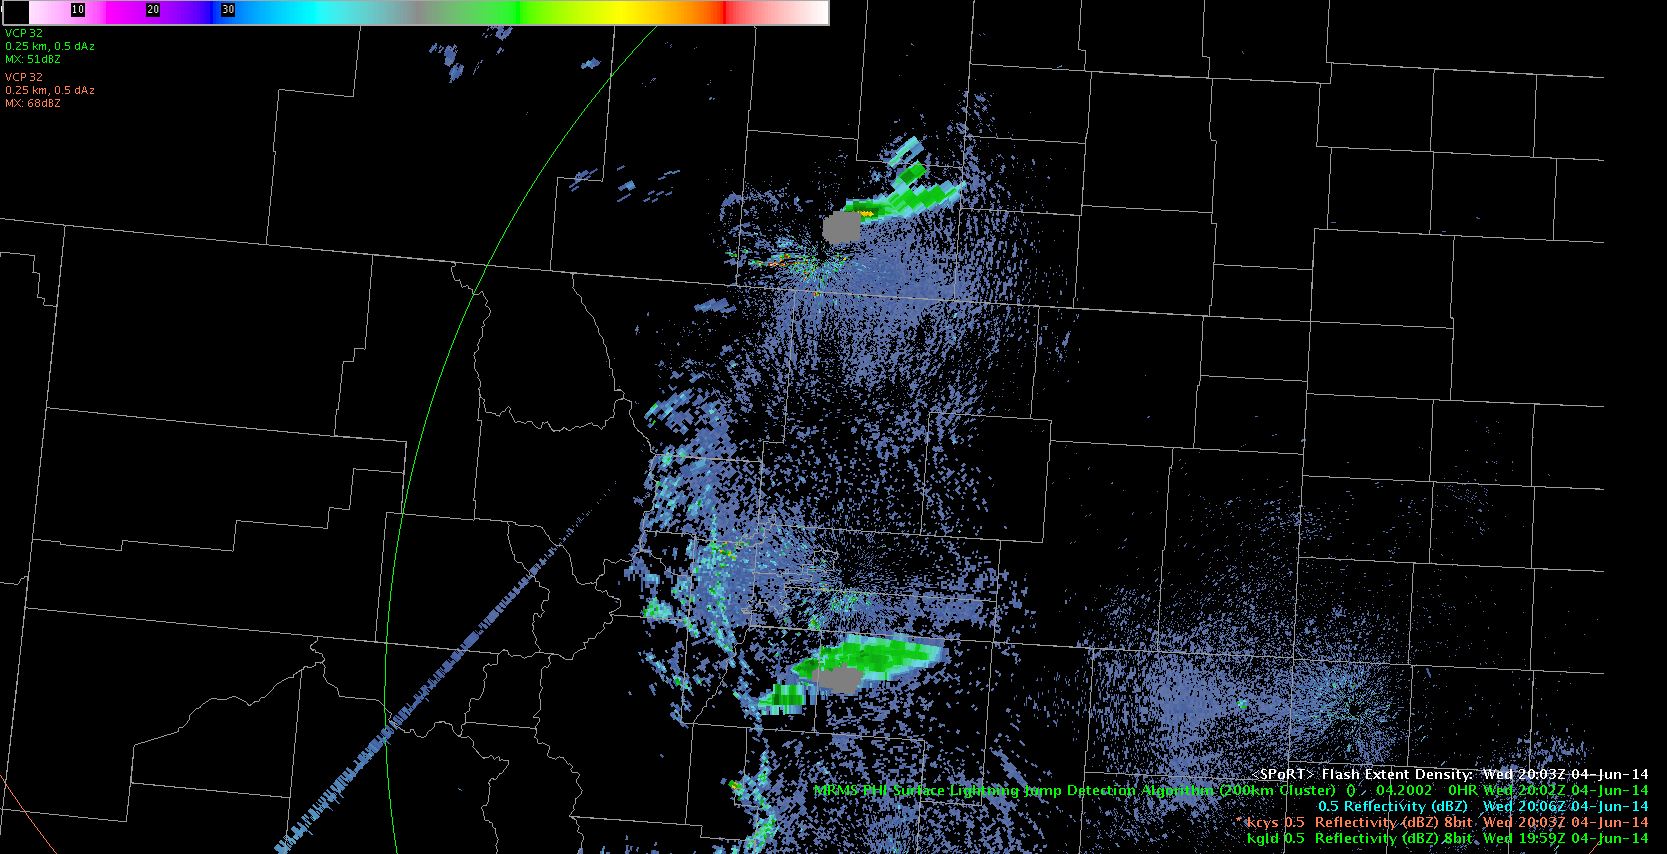
screen below is the earliest showing flash extent. Screen above is one scan later. with Light jump algorithm indicating tracking.

D Satterfield

KPLightning1

Tags: None

Increasing confidence for storms over eastern portions of the CWA


060414_19Z_IRcompare_cropped 060414_02Z_IR_warnOnFcstPotential_croppedThe image at the top shows the comparison of the simulated IR imagery vs the actual IR satellite image. Based on the performance of the simulated imagery, I would expect the best chance for strong convection to occur in the area outlined in black, as shown in the second image. The second image is the forecast for 02Z Thursday, so as that time approaches, would be fairly excited for storms going up in that region.

-KP

-D. Satterfield

Tags: None

vLAPS analysis

vLAPSwedTaking a look at the vLAPS, you can see the instability gradient in the far northern part of LMK where the sfc obs show the best convergence. This is where we expect the majority most significant convection to fire. The simulated reflectivity is overdone and too far south anchored to the highest instability. So, the gradient of the instability is the best indicator in this case for the most aggressive convection.

jca

Tags: None

Spike in ProbSevere – ?? as to why?

There was a noticeable spike in ProbSevere in LMK – between 1938UTC (6%) and 1940UTC (66%) then back down to 7% at 1950UTC.  Satellite rates were n/a – and the KLVX radar was in near optimal sampling distance (50 nm) from the storm of interest.

So – we are unsure why the ProbSevere spiked?  This would be a good example to pose to the developers.  I attached the 1938 and 1940Z images below.

ProbsevereSpikeSpikeProbSevere2

Tags: None

HWT Wed 4 June blog 2

Theta difference and surface based cape analysis over central  and North CO. We can see a well defined theta e diff boundary and this is collocated with a SB Cape boundary as well. Some small convection is developing along these boundaries. LMA seeing some very low numbers of CG on cell near CYS,

Theta E diff continues to be valuable in locating boundaries where convection will develop. Better than even using SB Cape by itself. Over the last few days convection seems to develop near these theta e diff boundaries.


D Satterfield

KP

sbcp VIS 1930Z4June theta e CO1830

Tags: None

Convection firing along Theta-e diff boundary from the near cast

060414_1915Z_nearcast_compareObs1The red boundary drawn in the circle shows the area where convective initiation is taking place, which is co-located with a gradient in the theta-e difference off the nearcast. Also, as shown in the obs plot (bottom left pane) there is a sharp gradient in dewpoint across that boundary as well, ranging from around 10 degrees with downslope winds off the mountains, to 40-50 degrees and an upslope wind on the east side of the boundary. This appears to be a favorable area for convective development and will continue to monitor throughout the day.

-KP

Tags: None