Affect of a TBSS on the NMDA and NTDA

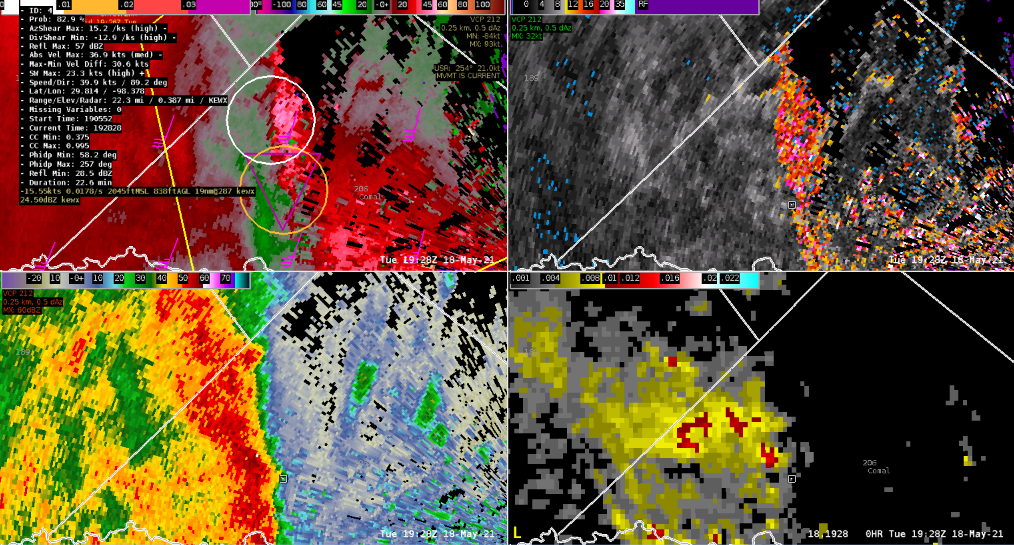
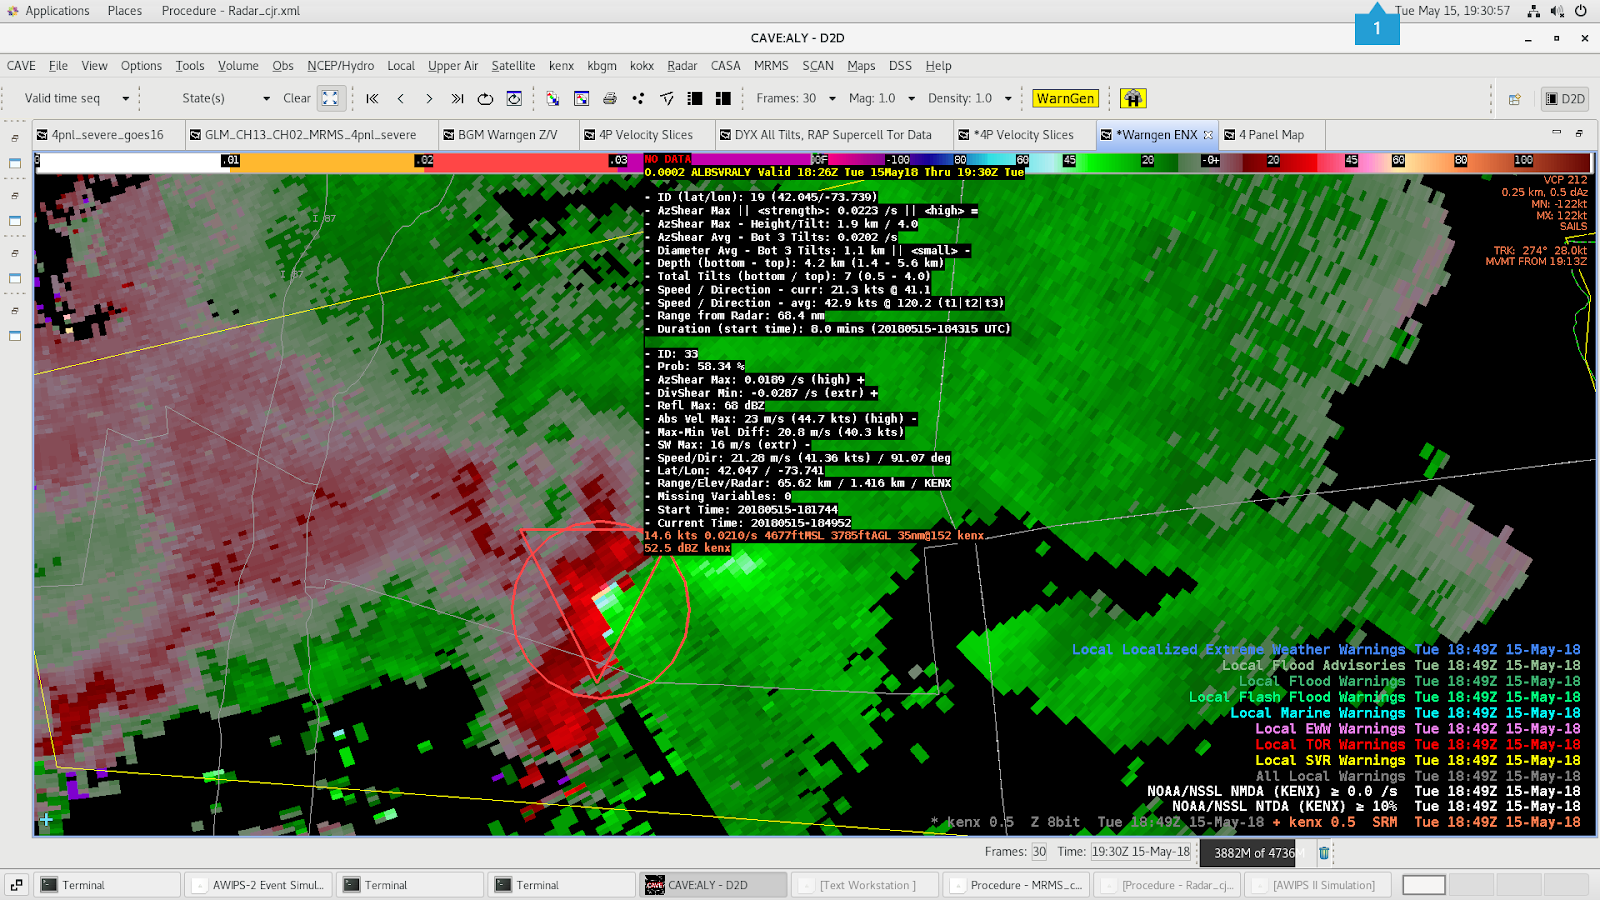
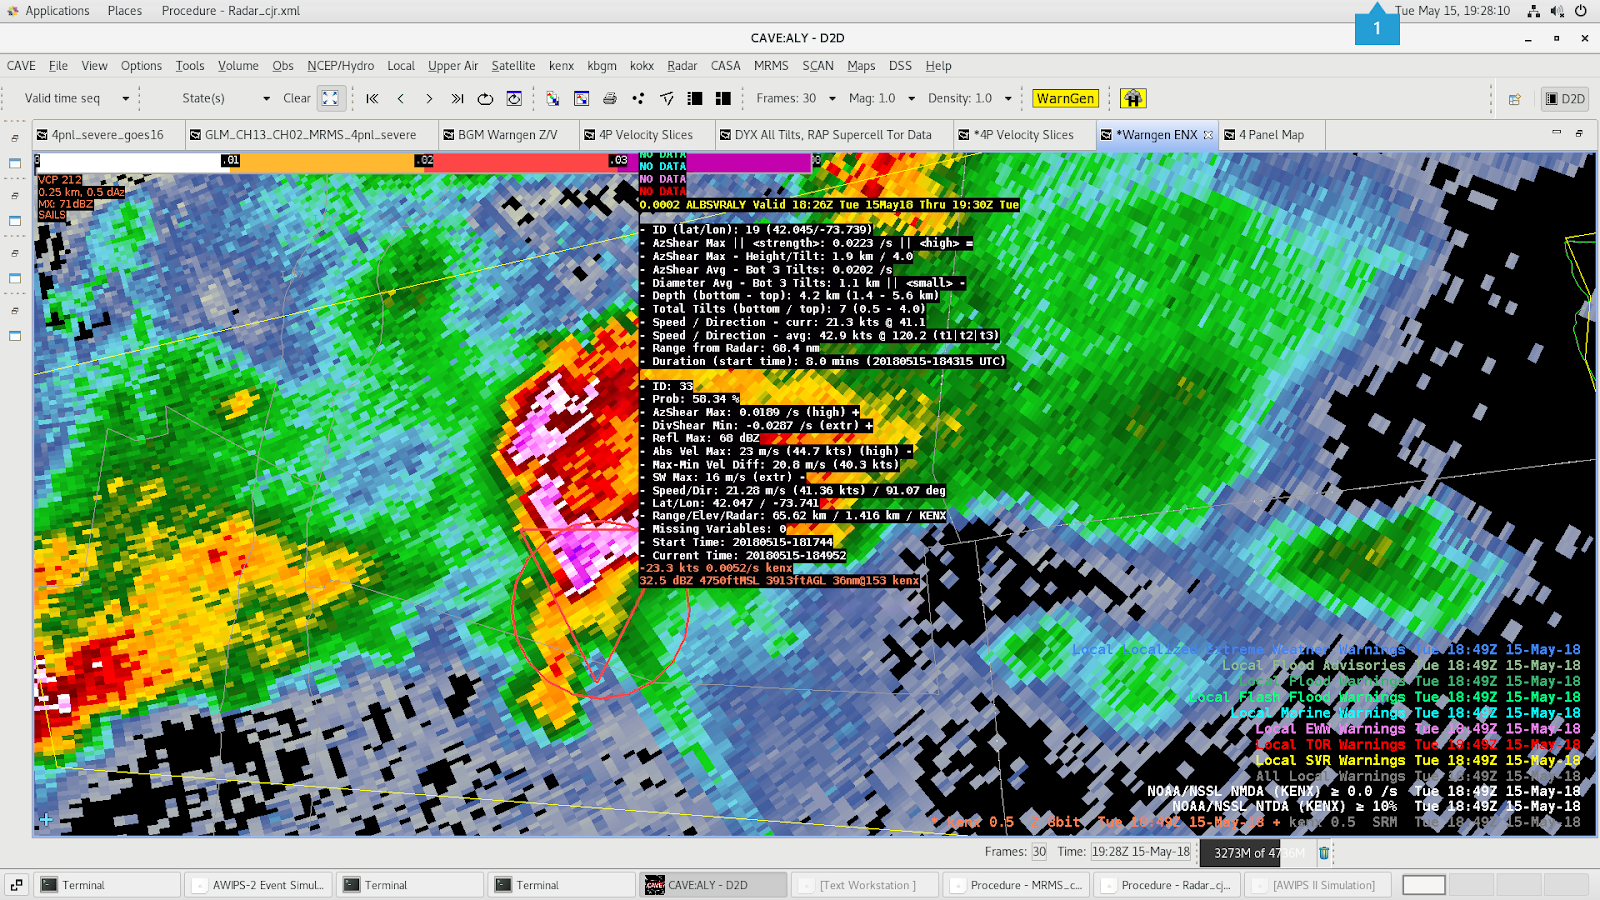
A supercell tracked south of the ENX radar in the archive case. A particularly large hail core produced a TBSS to the south of the storm over the inflow region. This may have produced bad velocity data in the area of interest when examining the Meso/TDA detection. At 18:49Z, there was a high prob in the NTDA and the NMDA was colored in the 3 out of 4 range. But the values really jumped around within a few scans of that time. Possibly because of the TBSS signature. I found that the detection values were much more consistent with the supercell once it moved east and the TBSS was located away from the hook/inflow region. It was important to use nearby radars in this case to avoid the TBSS contamination.

SRM at 18:49Z near the ENX 88D radar
TBSS in Reflectivity at 18:49Z near the ENX 88D radar
CC at 18:49Z near the ENX 88D radar

– Gerry Bertier

Sullivan County Tornado Warning (~1929 UTC 15 May 2018)

A supercell formed along the squall line/QLCS moving through the Catskills and Sullivan County.  The circulation strengthened around 1925 UTC and continued through 1929 UTC  with a deep MESO detected through the lowest 5 tilts of the radar beam and around 100 nm from the KBGM RDA.  The probabilities for a tornado increased to ~60% with a strong inbound velocity and some outbound in terms of the mesocyclonic couplet.  The potential tornado was moving towards KMSV. The two images below show the cursor readout (0.5  DEG, 0.9 DEG, 1.3 DEG of SRM/REF data and 0-2 km Azimuthal shear).  The radar beam is up high, but I felt with a medium strength MESO and high Probs for a TOR from the NTDA that an upgrade from a SVR to a TOR was warranted.

– Yoda777

Three Body Scatter Spike Challenges in NMDA/NTDA Detection

Interesting challenge in today’s Archived Case from WFO ALY. One particular challenge was the presence of Three Body Scatter Spikes (TBSS) present within the inflow region of supercells south of the RDA causing the radar beam to strike hail prior to the rotational signature. Since this phenomenon was more so identified on the lowest tilt, I did not witness any significant anomalously high probabilities from the algorithm, but it did identify a centralized area of rotation (see “stacking” of NMDA and NTDA in images below).

In the meantime, damage from a tornado was being reported in the lead (eastern) cell, which also had lower-end probabilities but within a more trustworthy region of velocity – owing to confidence in the warning. However, using meteorological “common sense” gave me the ability to take the western cell’s algorithm detection less seriously.

Is this a weakness or a strength in the algorithms? Depends on how you look at it. For the lead storm, I was a bit surprised on the lower probabilities, but for the western cell, it gave a prime example on the limitations that exist and where you, the forecaster, come in by having that situational awareness at hand to identify false signals.

KENX 0.5º SRM (Storm Motion from Track: 274º @30kt) 1941Z 5/15/18

– Dusty Davis

False Signals in Areas of Low Power Return/Ground Clutter

Today’s case at EWX presented numerous challenges in a mixed case multicellular/linear convective environment. While closely monitoring for any potential local surges along an eastward surging line segment (already covered with a SVR/TOR POSSIBLE at the time), it was observed several NMDA and NTDA algorithms were lightning up along the front edge of the line.

At this time, I was closely monitoring for any local surges given 0-3km Bulk Shear reached 30-35kts, but the UDCZ (Updraft/Downdraft Convergence Zone) was not line-normal to the shear orientation, meaning it would take a local surge to possibly spin up requiring a proactive tornado warning decision.

This line segment was just west of the EWX RDA at the time, which presented some challenges along the leading edge of the line with ground clutter in an area of low power return causing erroneous velocity (as noted in very high SW).

This was an example of where applying situational awareness to each algorithm is necessary, and false signals can and will appear. This is where the trained eye comes in to further investigate using additional products/scans to gain confidence at what exactly is going on.

KEWX Radar scan 19:28Z 5/18/21. Top left: 0.5º SRM using a storm motion of 254º @22kt, 0-3km Bulk Shear and NMDA/NTDA with cursor readout. Top Right: 0.5 ºSpectrum Width. Bottom Left: 0.5º Base Reflectivity. Bottom Right: MRMS Low-Level Rotational Tracks.

– Dusty Davis

Interesting high prob NTDA Case along bowing segment

A convective complex near the EWX radar developed into a more linear system as it moved east of the RDA. Several low end NTDA detections were made along the line, generally where there were kinks in the velocity field. One detection did end up showing high probabilities of over 80% just north of Gonzales, Texas. This occurred on the northern end of a localized surge in the line. The NTDA peaked at  84% at 21:38Z and again at 82% at 21:42. There was broad rotation in both instances but not a particularly tight couplet. The center of the NTDA detection was over the inflow region of the storm. I’m not sure if this was a tracking issue or maybe I’m misunderstanding the way the polygon is placed . The NMDA showed an azShear Max of 0.0218 /s at 21:38Z but the AzShear Avg never rose above the 0.02 threshold. The NMDA and NTDA were occasionally not co-located.

I’ve overlaid 0-3km bulk shear vectors from the RAP on the screenshots below. The shear direction is nearly parallel to the line before the surge occurred which would not be favorable for tornadogenesis by the three ingredients method. Though there were other ingredients/nudgers that would support tornadic development.

Base Velocity at 21:32Z NTDA Prob at 55%
Base Reflectivity at 21:32Z NTDA Prob at 55%
Base Velocity at 21:38Z NTDA Prob at 83.4%
Base Reflectivity at 21:38Z NTDA Prob at 83.4%

– Gerry Bertier

Tuesday – KEWX Circulation

2138 UTC 18 May 2021 KEWX

KEWX radar was definitely the most active in the mid afternoon on Tuesday.  A QLCS segment formed along or just north of the city with initially multiple circulations along the line with 6 weak to modest NMDA circulations along the line. One circulation looked like a mesovortex on the leading edge along the line (Fig. 1).  The NTDA percentage shot up to 83-84%.  The NMDA was in the medium range with a “high” as AzShear max.  The total tilts from the bottom to top was 0.5-4.0 DEG (7 tilts).   It was at a decent range from the radar at 55 nm.  It definitely looked like a SVR was needed with a tornado tag.  I would have been tempted to issue aTOR.  A consistent time continuity of the MESO would have increased my confidence despite the “High” tornado probability.  The couplet was dominated by outbound velocities based on the SRM data (velocities > 60 kts).  It was nice that the NMDA and NTDA values were co-located. Also notice with the outflow a new cell fires (Fig. 2)  in the second image (SRM velocity data).  The circulation was narrow, compact and gate-gate in terms of the couplet velocities that the WFO KEWX office issued a TOR on that cell.

Fig. 1: 2138 UTC 18 May 2021 KEWX 0.5 DEG Base REF (dBZ) with NMDA and NTDA data overlayed.
Fig. 2: 2138 UTC 18 May 2021 KEWX 0.5 DEG SRM (Kts) with NMDA and NTDA data overlayed.

– Yoda777

Only as Good as the Velocity Data

KEWX – 22:47

Good example to watch the quality of the velocity data…as it could lead to unrealistically high NMDA and NTDA.

Note the very high SW values in lower left hand corner. NTDA probs were near 87% with max/min velocity diff of 51kt. Granted this signature was nearly 100mi from the radar, with the center of the beam nearly 10K ft AGL…so probably not using this for warning decision…but it was still a good reminder for me to QC the velocity data and ask myself “does this make sense”.

-Beltzer

NMDA Depth – Should it be higher?

KEWX – 21:36

Noticed the NMDA was detecting a meso, but only on the lowest 3 tilts (tough to see on screenshot, but lists the 0.5-1.3 tilts)

It looks like it could’ve gone up to at least the 3.1 tilt:

Thought it might be a lag, but even 30 min later it was still only showing lowest three tilts being used. Also thought maybe it was being filtered out due to low Z, but Z was actually higher with height. Interesting situation as to why NMDA wasn’t using higher tilts, even though base velocity suggested suggested it should be.

– Beltzer

Lower Calculated Probability in Higher Confidence Scenario

This was an interesting find during the Archived Case from ILN. Focus was on western portions of Indiana/eastern Ohio at several areas of rotation associated with a multicellular cluster of convection. A tool commonly used to interrogate a potentially tornadic storm’s rotational velocity is the VRshear tool. This tool calculates the Vrot, line distance (end of points), shear (in ms-1) and distance from the RDA. WDTD mentions from their Impact Based Warnings Guidance of around 30kt of rotational velocity being the initial supercell tornado warning threshold. Of course, this has some gray area but is generally expressed as an approximation.

At 0207Z from KILN, a cell was identified to show increasing cyclonic rotation. Vrot was calculated to be at 37kt estimated. NDTA probabilities began relatively low at 21.48% which at this early indication, a warning would have already been required. The next scan at 0208Z showed an increase of Vrot to 38kt, with NTDA probability increasing to 24.85%. One more minute followed at 0209Z showed an obvious increase in Vrot at 44.7kt with NTDA Probability of 32.41%.

KILN 0.5º BR at 0207Z. Distance from RDA: 55nm.
KILN 0.5º BR at 0208Z. Distance from RDA: 55nm.
KILN 0.5º BR at 0208Z. Distance from RDA: 54nm.

This is one of several examples where lowering the current default threshold of 30% was necessary. While tracking of both NMDA and NDTA was very accurate, I was surprised at the lower probabilities. A few calculated parameters were identified to be a potential hindrance at a higher probabilistic value, including high SW (and trending higher) and AzShear Max value actually showing a temporary lowering trend at 0207Z. An interesting situation where having to lower the probabilistic threshold was necessary, and was a bit lower than what was expected but still showed consistency with tracking.

– Dusty Davis

NMDA aids in detecting 1” hail :20 before occurrence

In the archived ILN event, a LSR of 1-inch hail piqued my interest and I wanted to see how the NMDA product handled it.  I used the ILN WSR-88D and the storm at that time was 66NM NW of the Radar. The NMDA product was consistent for the 20 minutes prior to the storm report and I would have felt confident using the product (along with interrogating other base products) to effectively warn/issue Severe TS for this storm.

Wayne County, IN storm producing 1” hail

-AFWXLIFER