Increasing GLM activity in a dying storm

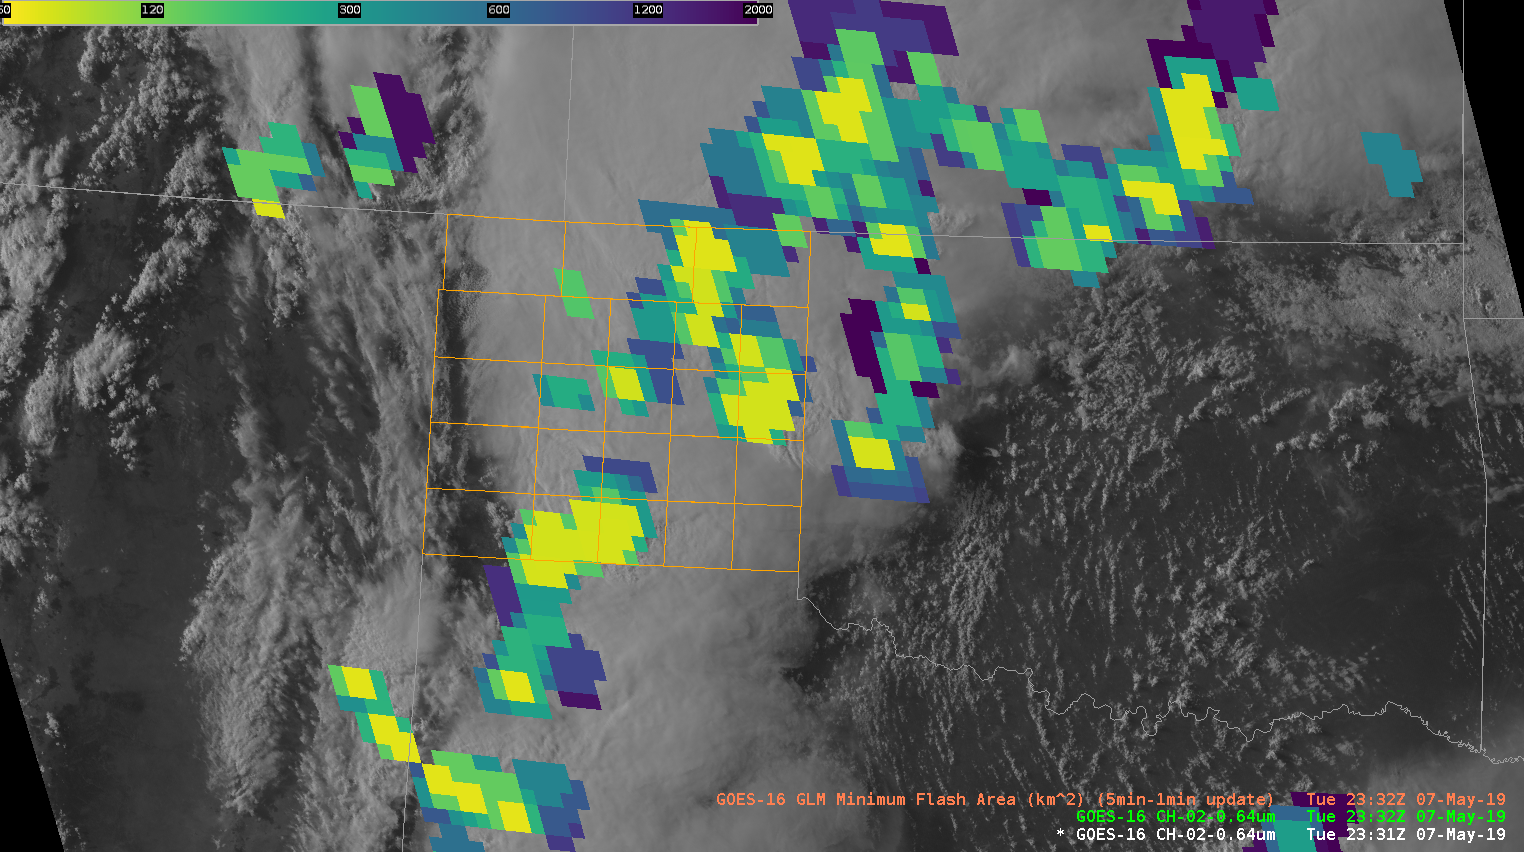
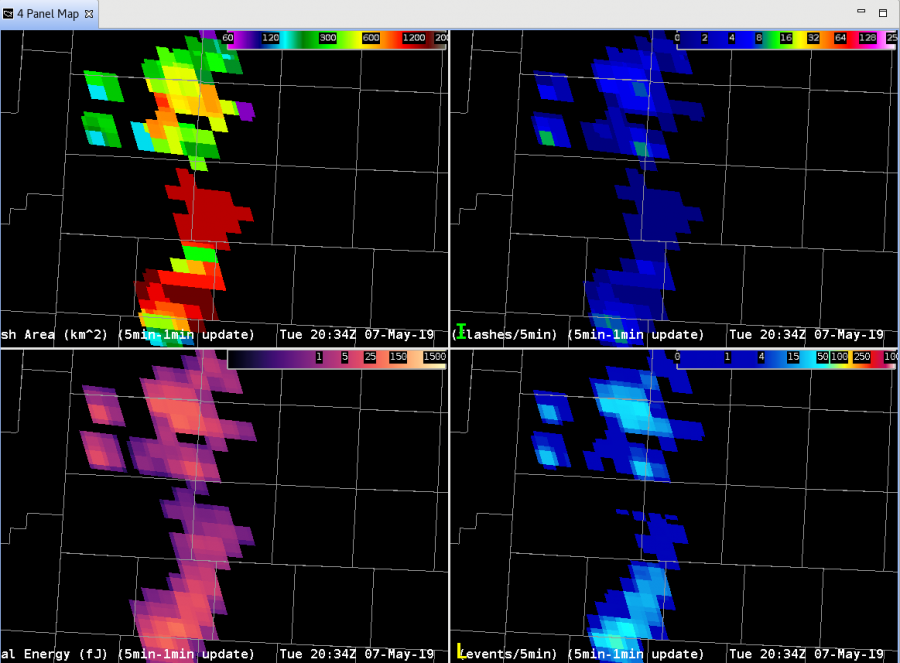
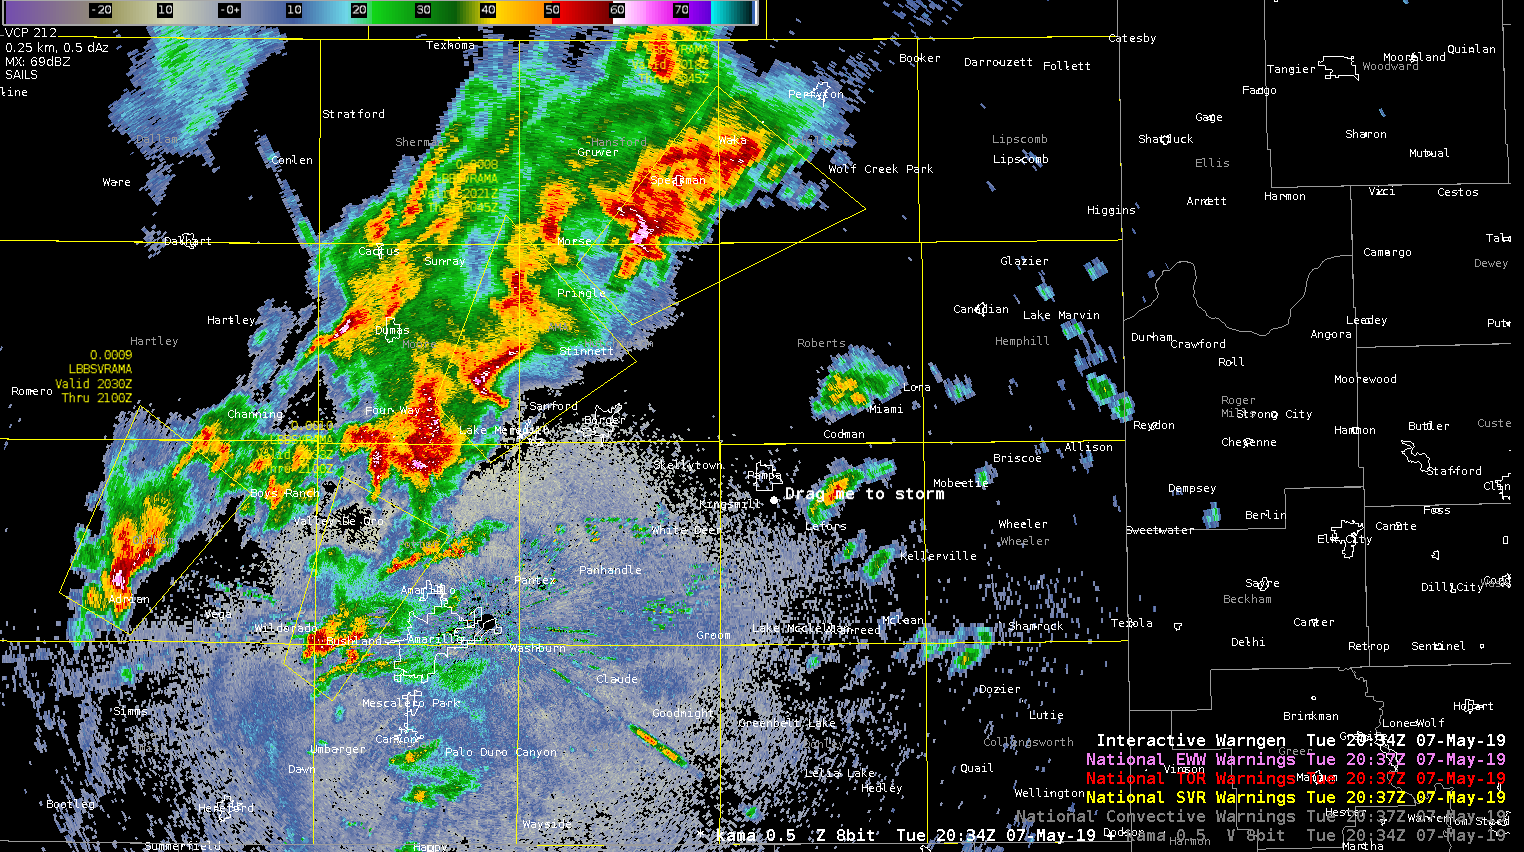
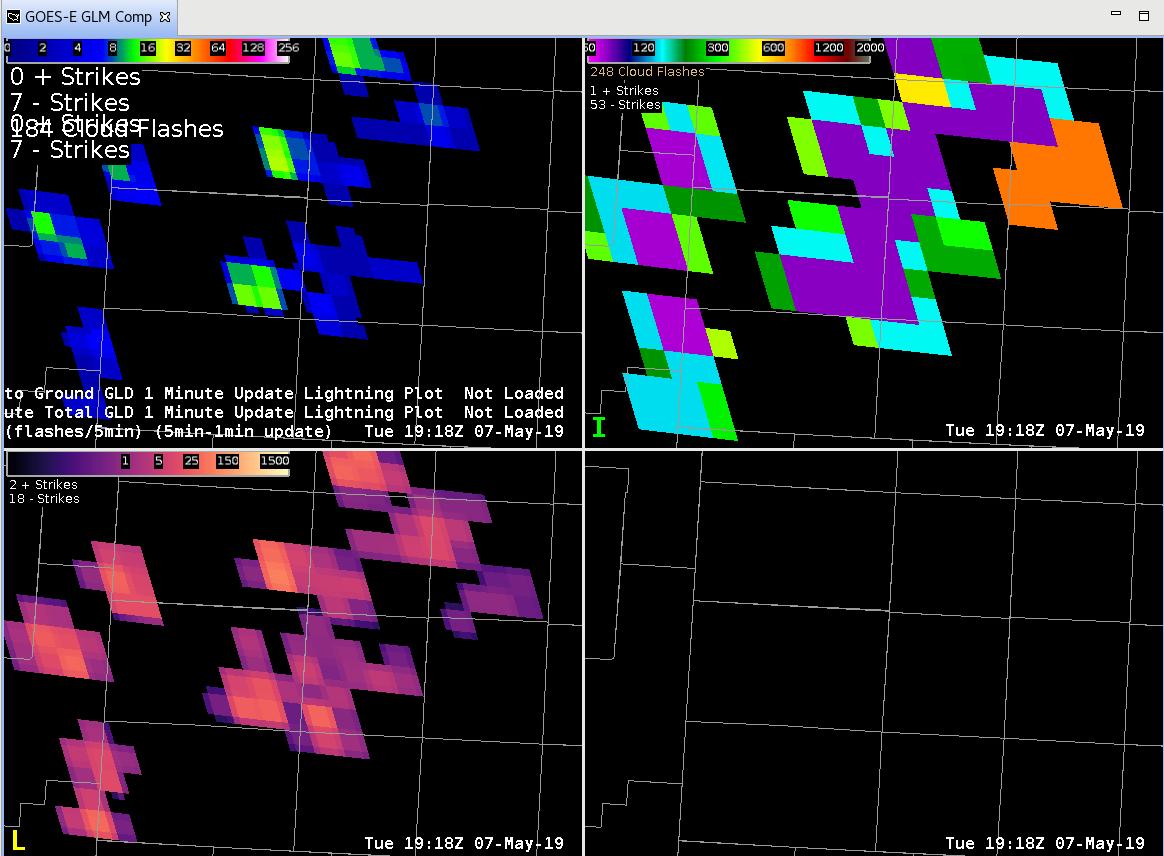
At 2330Z, GLM began picking up a signal of increased lightning activity with a storm moving into the LUB CWA. At the time the core was strong with a spike in value in the MRMS VII product, though real-time radar had started to show a weakening storm. (Left panel shows GLM Event Density)

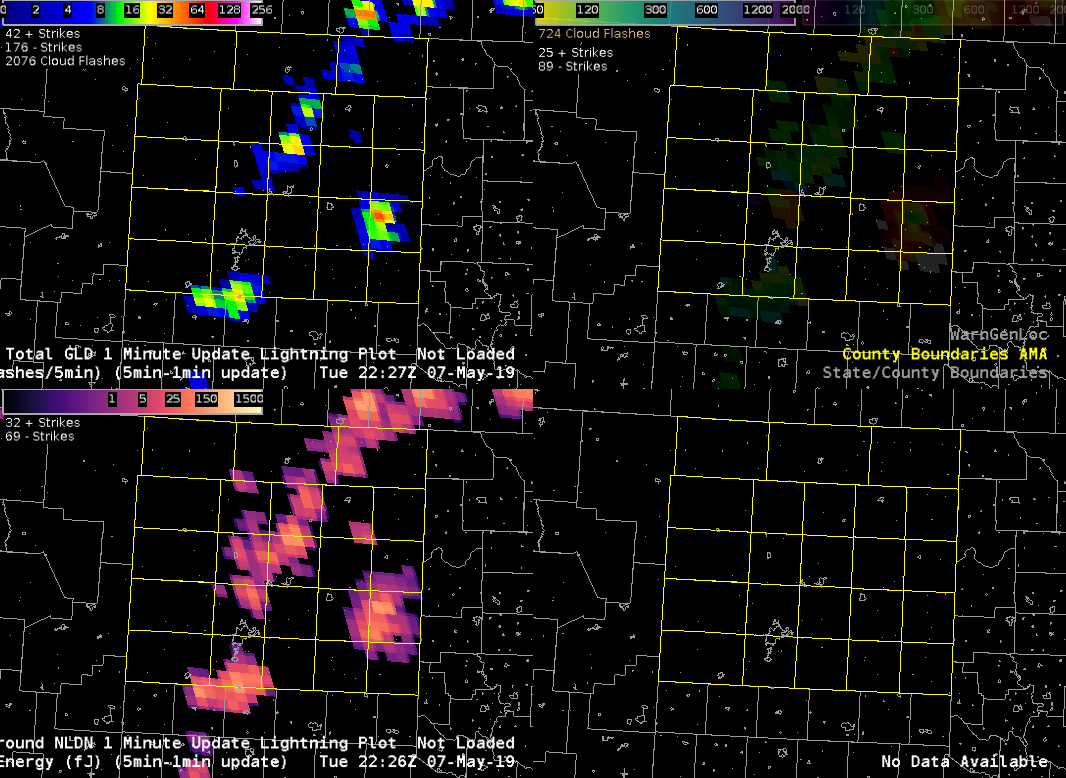
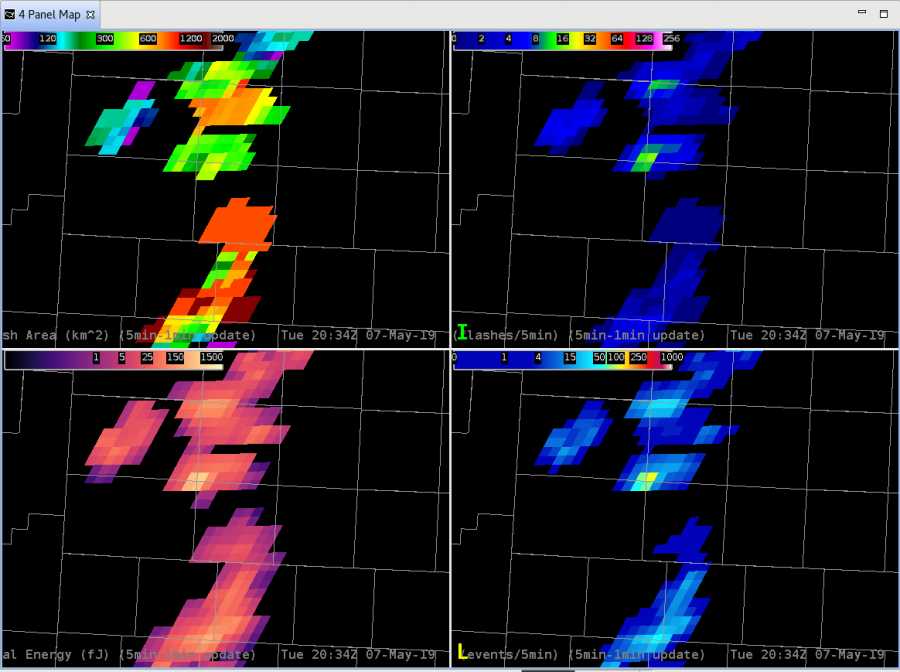
10 minutes later, at 2340 UTC, the storm was deteriorating, yet GLM Event Density continued to increase in this area while ENTLN Total lightning data was decreasing.

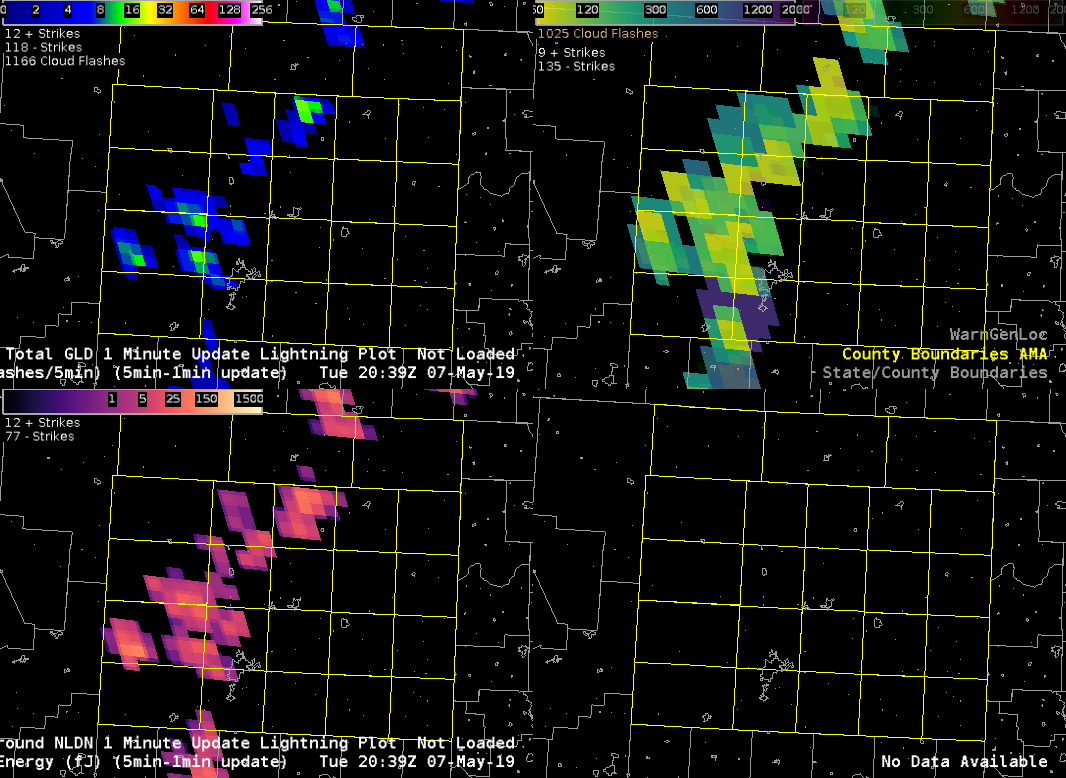
After another 10 minutes, at 2350Z, GLM lightning activity continues to breanch eastward despite little reflectivity aloft and ELTLN lightning continuing to decrease in the area.

Finally, at 2352Z, 2 minutes later there’s a rapid decrease in the lightning activity on GLM in the easternmost storm. The Event Density data was the 5min-1min update, and it looked like 1 minutes worth of data was the result of the eastern extension.

#ProtectAndDissipate

Lightning Jumps in Action

The storm near Tulia is…impressive.  Aside from being a long-tracked supercell, the storm has been extremely active electrically.  There have been several lightning jumps with this storm that appears to coincide with an increase in the strength of the mid-level mesocyclone.  First we will take a look at an hour long loop (TL – Flash Extent Density overlay with Vaisala GLD, TR – Minimum Flash Area, BL –  Optical Energy, BR –  Mid-level Azimuthal Shear (3-6 km AGL) with New Mesocyclone Detection Algorithm Overlay) :

There are two jumps to take a look at, 1) between 21:29 and 21:40, 2) 21:55 – 21:20.  Although the AzShear product doesn’t show a strong mid-level meso developing, the number of positive CG flashes in the GLD data increases and we see continued small area flashes in the core.  The more impressive jump is the second one;  AzShear shows a much more pronounced area of positive shear, a long-lived NMDA indication (the circle with 4 pips on it), and overall smaller flashes in the area of that storm.

Shortly after the last jump (and not shown here), live stormchaser feeds showed a rapid strengthening of low-level features; well defined wall cloud, organized rotation, and frequent CG activity sending a flurry of stormchasers heading east to get out from under the storm…

-Dusty

GLM Helped Situational Awareness

GLM data helped me stay situationally aware as new updrafts quickly strengthen on eastern edge of CWA.

Issued a warning on this cell about ten minutes after upon continued strengthening in the radar fields and prob severe (hail/wind) values rapidly increasing (I find the time series plots very valuable). Given storm environment I expect the storm to continue to strengthen to severe levels.


-icafunnel

Big, Bad Flash or Bad Big Flash…Update

Well, one piece of the puzzle was solved.  A second large flash in the Minimum Flash Area  product occurred between Lubbock and Amarillo, around 1500 km2.  To see what was going on, we now take a look at the difference between GOES-16 GLM:

and GOES-17 GLM:

After a LOT of going back and forth, we realized that the color table for Flash Extent Density had the alpha at zero for anything around 1.0 to 1.244.  SO, the previous example that showed no FED actually DID have data associated with the large flash; it was hidden (my bad!).  Fixing the color table to plot any data greater than zero at the darkest color blue and…voila! The large flash now does show a FED of 1.0.  So that problem is now solved.

However, there is still a question as to why that big area flash occurred where it did, when it did, and if it was actually as large of a flash as indicated.  Still something to dig into further!

-Dusty

Used GLM to Issue SVR

I’d been watching a multicellular cluster that was trailing a leading supercell to the north of Amarillo. Had been waiting on issuing due to ProbSevere and Mesh levels, but GLM FED increased and reflectivity / VIL /core height all responded so I issued a warning at about 2040Z

Big, Bad, Flash or Bad Big Flash

Everything was chugging along great with the GLM and the storms around Amarillo this afternoon as this image from 19:54 shows (TL – Flash Extent Density 5-minute w/ 1-minute update with Vaisala GLD Data overlayed, TR – Minimum Flash Area with ENI Total Lightning overlayed, BL – Total Optical Energy with Vaisala NLDN overlayed, BR – IR/VIS Sandwich):

But then the next set of data arrives at 19:55:

So, that big white area showed up which is a 2918 km2 area flash.  WOW.  THAT. IS. HUGE.  But the question now becomes is that correct or not?  Taking into account parallax and the data from the ground-based networks shows that there was electrical activity in the general area.  However, it isn’t in the area that would line up with the parallax; the ground-based network data should be closer to the southeastern area of the flash.  Also of interest is that there is no Flash Extent Density associated with the large flash but there is an associated area of Total Optical Energy.

One thing we are tossing around here is the possibility of a cloud reflection; here is the 1-minute visible mesoscale scan with the big flashes overlayed:

If there was indeed a flash at this time, the optical energy could have reflected from the originating area off the anvil, and then reflected back off the low clouds around the updraft to the GLM instrument.  However, the fact that there isn’t any data associated with this flash in Flash Extent Density is concerning.  Needless to say, the lightning scientists here are all going “Hmmmmmmm….”

-Dusty

GOES 17 May Have Better Angle of TX S Plains Storms

Due to the location of GOES 17 and GOES 16 , forecasters may want to consider the satellite’s angle of view for convection. In this example, GOES 17 has a better “viewing angle” into developing convection across west Texas.  Optical brightness has been brighter than GOES 16 and a better output of Extent Density.

5-Minute with 1-Minute vs. 1-Minute GLM Min Flash Area

So, the first thing looking at today is the best way to display Minimum Flash Area.  This is a nice addition to the Flash Area products and seems to have some utility in displaying the state of convective growth.  As a reminder, smaller flashes are usually indicative of new or strengthening convection while larger flashes are mature/decaying/sustaining stages of convection.  This will come in handy with a lot of convection to see which cores may be the strongest in any given area.

The problem is the best way to view this information; the 5-minute with 1-minute updates seems to have worked well in the past for most of the GLM data but seems to cause some problems with the Minimum Flash Area.  Case in point, here is a 4-panel with the 5-minute/1-minute update from the Texas Panhandle north of Amarillo (TL – Flash Extent Density, TR – Minimum Flash Area, BL – Total Optical Energy, BR – empty; note, non-default color tables on the top row!):

Wow!  That’s a pretty large area of small flashes (purple).  BUT, it’s a total from the last 5-minutes so storms could have moved, strengthened, weakened, dissipated, etc. in that time.  What does the “regular” 1-minute plot look like?

Huh?  Where did all the small flashes go?  Well, the small flashes (purple) in this case are likely where the GLM is seeing the strongest updates in the last minute, not the last 5 minutes.

Something to consider when looking at rapidly developing convection, storms that are moving fast, or storms that are pulsing with rapid time intervals; the 5-min with 1-min update can mask important details when it comes to storm electrification!

-Dusty