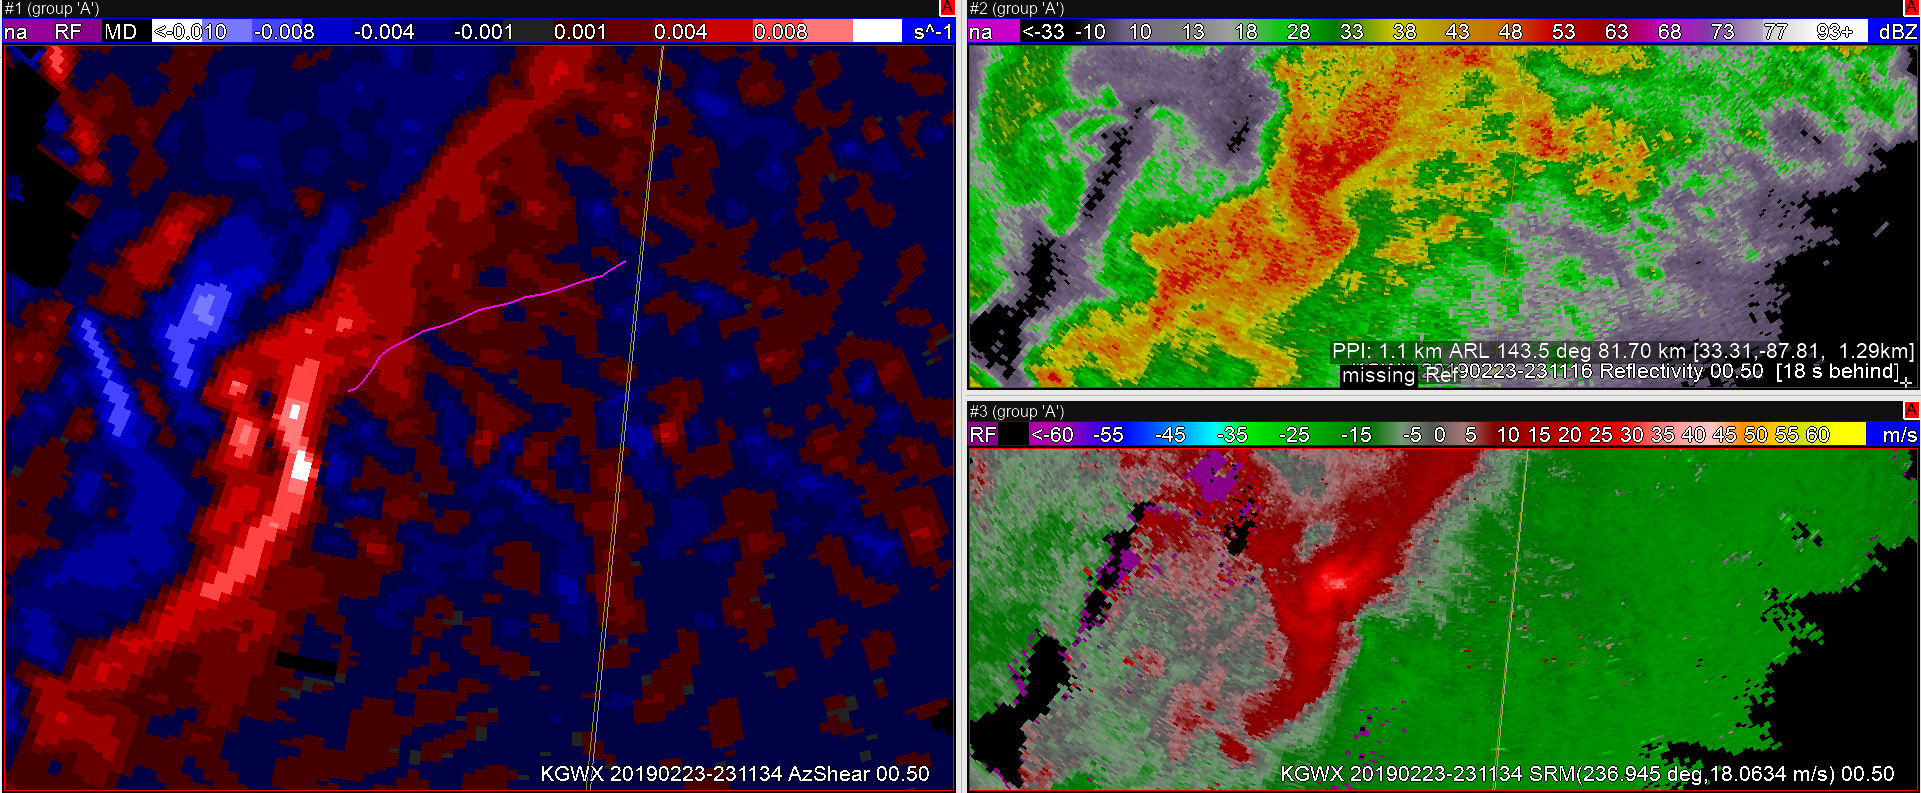
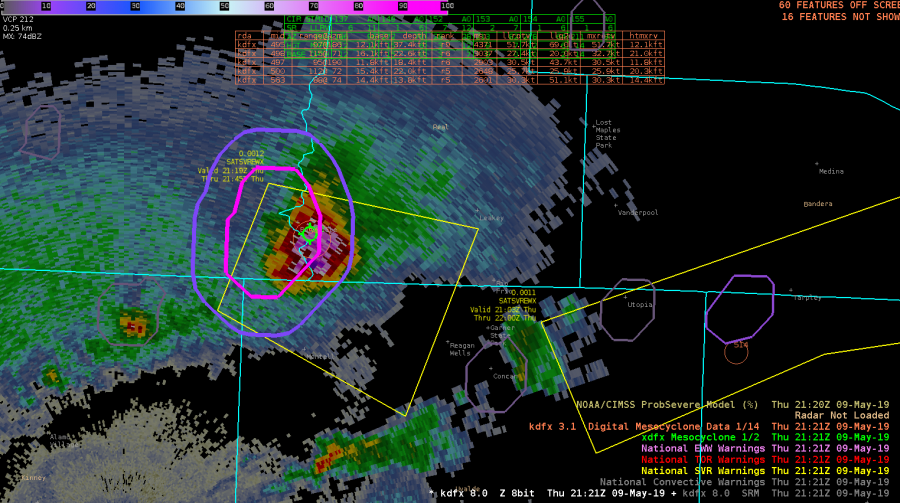
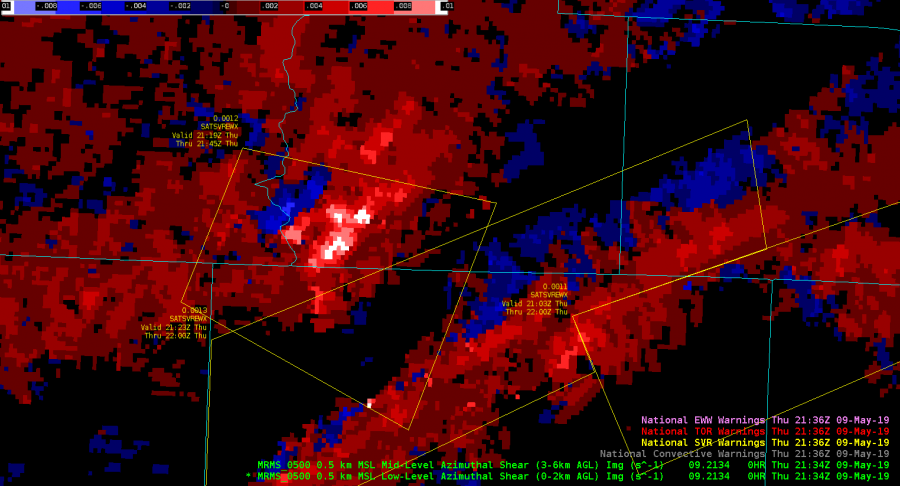
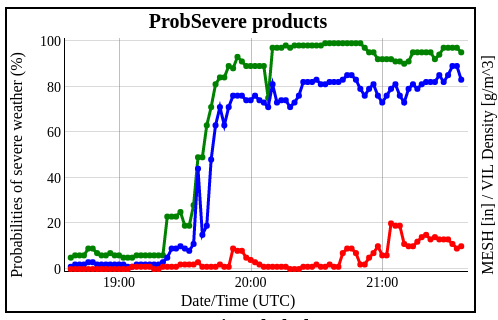
As the case study begins, having had the weather brief of the situation, my initial intention is focused on the supercell east of the surface low ahead of the cold front line. At 2013 I notice in the merged AzShear producing a line of cyclonic vorticty farther west. Looking linear and relatively disorganized on reflectivity and velocity (0.5-1.3) my attention returns to the likely tornadic supercell approaching the GA state line.

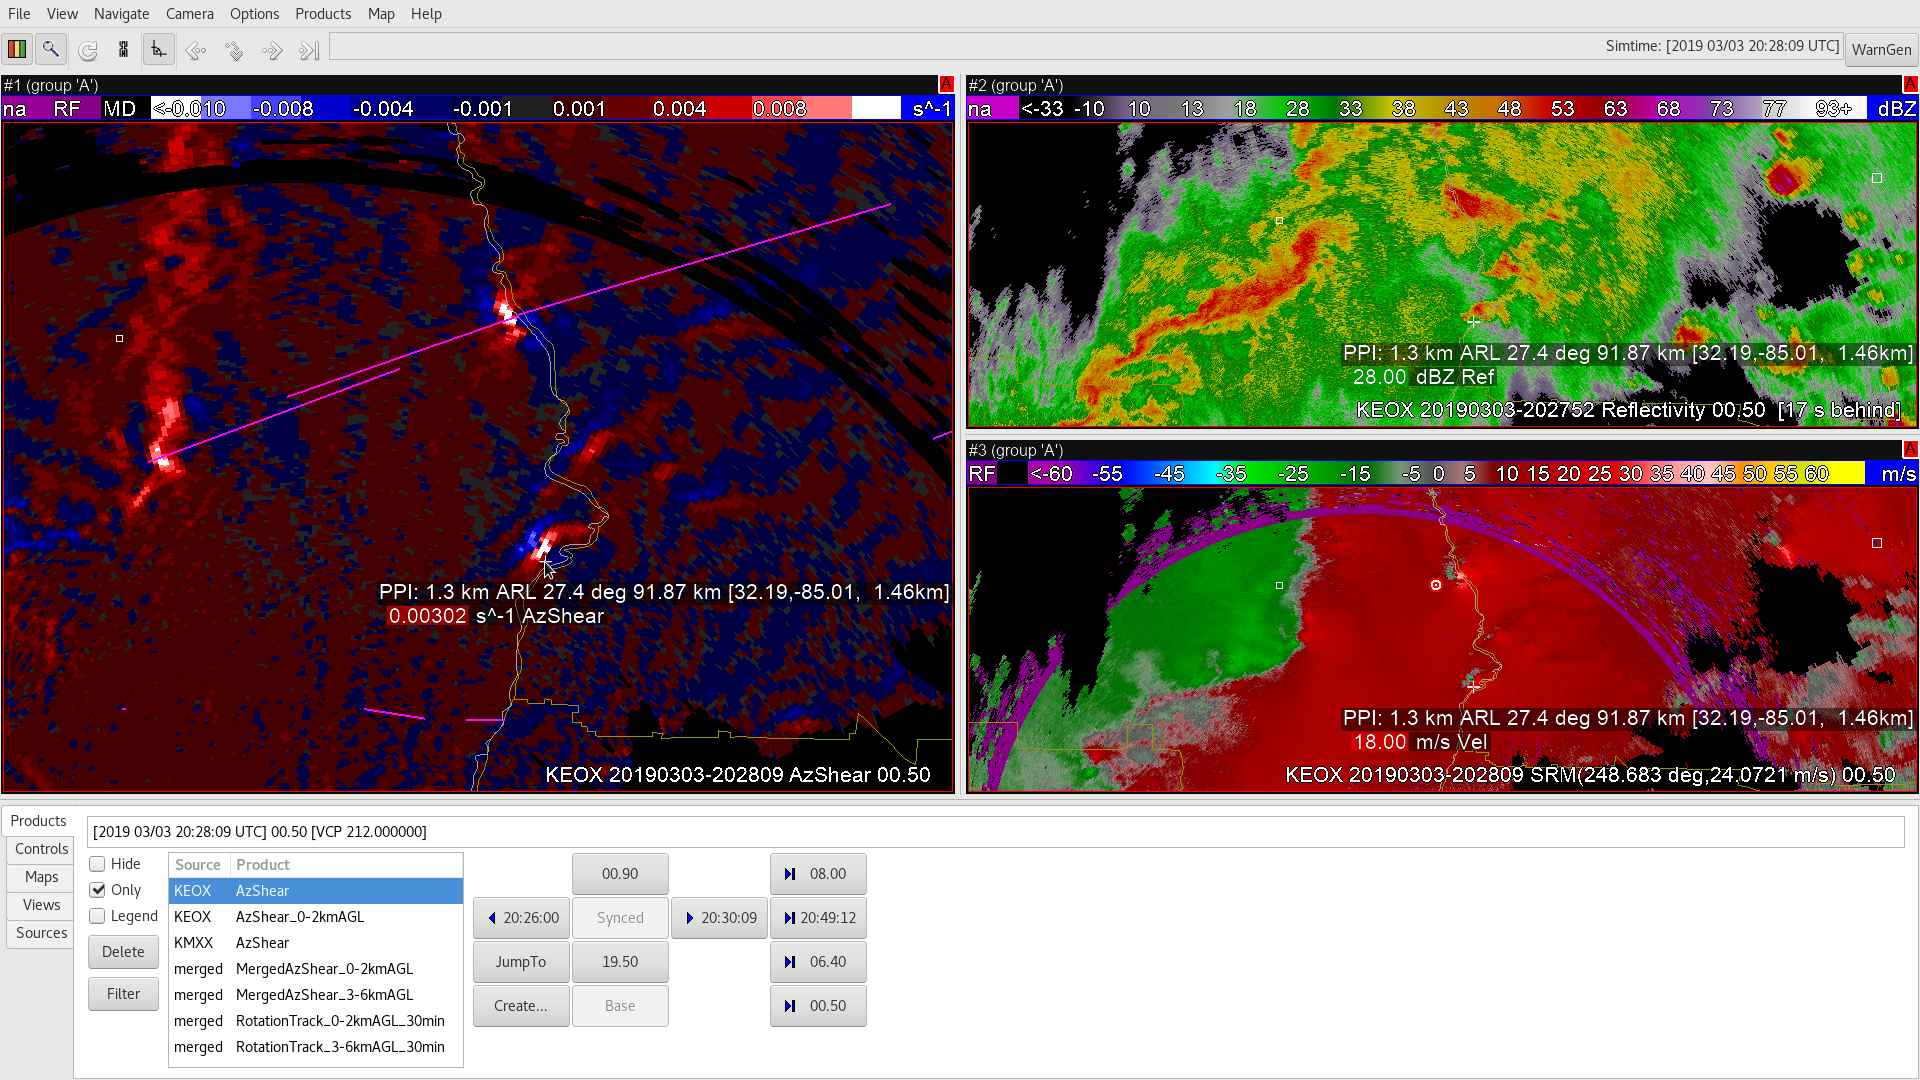
However, in walking back through the data a little, I happened to look at the EOXAzShear product at 2016. This view looks much less linear with the updraft on the northern extent of the lint that stretches along the cold front to the low. If I only had the merged AzShear product with the MXX reflectivity/velocity at the time, I’m not sure I would’ve caught this updraft. By 2019, a velocity couplet is becoming apparent in the .5 degree vel data from MXX with the trailing storm.

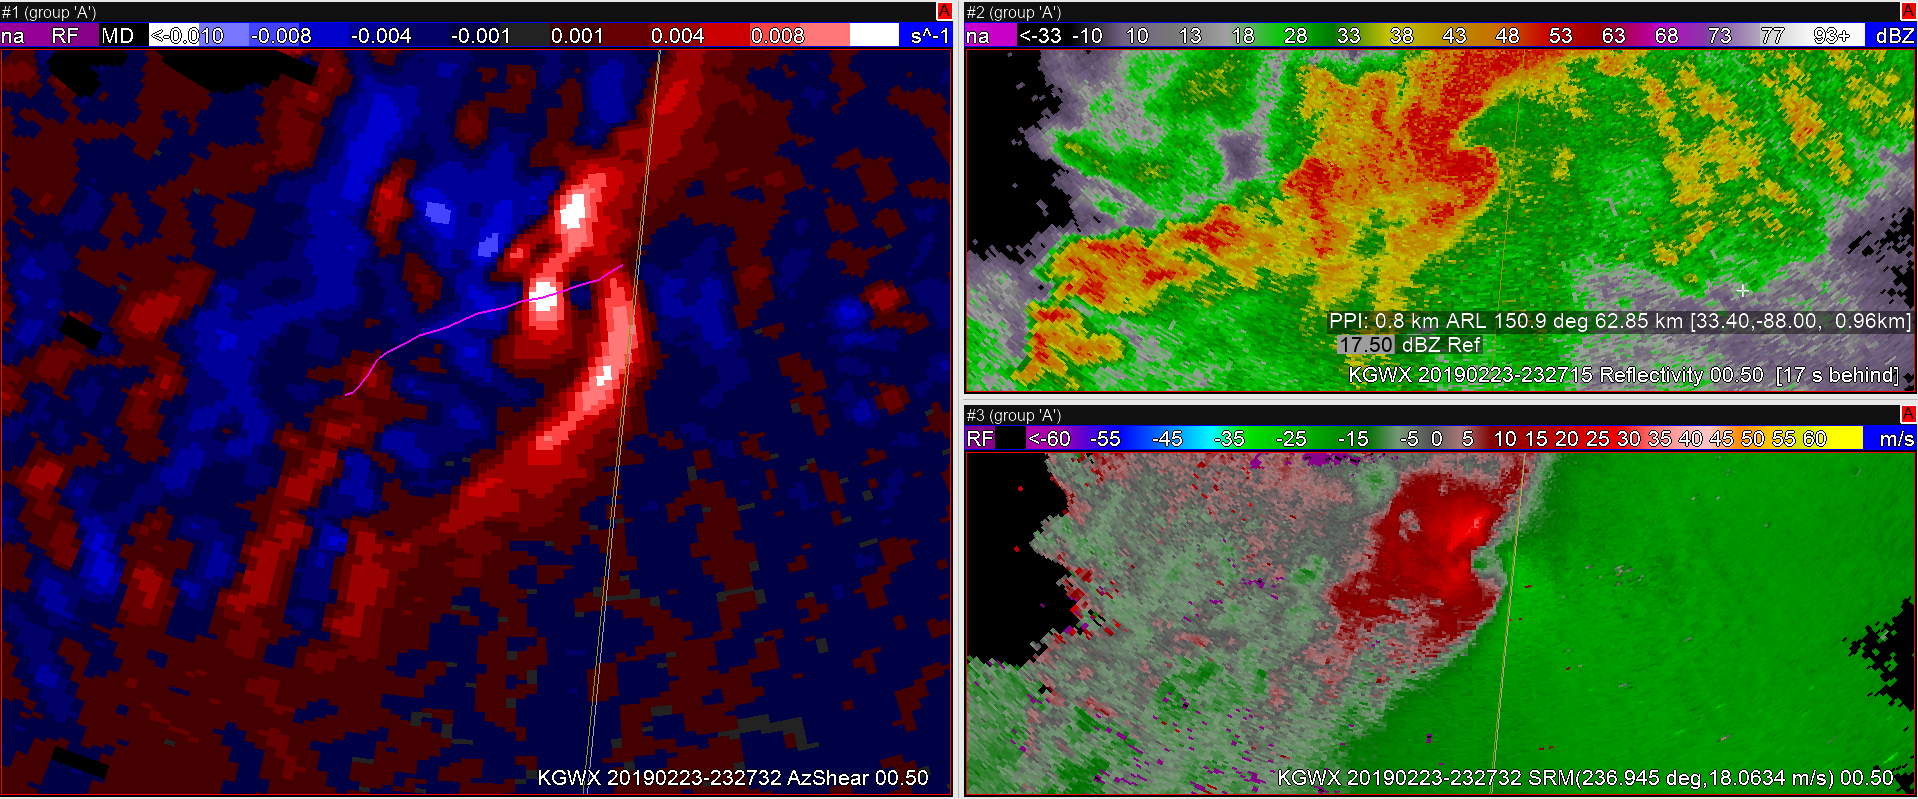
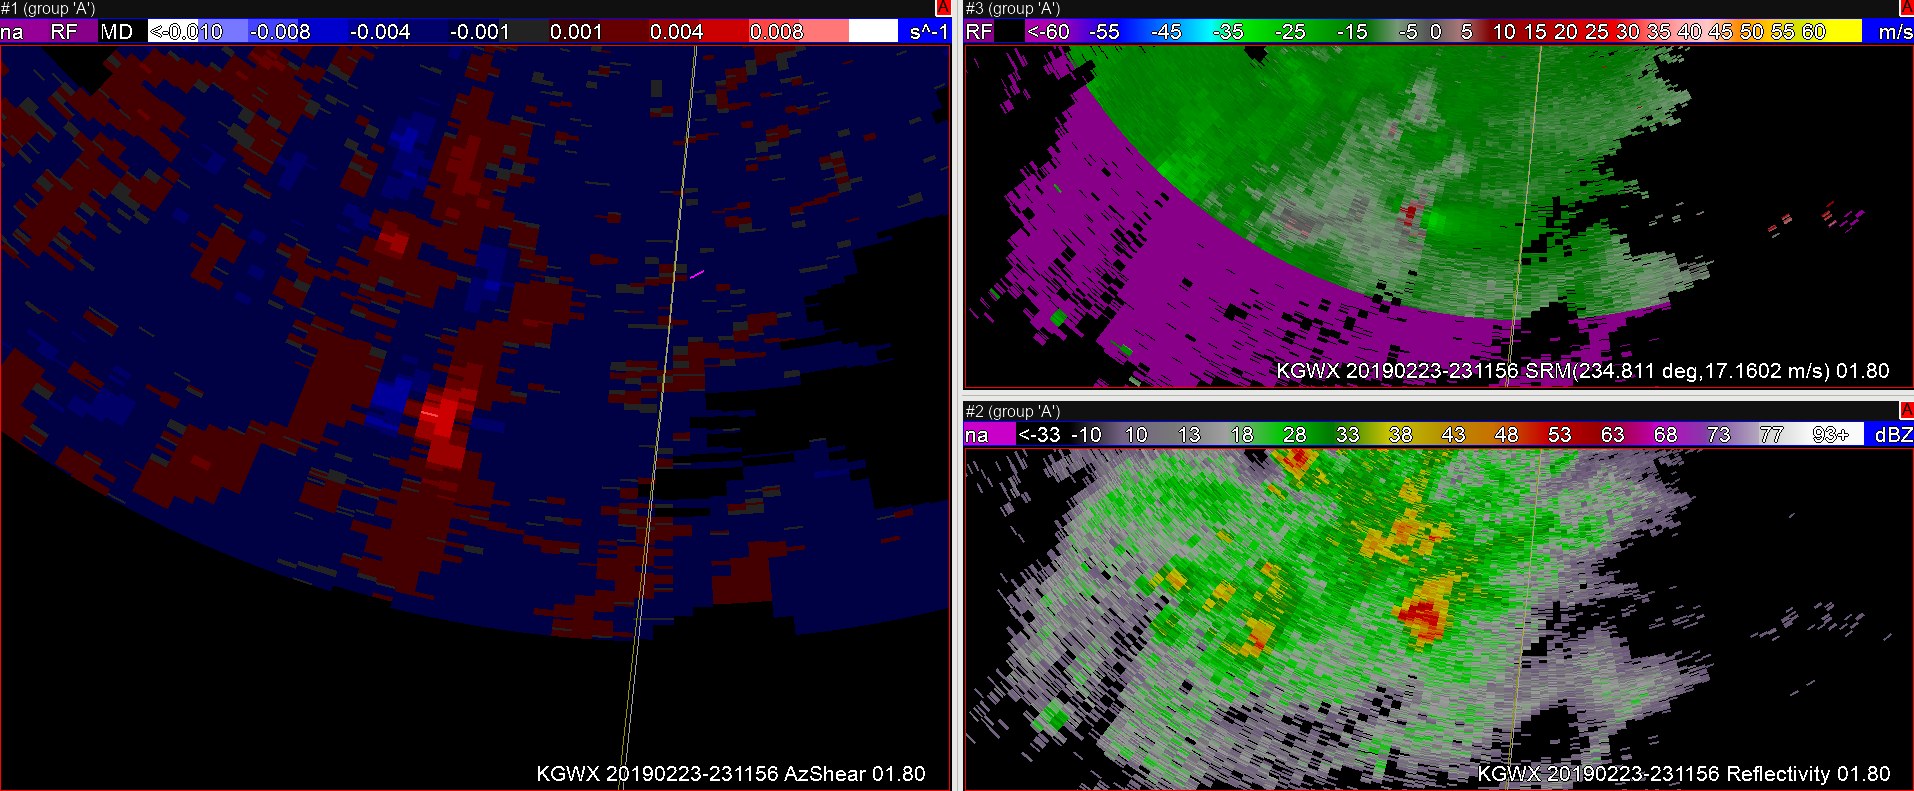
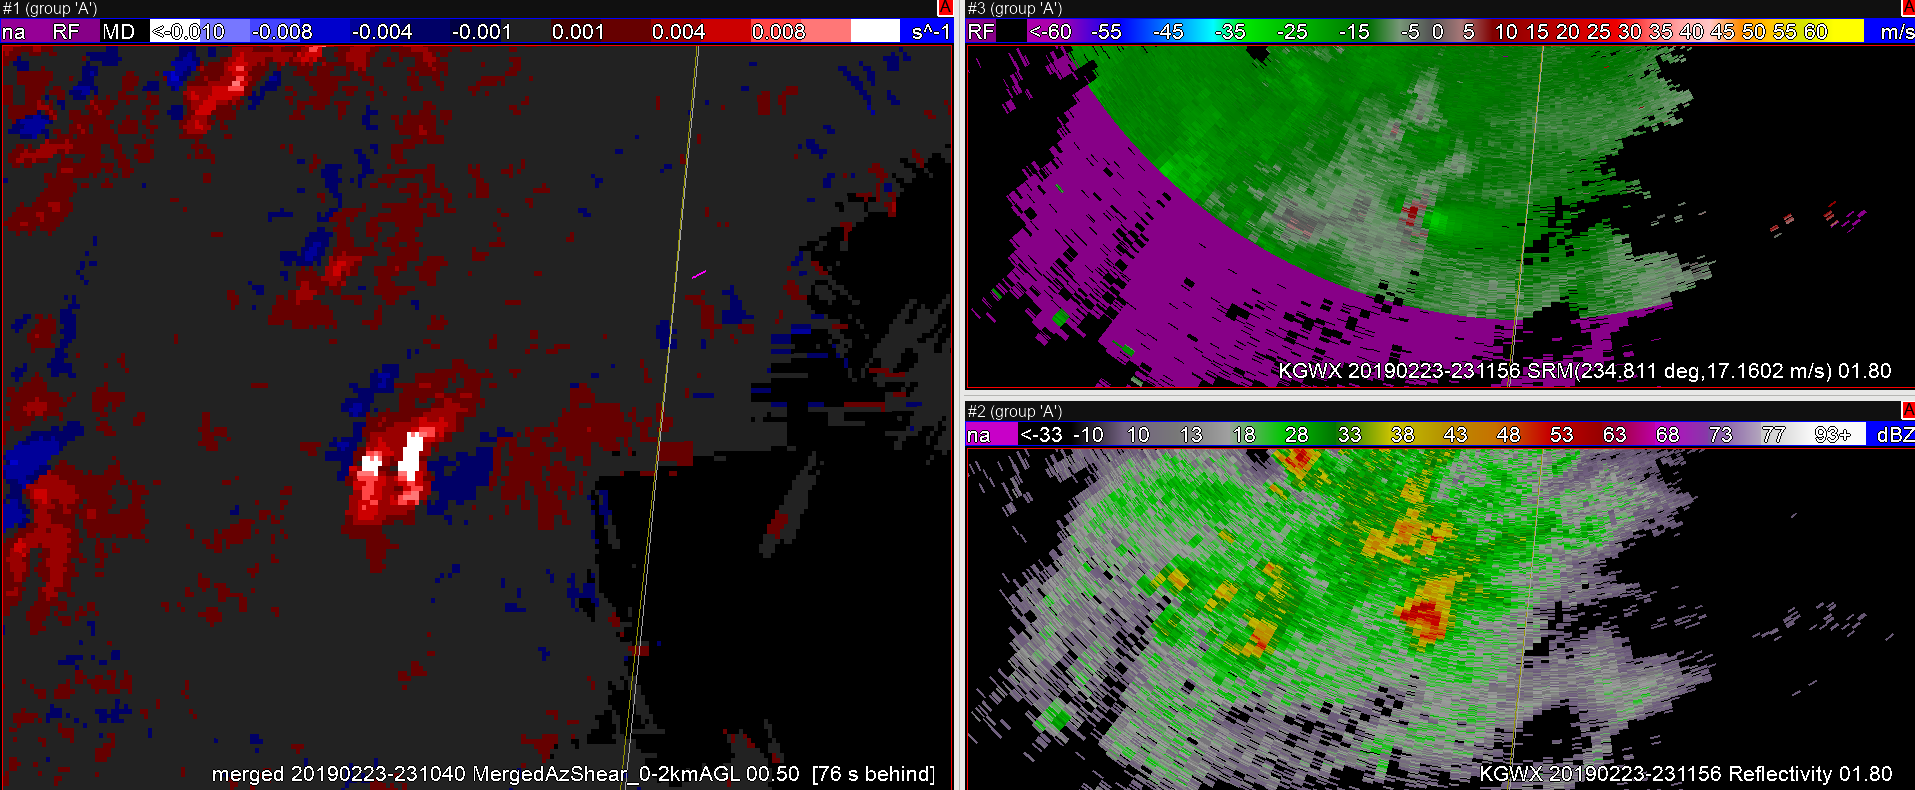
The merged AzShear product does show an increase in cyclonic vorticity with the trailing cell from 2010 to 2019. Also rotation tracks is beginning to track the circulation center in earnest from 2015-2019. The development of this circulation given the storm position from the radar makes the circulation difficult to detect to the eye, even increasing vertically in the volume scan, so the suite of shear products, particularly the ability to view the storm differently in the single site AzShear products helped me to detect the developingd circulation in the trailing cell on the northern end of the line that I may not have seen in a timely fashion in real time without that data.

As the first supercell is crossing the state line, both the single site MXX AZShear product and the merged rotational track products both more clearly show the likelyhood of a tornado compared to the MXX vel data, a trend that continued as the circulation crossed into western GA. Having the single-site AzShear products likely would have been an important additional to tool to the realtime warning forecasters on this day.
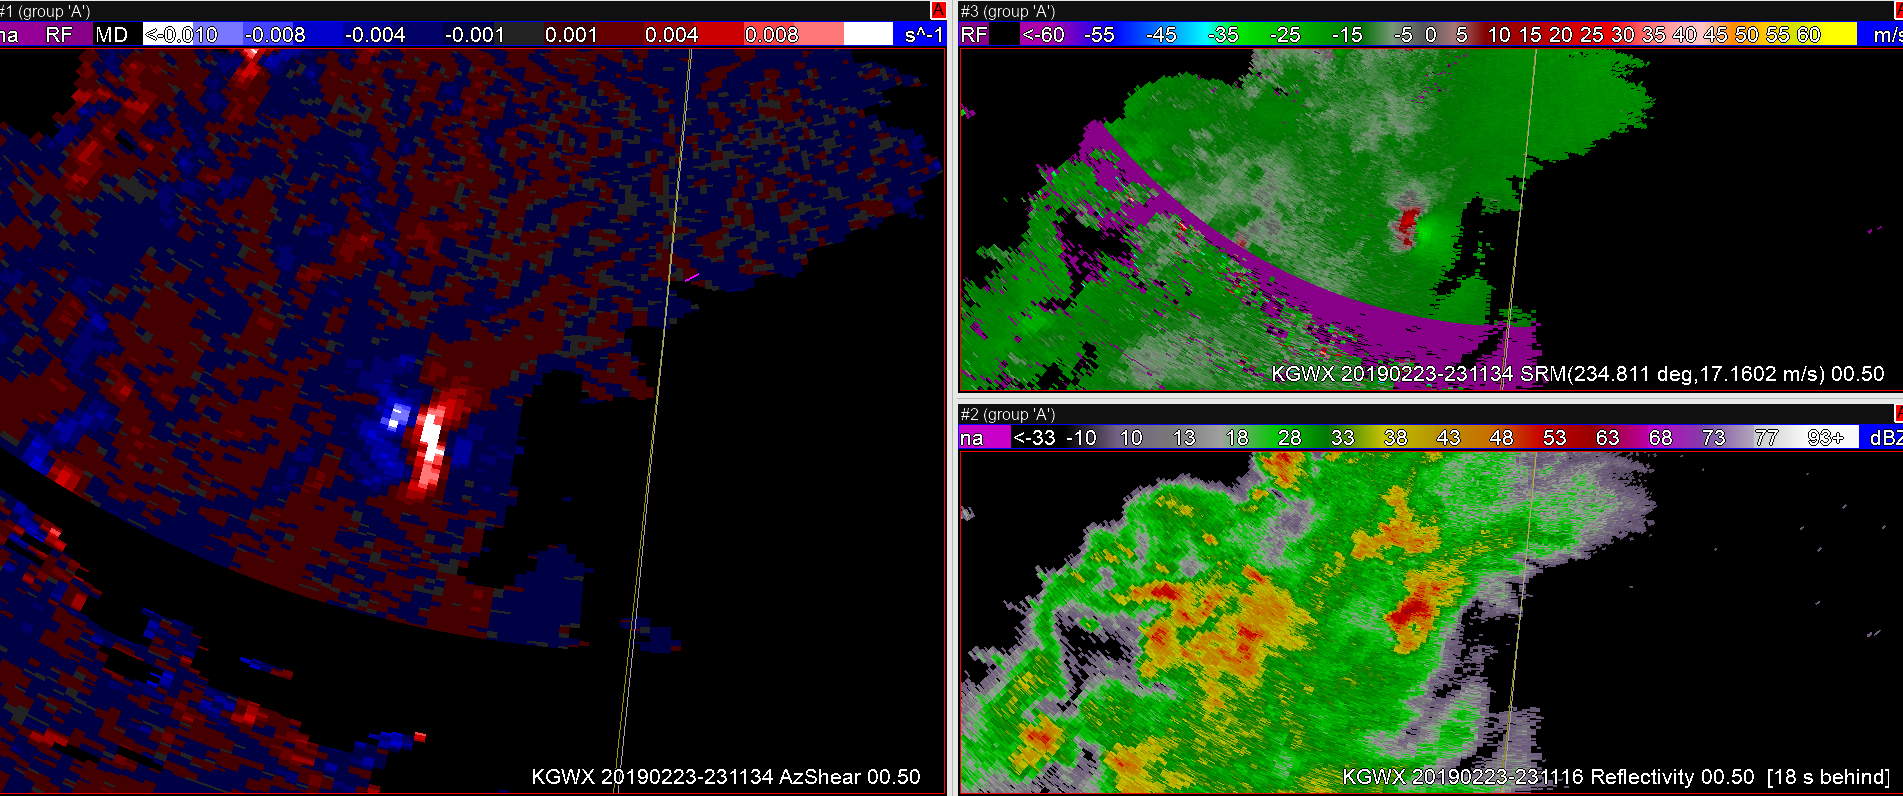
From a situational awareness perspective on the larger view in covering this day, I find for me that the ability to see the single site AzShear products is more effective to me than either the merged AzShear or the rotation tracks to find other circulations of interest that would need at least interrogation from additional warning forecasters in addition to the two main tornadic storms.
-icafunnel


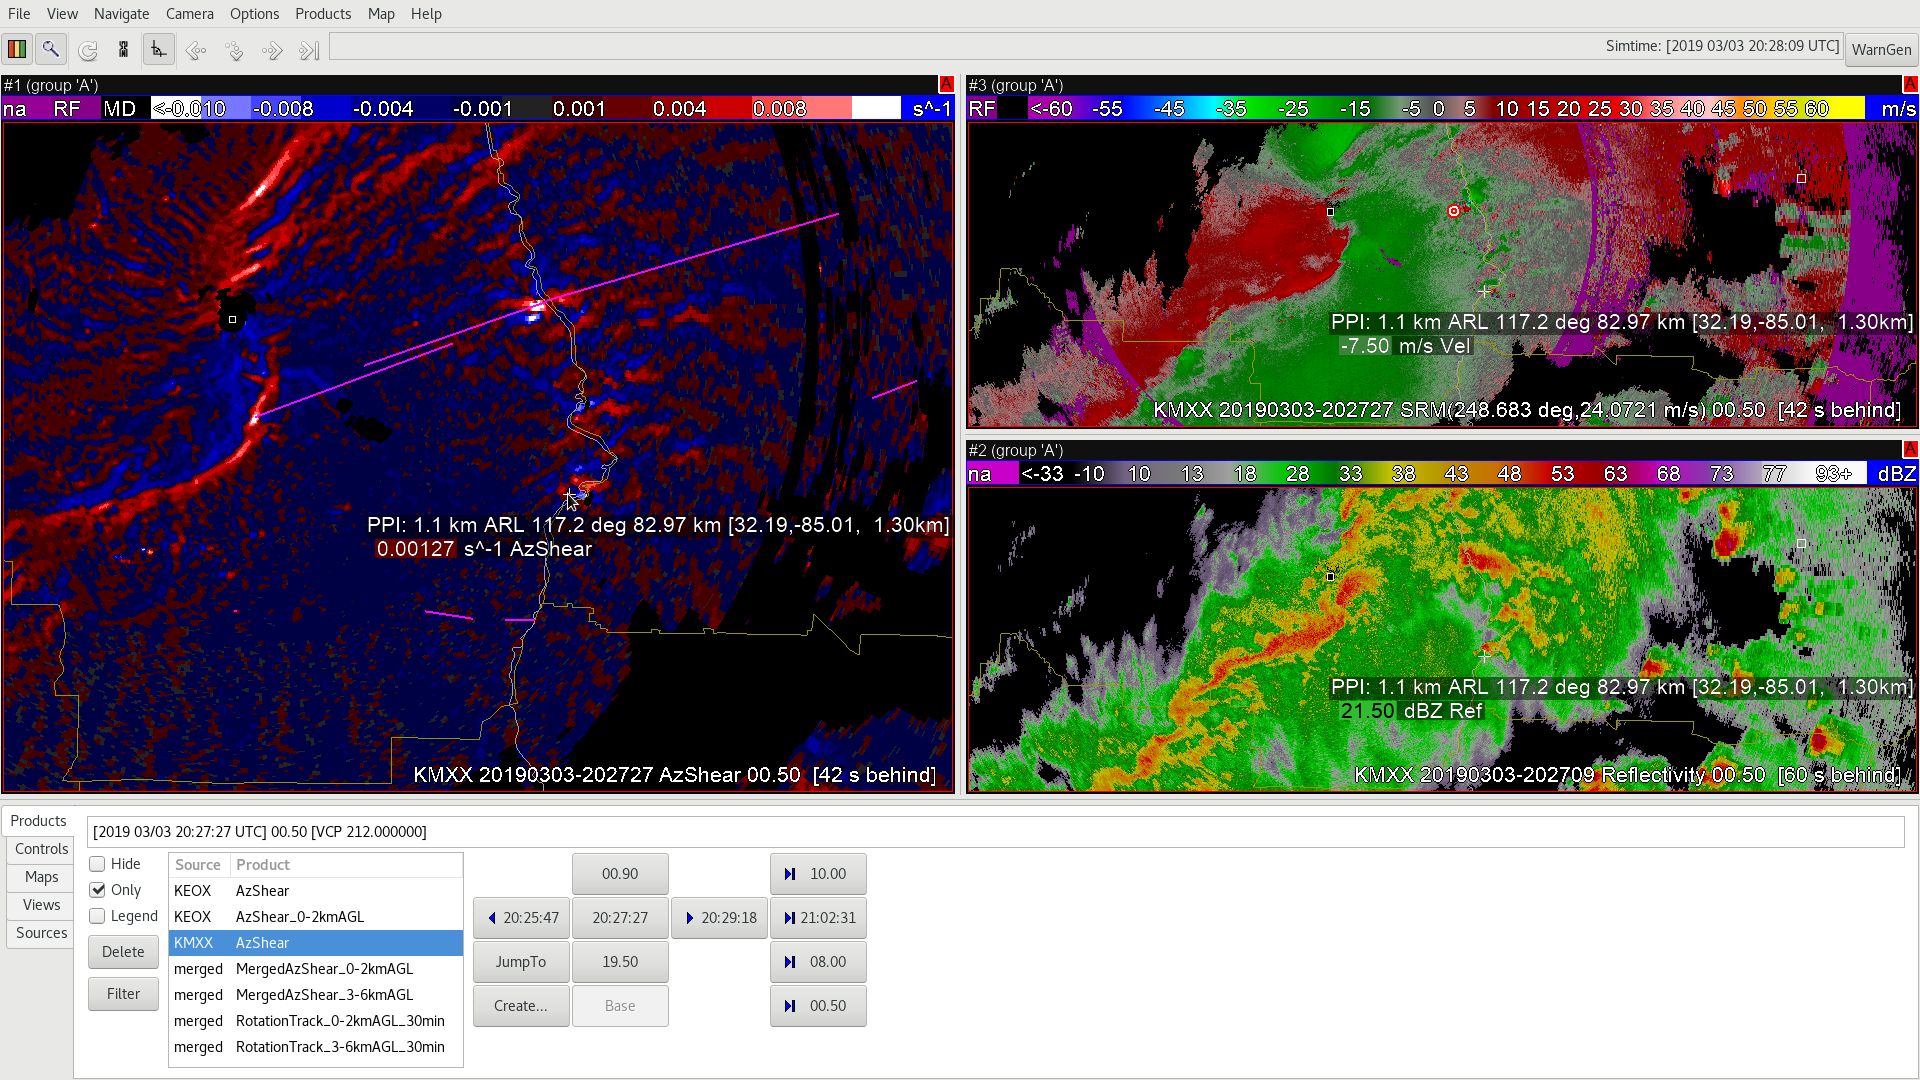
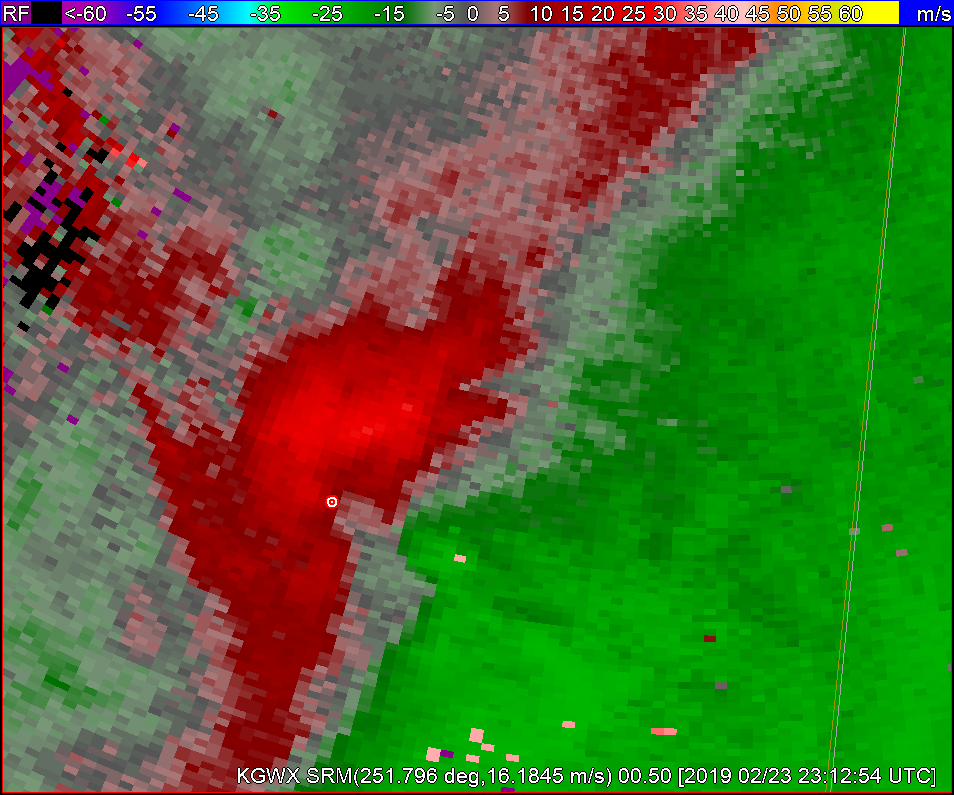

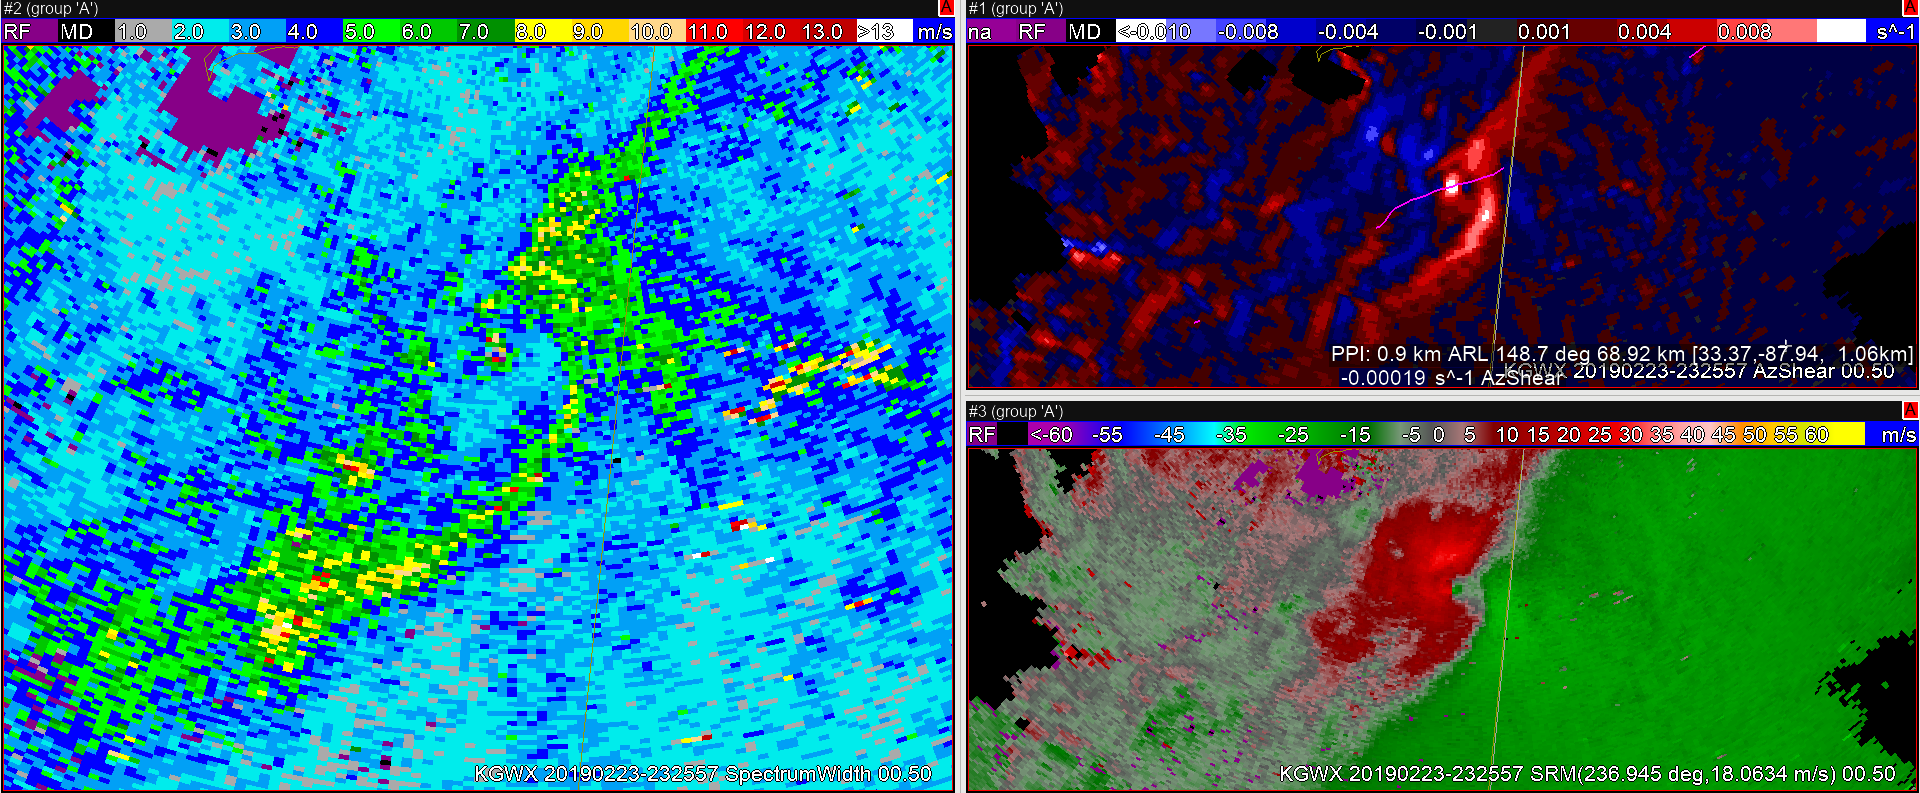
 Above is an example of those three products with my mouse over the circulation center for reference. In particular, I grabbed the 0.9deg radar tilt to get the middle of the averaged layer (~1km AGL). Because of this multi-maximum issue in the merged product, I find the main AzShear product more useful and trustworthy than the merged product with this particular case.